The same plot in 14 other libraries — JavaScript: Chart.js, D3.js, Apache ECharts, MUI X Charts; Python: Altair, Bokeh, lets-plot, Matplotlib, Plotly, plotnine, Pygal, Seaborn; R: ggplot2; Julia: Makie.jl. Compare all 15 side by side: Basic Hexbin Plot in Python, R, Julia and JavaScript.
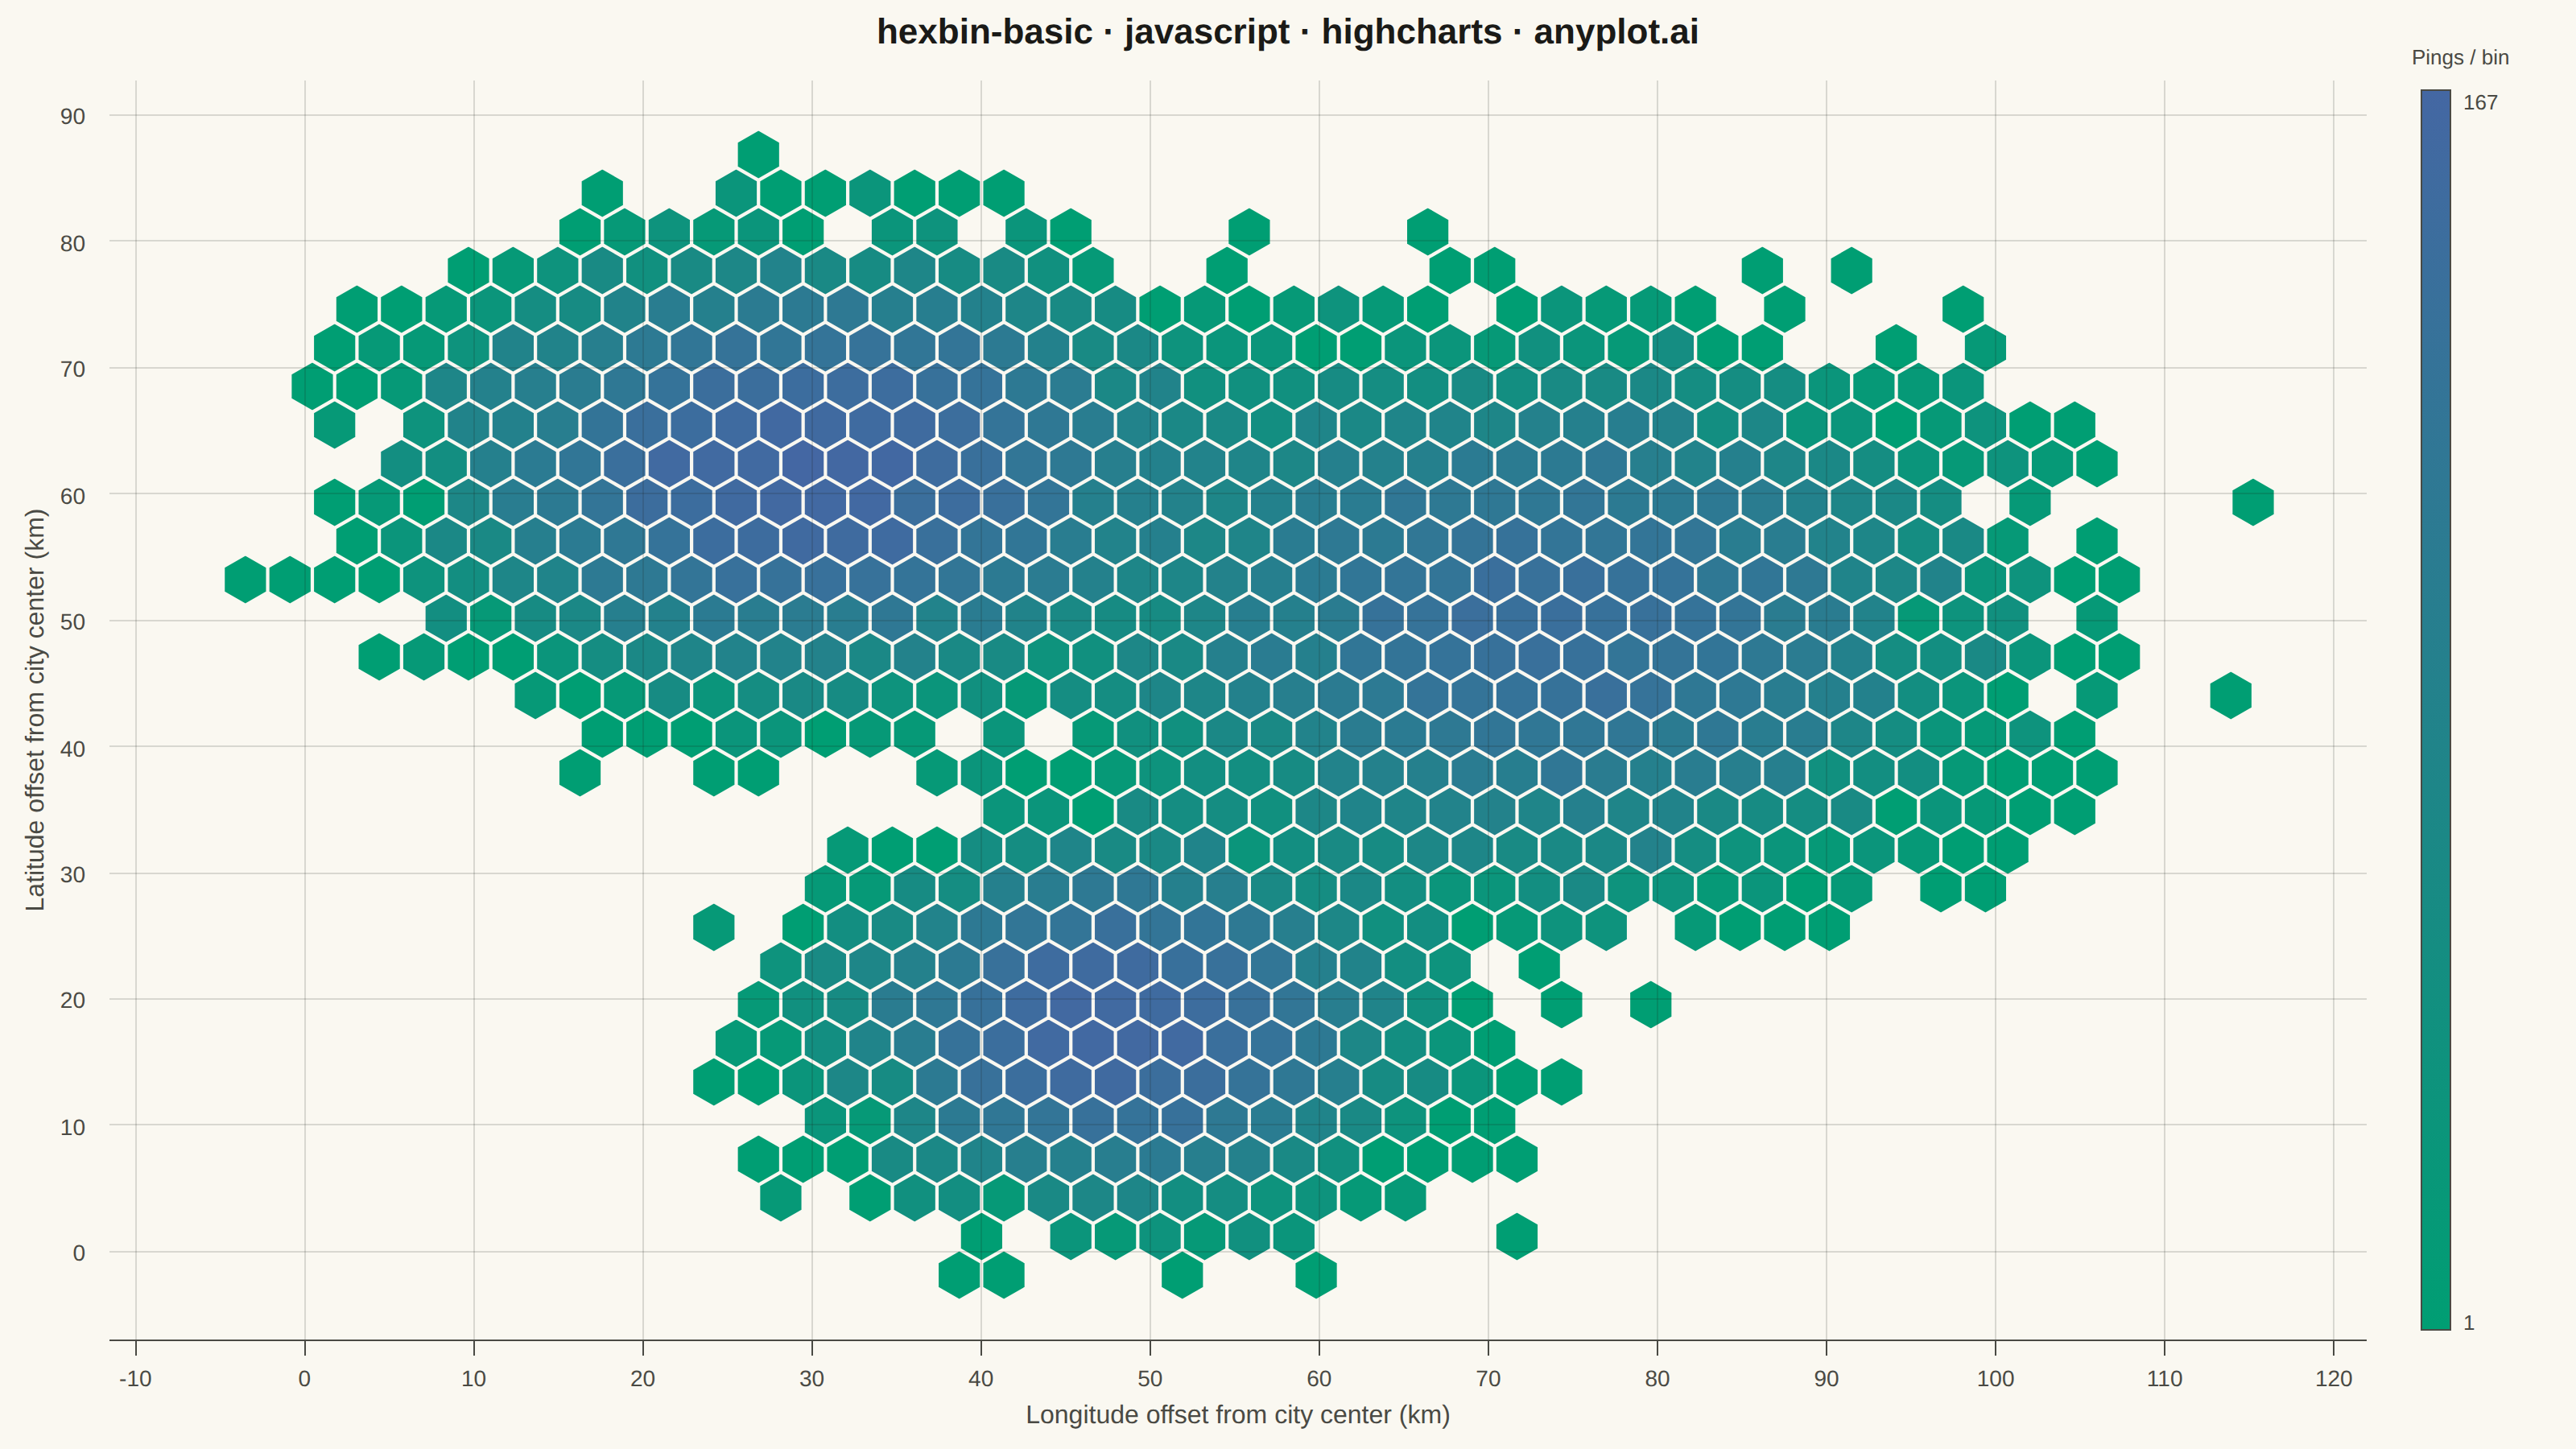
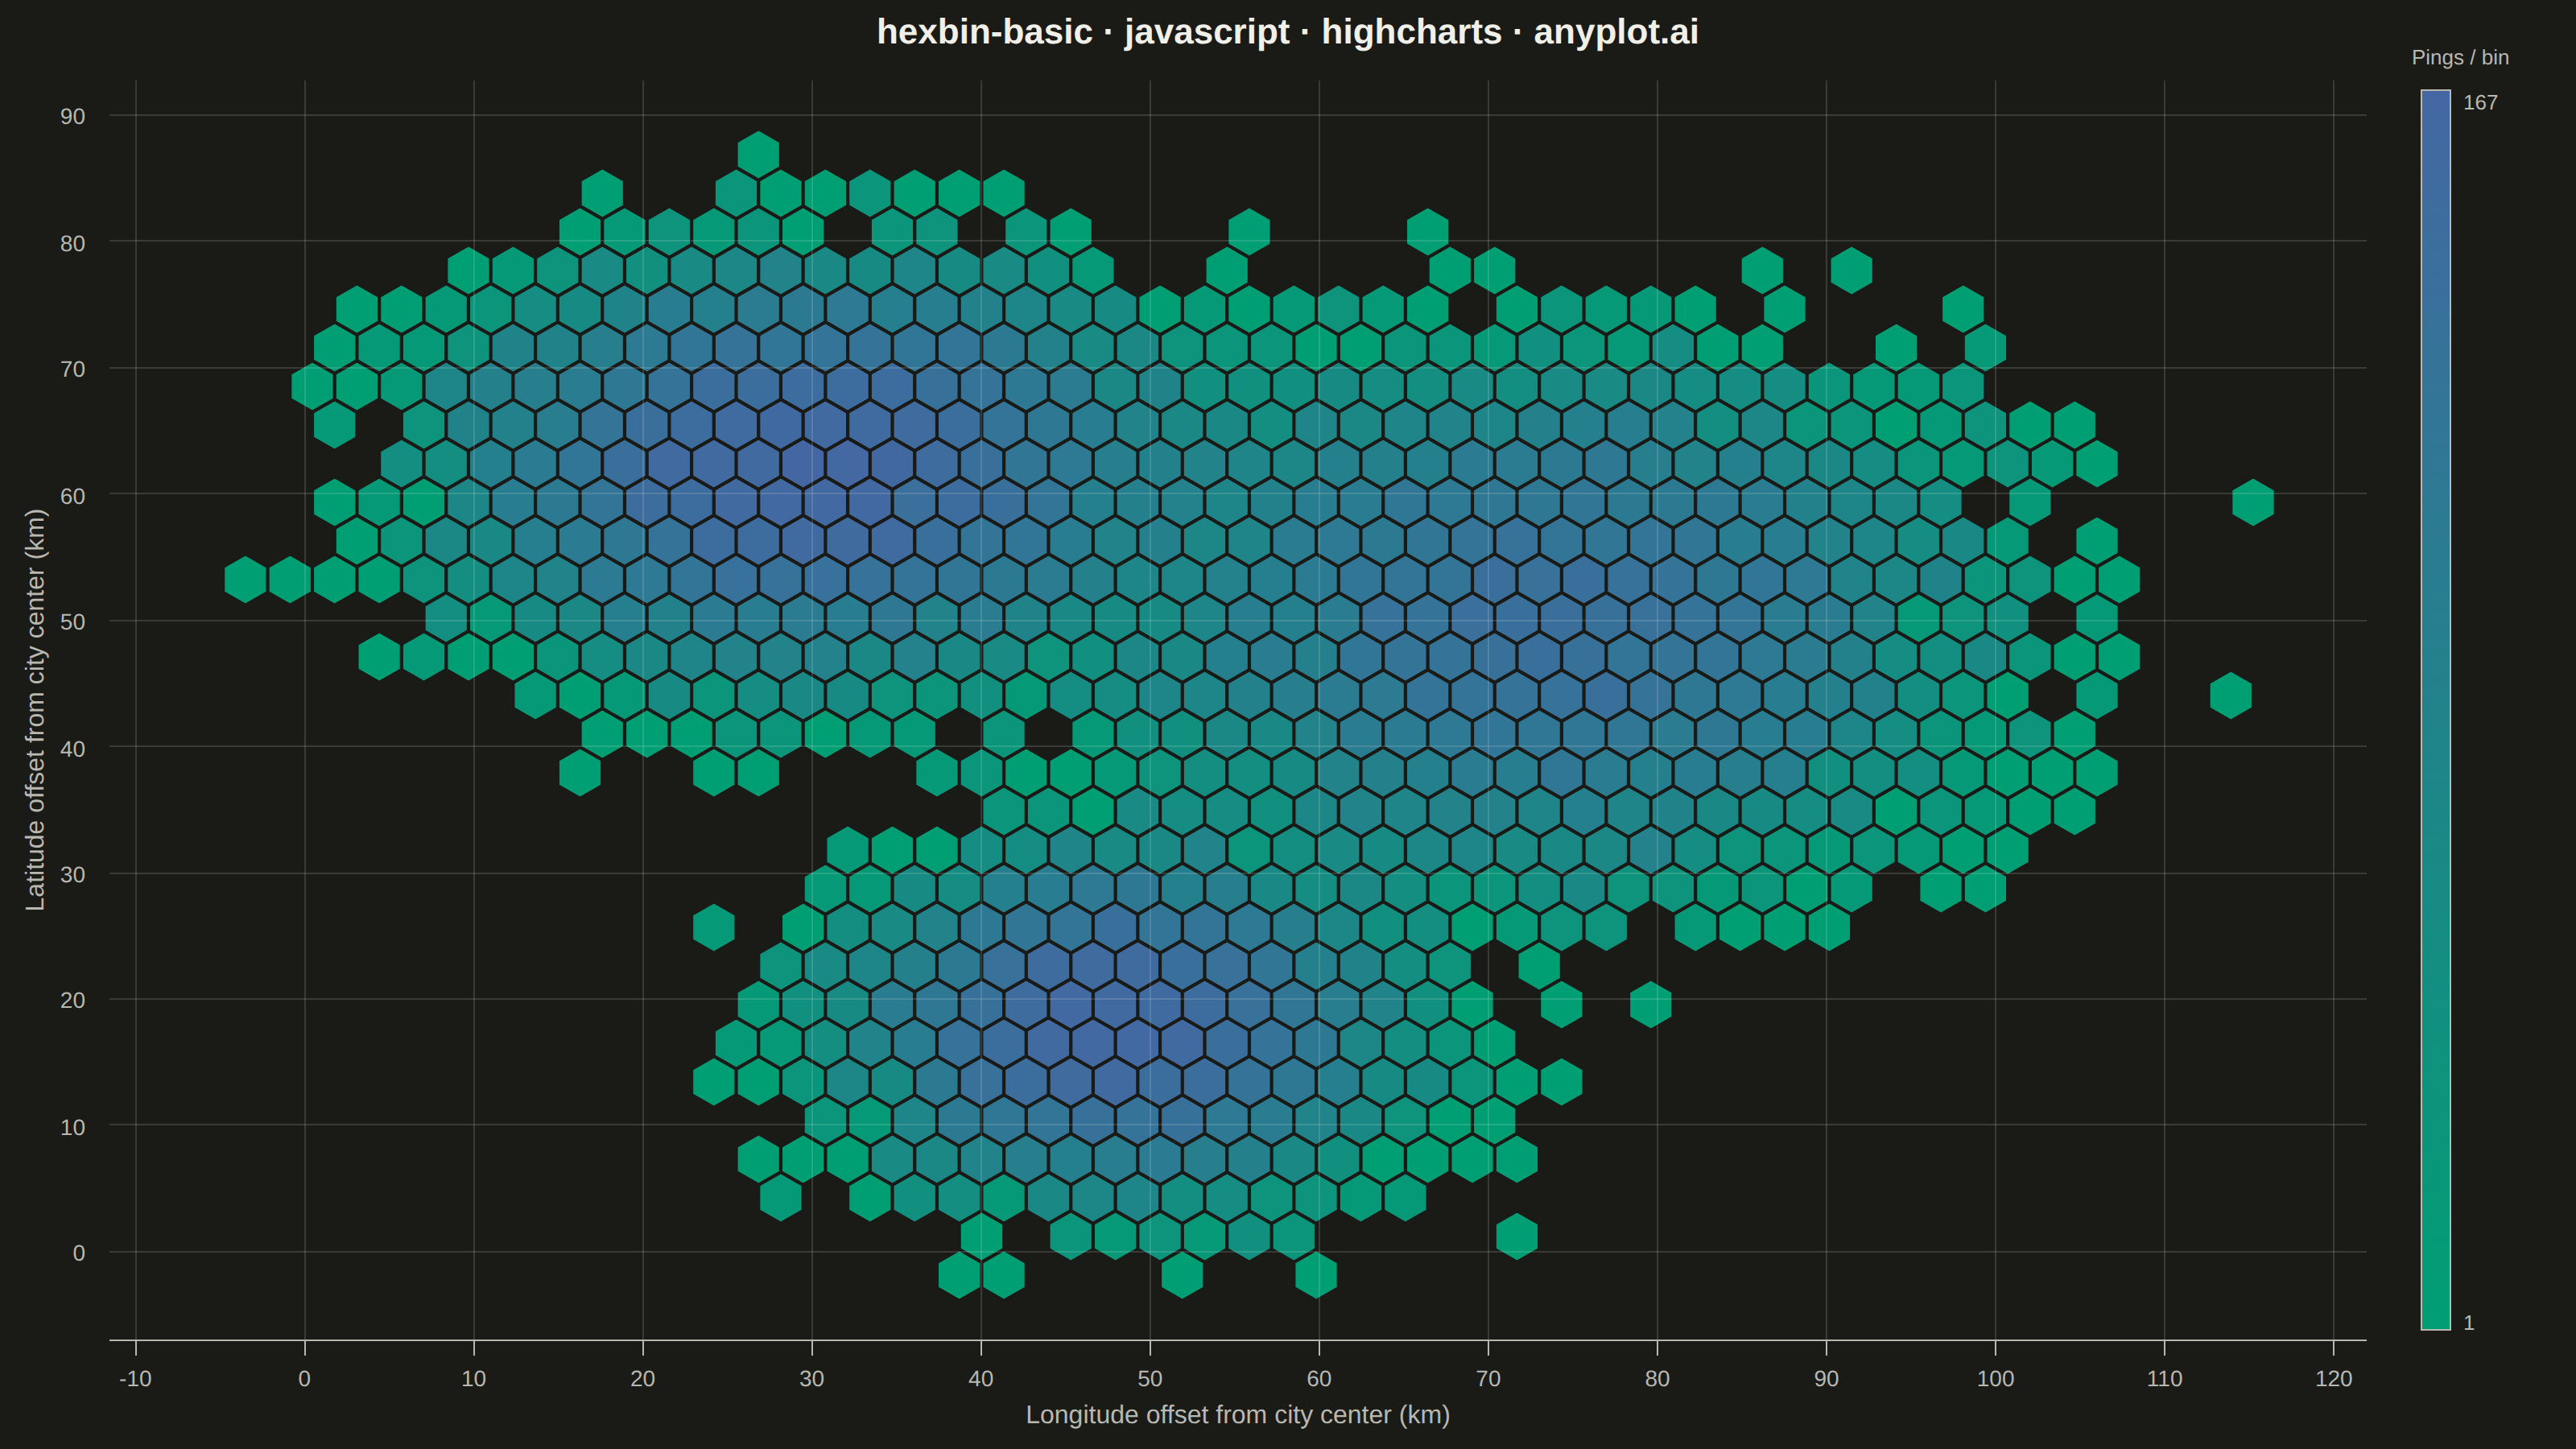
A hexagonal binning plot that visualizes the density of 2D point data by aggregating points into hexagonal bins. The color intensity of each hexagon represents the count of points within it, making it ideal for revealing density patterns in large datasets where traditional scatter plots would show overlapping points. Hexagonal bins provide better visual representation than square pixels due to their isotropy (equal distance to neighboring cells in all directions).
// anyplot.ai
// hexbin-basic: Basic Hexbin Plot
// Library: highcharts 12.6.0 | JavaScript 22.23.2
// Quality: 89/100 | Created: 2026-08-25

const t = window.ANYPLOT_TOKENS;

// --- Data: simulated GPS pings around three city hotspots (deterministic LCG) ---
function makeLcg(seed) {
  let state = seed >>> 0;
  return () => {
    state = (state * 1664525 + 1013904223) >>> 0;
    return state / 4294967296;
  };
}
const rand = makeLcg(42);

function gaussian() {
  const u1 = Math.max(rand(), 1e-9);
  const u2 = rand();
  return Math.sqrt(-2 * Math.log(u1)) * Math.cos(2 * Math.PI * u2);
}

const hotspots = [
  { cx: 30, cy: 62, sx: 9, sy: 7, n: 8000 }, // downtown core
  { cx: 74, cy: 50, sx: 11, sy: 9, n: 6200 }, // stadium district
  { cx: 48, cy: 18, sx: 7, sy: 6, n: 5000 }, // airport corridor
];

const pings = [];
hotspots.forEach(({ cx, cy, sx, sy, n }) => {
  for (let i = 0; i < n; i++) {
    pings.push([cx + gaussian() * sx, cy + gaussian() * sy]);
  }
});

const xs = pings.map((p) => p[0]);
const ys = pings.map((p) => p[1]);
const padX = (Math.max(...xs) - Math.min(...xs)) * 0.06;
const padY = (Math.max(...ys) - Math.min(...ys)) * 0.06;
const xMin = Math.min(...xs) - padX;
const xMax = Math.max(...xs) + padX;
const yMin = Math.min(...ys) - padY;
const yMax = Math.max(...ys) + padY;

// --- Hexagonal binning geometry (pointy-top, pixel space — the standard
// hexbin technique of binning post-projection so cells tile evenly on
// screen regardless of the underlying data scale) -----------------------
const HEX_SIZE = 16; // center-to-vertex radius, CSS px in the 1600x900 mount
const SQRT3 = Math.sqrt(3);

function axialRound(qf, rf) {
  const x = qf;
  const z = rf;
  const y = -x - z;
  let rx = Math.round(x);
  let ry = Math.round(y);
  let rz = Math.round(z);
  const dx = Math.abs(rx - x);
  const dy = Math.abs(ry - y);
  const dz = Math.abs(rz - z);
  if (dx > dy && dx > dz) rx = -ry - rz;
  else if (dy > dz) ry = -rx - rz;
  else rz = -rx - ry;
  return [rx, rz];
}

function pixelToAxial(px, py, size) {
  const qf = ((SQRT3 / 3) * px - (1 / 3) * py) / size;
  const rf = ((2 / 3) * py) / size;
  return axialRound(qf, rf);
}

function axialToPixel(q, r, size) {
  return [size * (SQRT3 * q + (SQRT3 / 2) * r), size * (1.5 * r)];
}

function hexPath(cx, cy, size) {
  const corners = [];
  for (let i = 0; i < 6; i++) {
    const angle = (Math.PI / 180) * (60 * i - 30);
    corners.push(`${cx + size * Math.cos(angle)},${cy + size * Math.sin(angle)}`);
  }
  return `M ${corners.join(" L ")} Z`;
}

// --- Chart -------------------------------------------------------------
Highcharts.chart("container", {
  chart: {
    type: "scatter",
    backgroundColor: "transparent",
    animation: false,
    style: { fontFamily: "inherit" },
    marginRight: 130,
    events: {
      load: function () {
        const chart = this;
        const xAxis = chart.xAxis[0];
        const yAxis = chart.yAxis[0];

        // Bin every ping into a pixel-space hex cell.
        const bins = new Map();
        pings.forEach(([x, y]) => {
          const px = xAxis.toPixels(x, false);
          const py = yAxis.toPixels(y, false);
          const [q, r] = pixelToAxial(px, py, HEX_SIZE);
          const key = `${q},${r}`;
          bins.set(key, (bins.get(key) || 0) + 1);
        });

        const counts = Array.from(bins.values());
        const cMin = Math.min(...counts);
        const cMax = Math.max(...counts);
        const logMin = Math.log1p(cMin);
        const logSpan = Math.log1p(cMax) - logMin || 1;

        const seqLo = Highcharts.color(t.seq[0]);
        const seqHi = Highcharts.color(t.seq[1]);

        const hexGroup = chart.renderer.g("hexbin-cells").add();
        bins.forEach((count, key) => {
          const [q, r] = key.split(",").map(Number);
          const [cx, cy] = axialToPixel(q, r, HEX_SIZE);
          const norm = (Math.log1p(count) - logMin) / logSpan;
          chart.renderer
            .path()
            .attr({
              d: hexPath(cx, cy, HEX_SIZE * 0.96),
              fill: seqLo.tweenTo(seqHi, norm),
              stroke: t.pageBg,
              "stroke-width": 1,
            })
            .add(hexGroup);
        });

        // Manual continuous color bar — colorAxis lives in a module that
        // isn't loaded in the core bundle, so the density scale is drawn
        // directly with the SVG renderer, using Highcharts' native gradient
        // fill (SVGRenderer.complexColor, core — no module needed).
        const barWidth = 18;
        const barX = chart.chartWidth - barWidth - 78;
        const barTop = chart.plotTop + 6;
        const barHeight = chart.plotHeight - 12;

        chart.renderer
          .rect(barX, barTop, barWidth, barHeight)
          .attr({
            fill: {
              linearGradient: { x1: 0, y1: 1, x2: 0, y2: 0 },
              stops: [
                [0, t.seq[0]],
                [1, t.seq[1]],
              ],
            },
            stroke: t.inkSoft,
            "stroke-width": 1,
          })
          .add();

        chart.renderer
          .text("Pings / bin", barX - 6, chart.plotTop - 10)
          .css({ color: t.inkSoft, fontSize: "13px" })
          .add();
        chart.renderer
          .text(String(cMax), barX + barWidth + 8, barTop + 12)
          .css({ color: t.inkSoft, fontSize: "13px" })
          .add();
        chart.renderer
          .text(String(cMin), barX + barWidth + 8, barTop + barHeight)
          .css({ color: t.inkSoft, fontSize: "13px" })
          .add();
      },
    },
  },
  credits: { enabled: false },
  title: {
    text: "hexbin-basic · javascript · highcharts · anyplot.ai",
    style: { color: t.ink, fontSize: "22px", fontWeight: "600" },
  },
  legend: { enabled: false },
  plotOptions: { series: { animation: false } },
  xAxis: {
    min: xMin,
    max: xMax,
    startOnTick: false,
    endOnTick: false,
    lineColor: t.inkSoft,
    tickColor: t.inkSoft,
    gridLineColor: t.grid,
    gridLineWidth: 1,
    labels: { style: { color: t.inkSoft, fontSize: "14px" } },
    title: {
      text: "Longitude offset from city center (km)",
      style: { color: t.inkSoft, fontSize: "16px" },
    },
  },
  yAxis: {
    min: yMin,
    max: yMax,
    startOnTick: false,
    endOnTick: false,
    lineColor: t.inkSoft,
    tickColor: t.inkSoft,
    gridLineColor: t.grid,
    gridLineWidth: 1,
    labels: { style: { color: t.inkSoft, fontSize: "14px" } },
    title: {
      text: "Latitude offset from city center (km)",
      style: { color: t.inkSoft, fontSize: "16px" },
    },
  },
  // An invisible boundary series — Highcharts only lays out cartesian axes
  // when at least one series uses them; the hexagons themselves are drawn
  // by hand in the `load` handler above.
  series: [
    {
      data: [
        [xMin, yMin],
        [xMax, yMax],
      ],
      marker: { enabled: false },
      lineWidth: 0,
      enableMouseTracking: false,
      showInLegend: false,
    },
  ],
});
Runnable source as JSON, for any HTTP client: https://api.anyplot.ai/specs/hexbin-basic/highcharts/code. Any spec id and library id listed in llms-full.txt fit the same URL shape; every URL below is complete and callable.
{
  "spec_id": "hexbin-basic",
  "language": "javascript",
  "library": "highcharts",
  "page": "https://anyplot.ai/hexbin-basic/javascript/highcharts",
  "hub": "https://anyplot.ai/hexbin-basic",
  "code_json": "https://api.anyplot.ai/specs/hexbin-basic/highcharts/code",
  "spec_json": "https://api.anyplot.ai/specs/hexbin-basic",
  "render_light_png": "https://storage.googleapis.com/anyplot-images/plots/hexbin-basic/javascript/highcharts/plot-light.png",
  "render_dark_png": "https://storage.googleapis.com/anyplot-images/plots/hexbin-basic/javascript/highcharts/plot-dark.png",
  "interactive_light_html": "https://storage.googleapis.com/anyplot-images/plots/hexbin-basic/javascript/highcharts/plot-light.html",
  "interactive_dark_html": "https://storage.googleapis.com/anyplot-images/plots/hexbin-basic/javascript/highcharts/plot-dark.html",
  "quality_score": 89.0,
  "license": "MIT",
  "guide": "https://anyplot.ai/llms.txt"
}
Part of Basic Hexbin Plot on anyplot.ai.