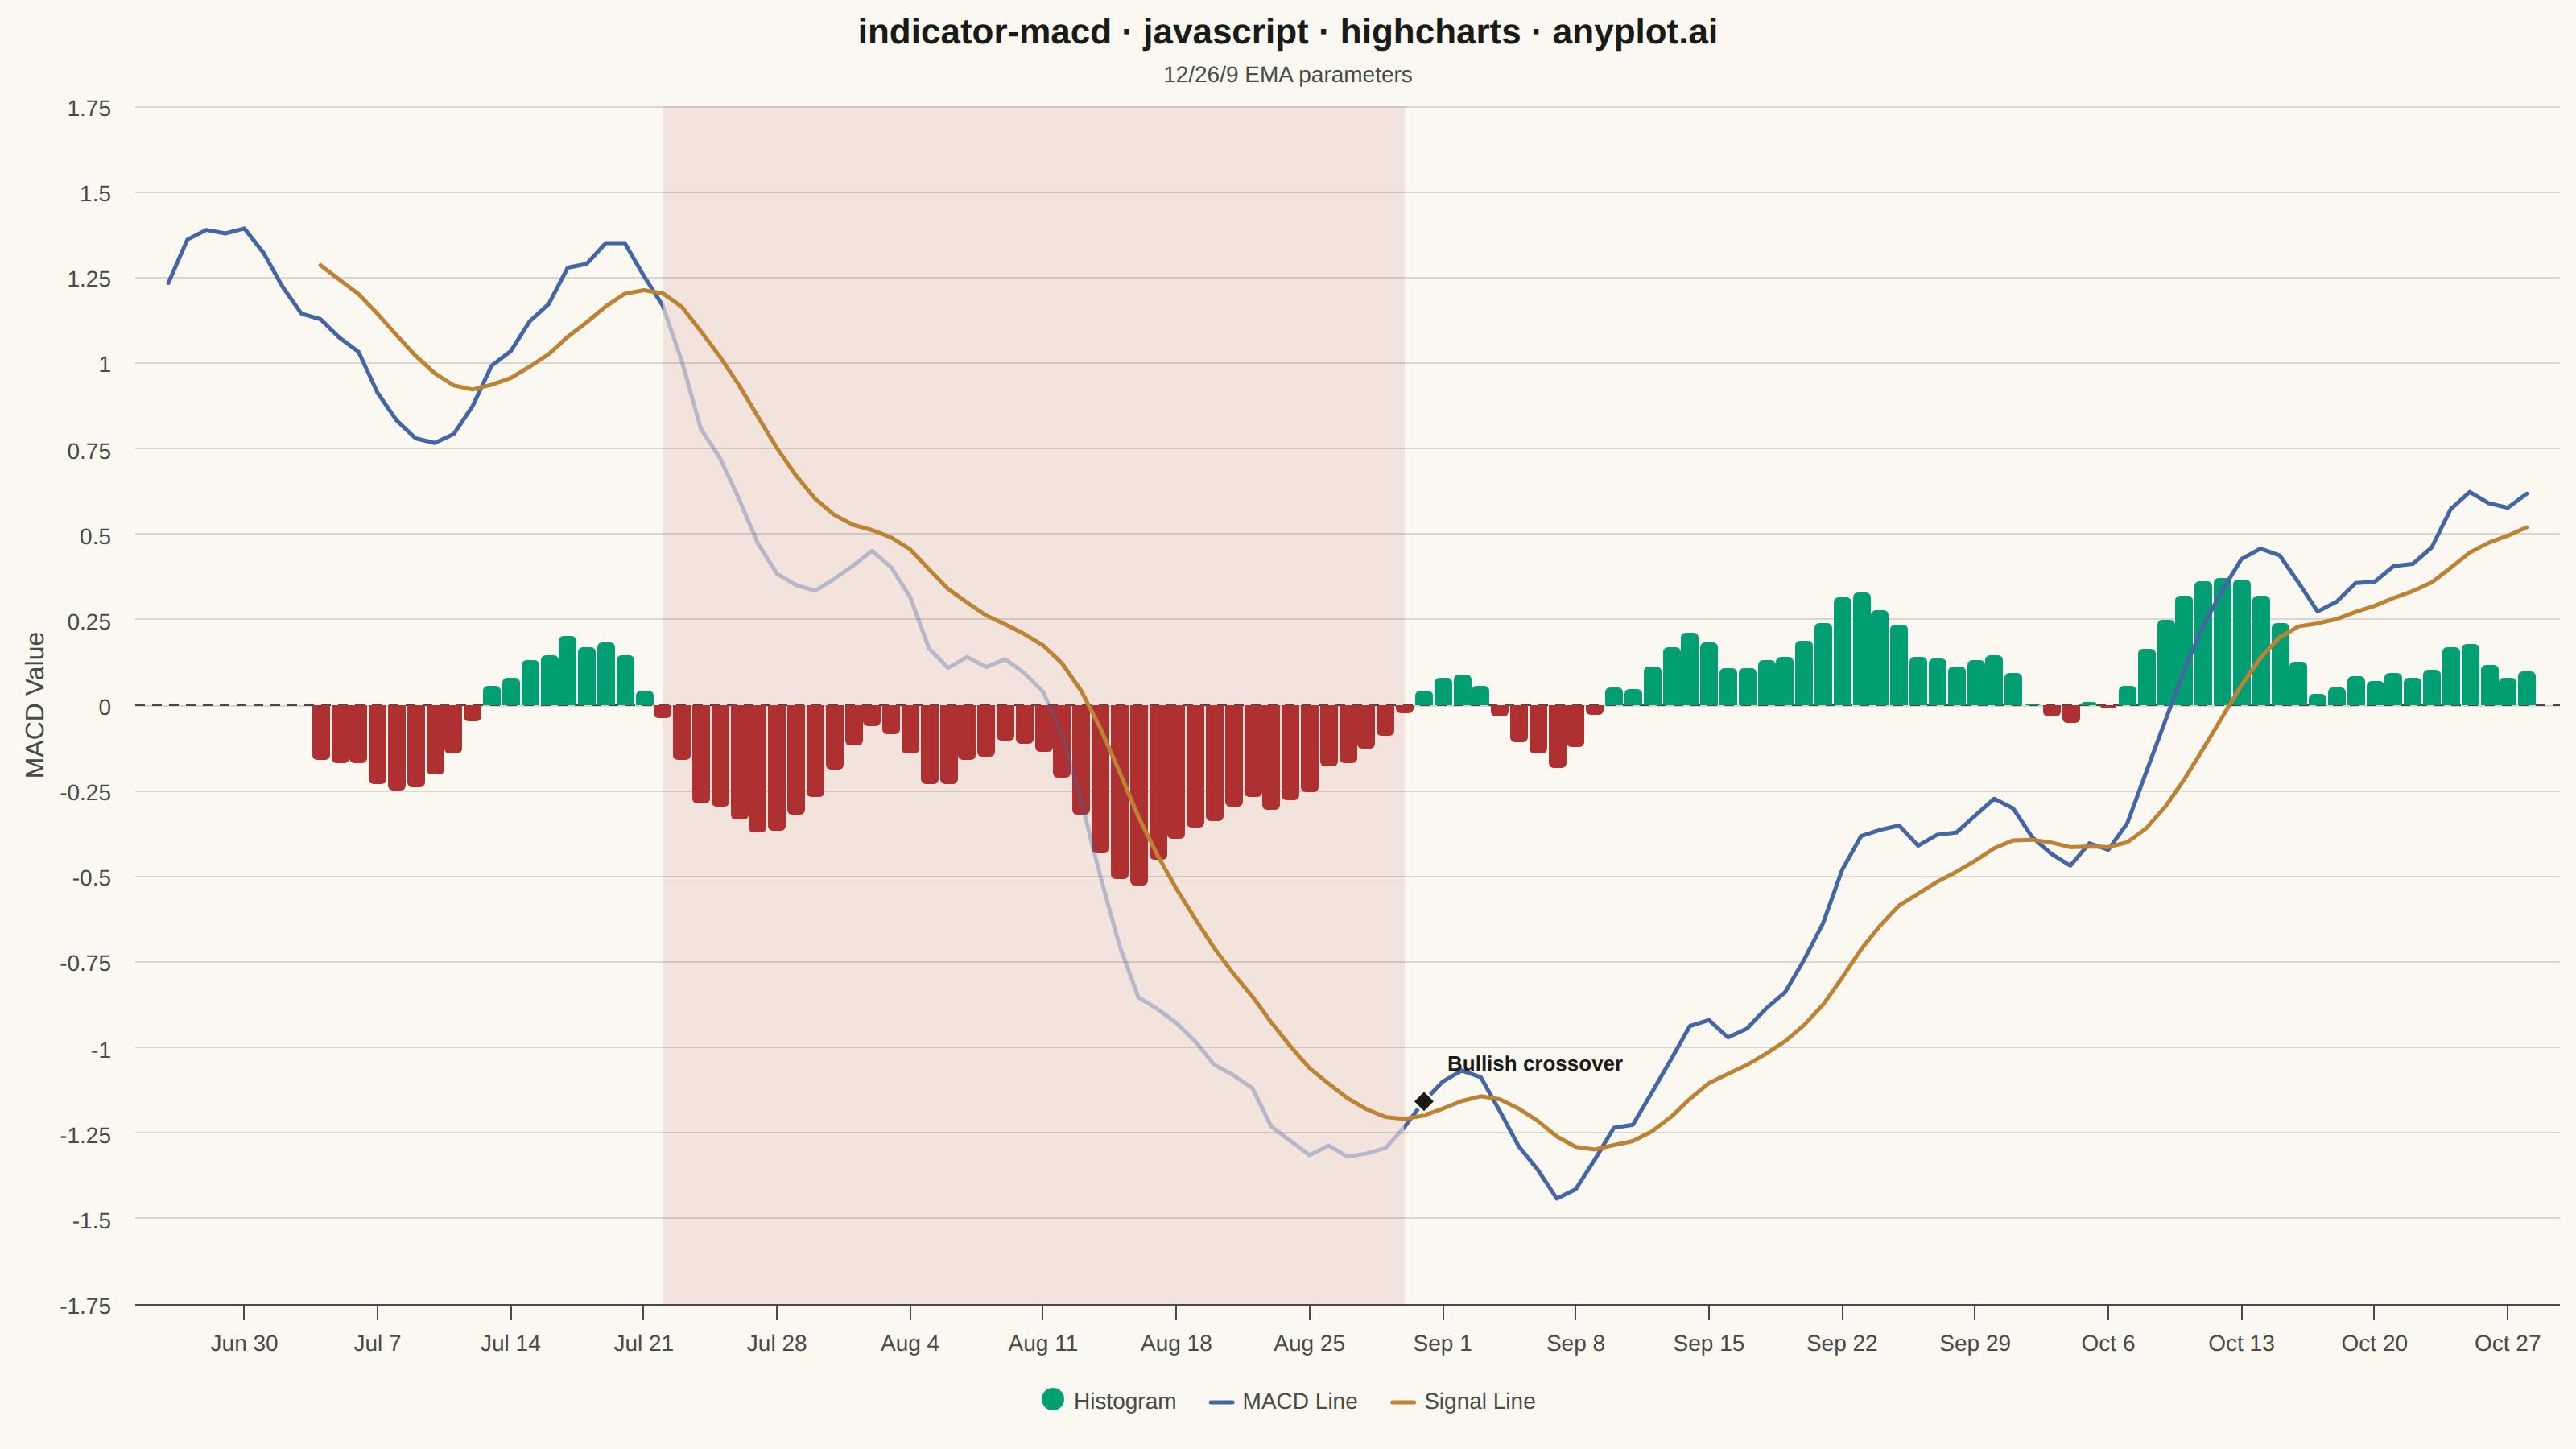
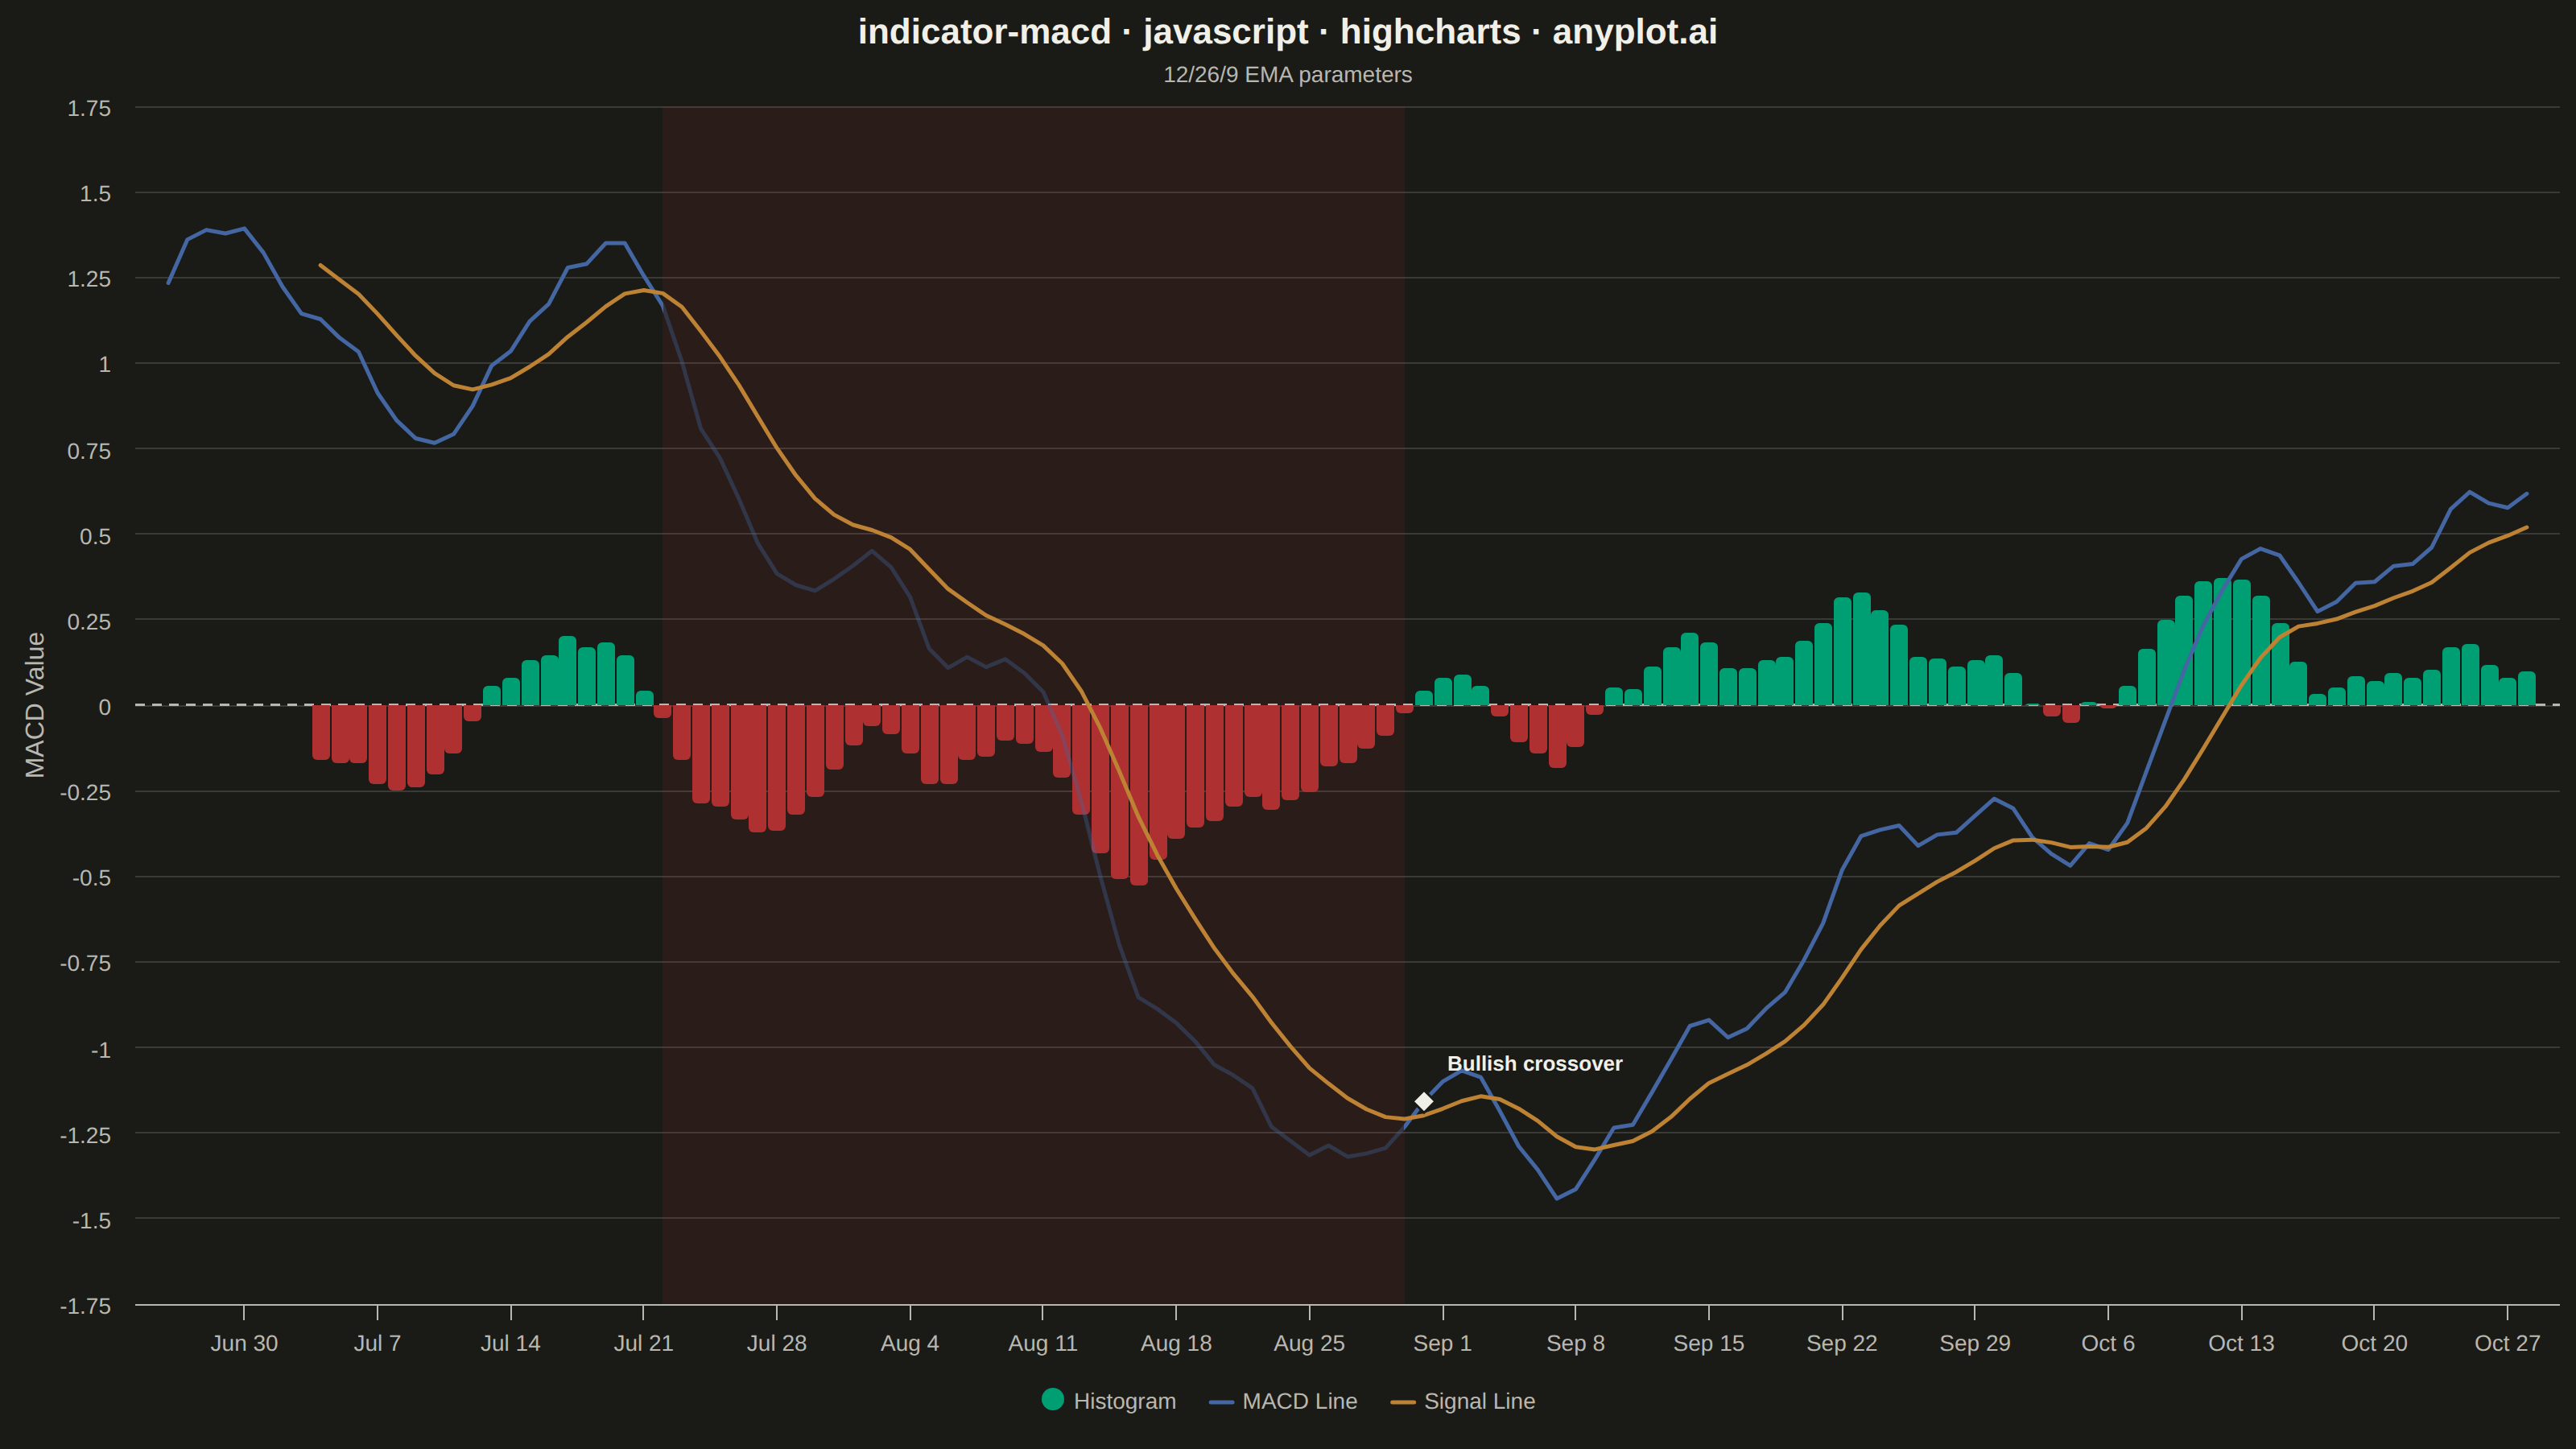
A MACD (Moving Average Convergence Divergence) chart displaying three components: the MACD line, signal line, and histogram. The MACD line represents the difference between 12-day and 26-day exponential moving averages, while the signal line is a 9-day EMA of the MACD. The histogram visualizes the difference between these two lines. This is an essential momentum oscillator for technical analysis, helping traders identify trend direction, momentum strength, and potential buy/sell signals through line crossovers.
Preview render from the Highcharts implementation.