The same plot in 14 other libraries — JavaScript: D3.js, Apache ECharts, Highcharts, MUI X Charts; Python: Altair, Bokeh, lets-plot, Matplotlib, Plotly, plotnine, Pygal, Seaborn; R: ggplot2; Julia: Makie.jl. Compare all 15 side by side: MACD Technical Indicator Chart in Python, R, Julia and JavaScript.
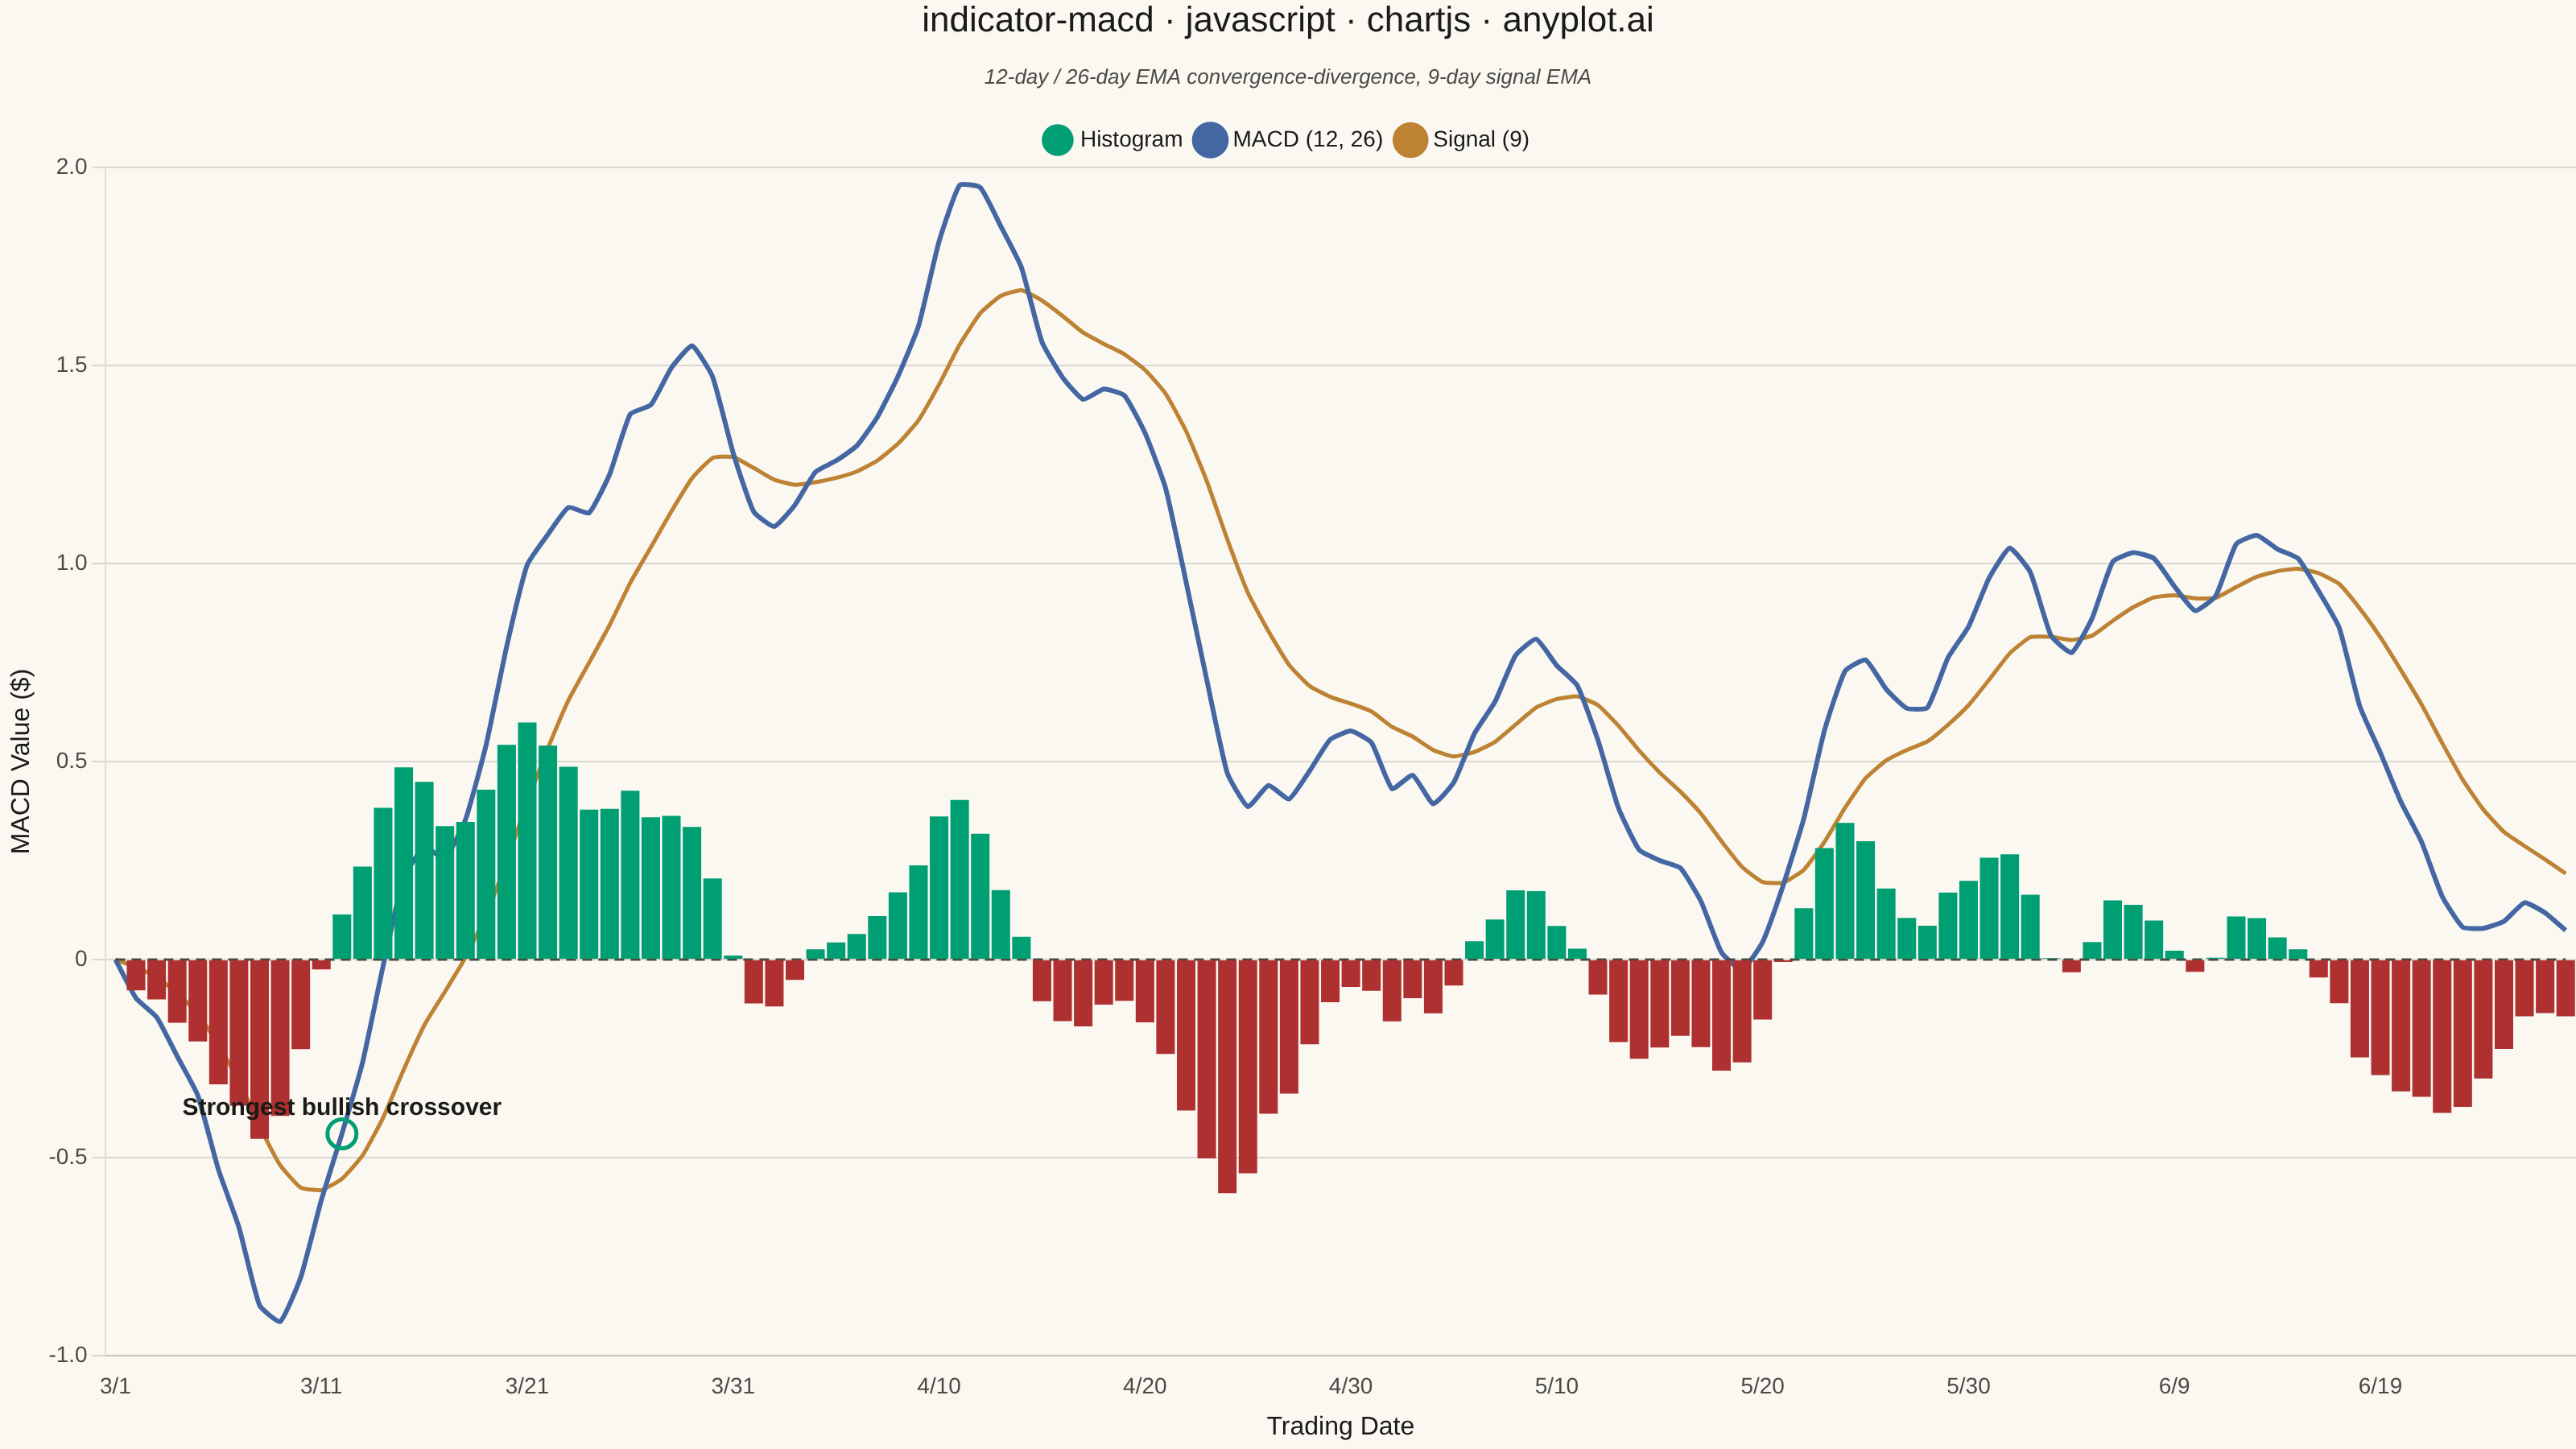
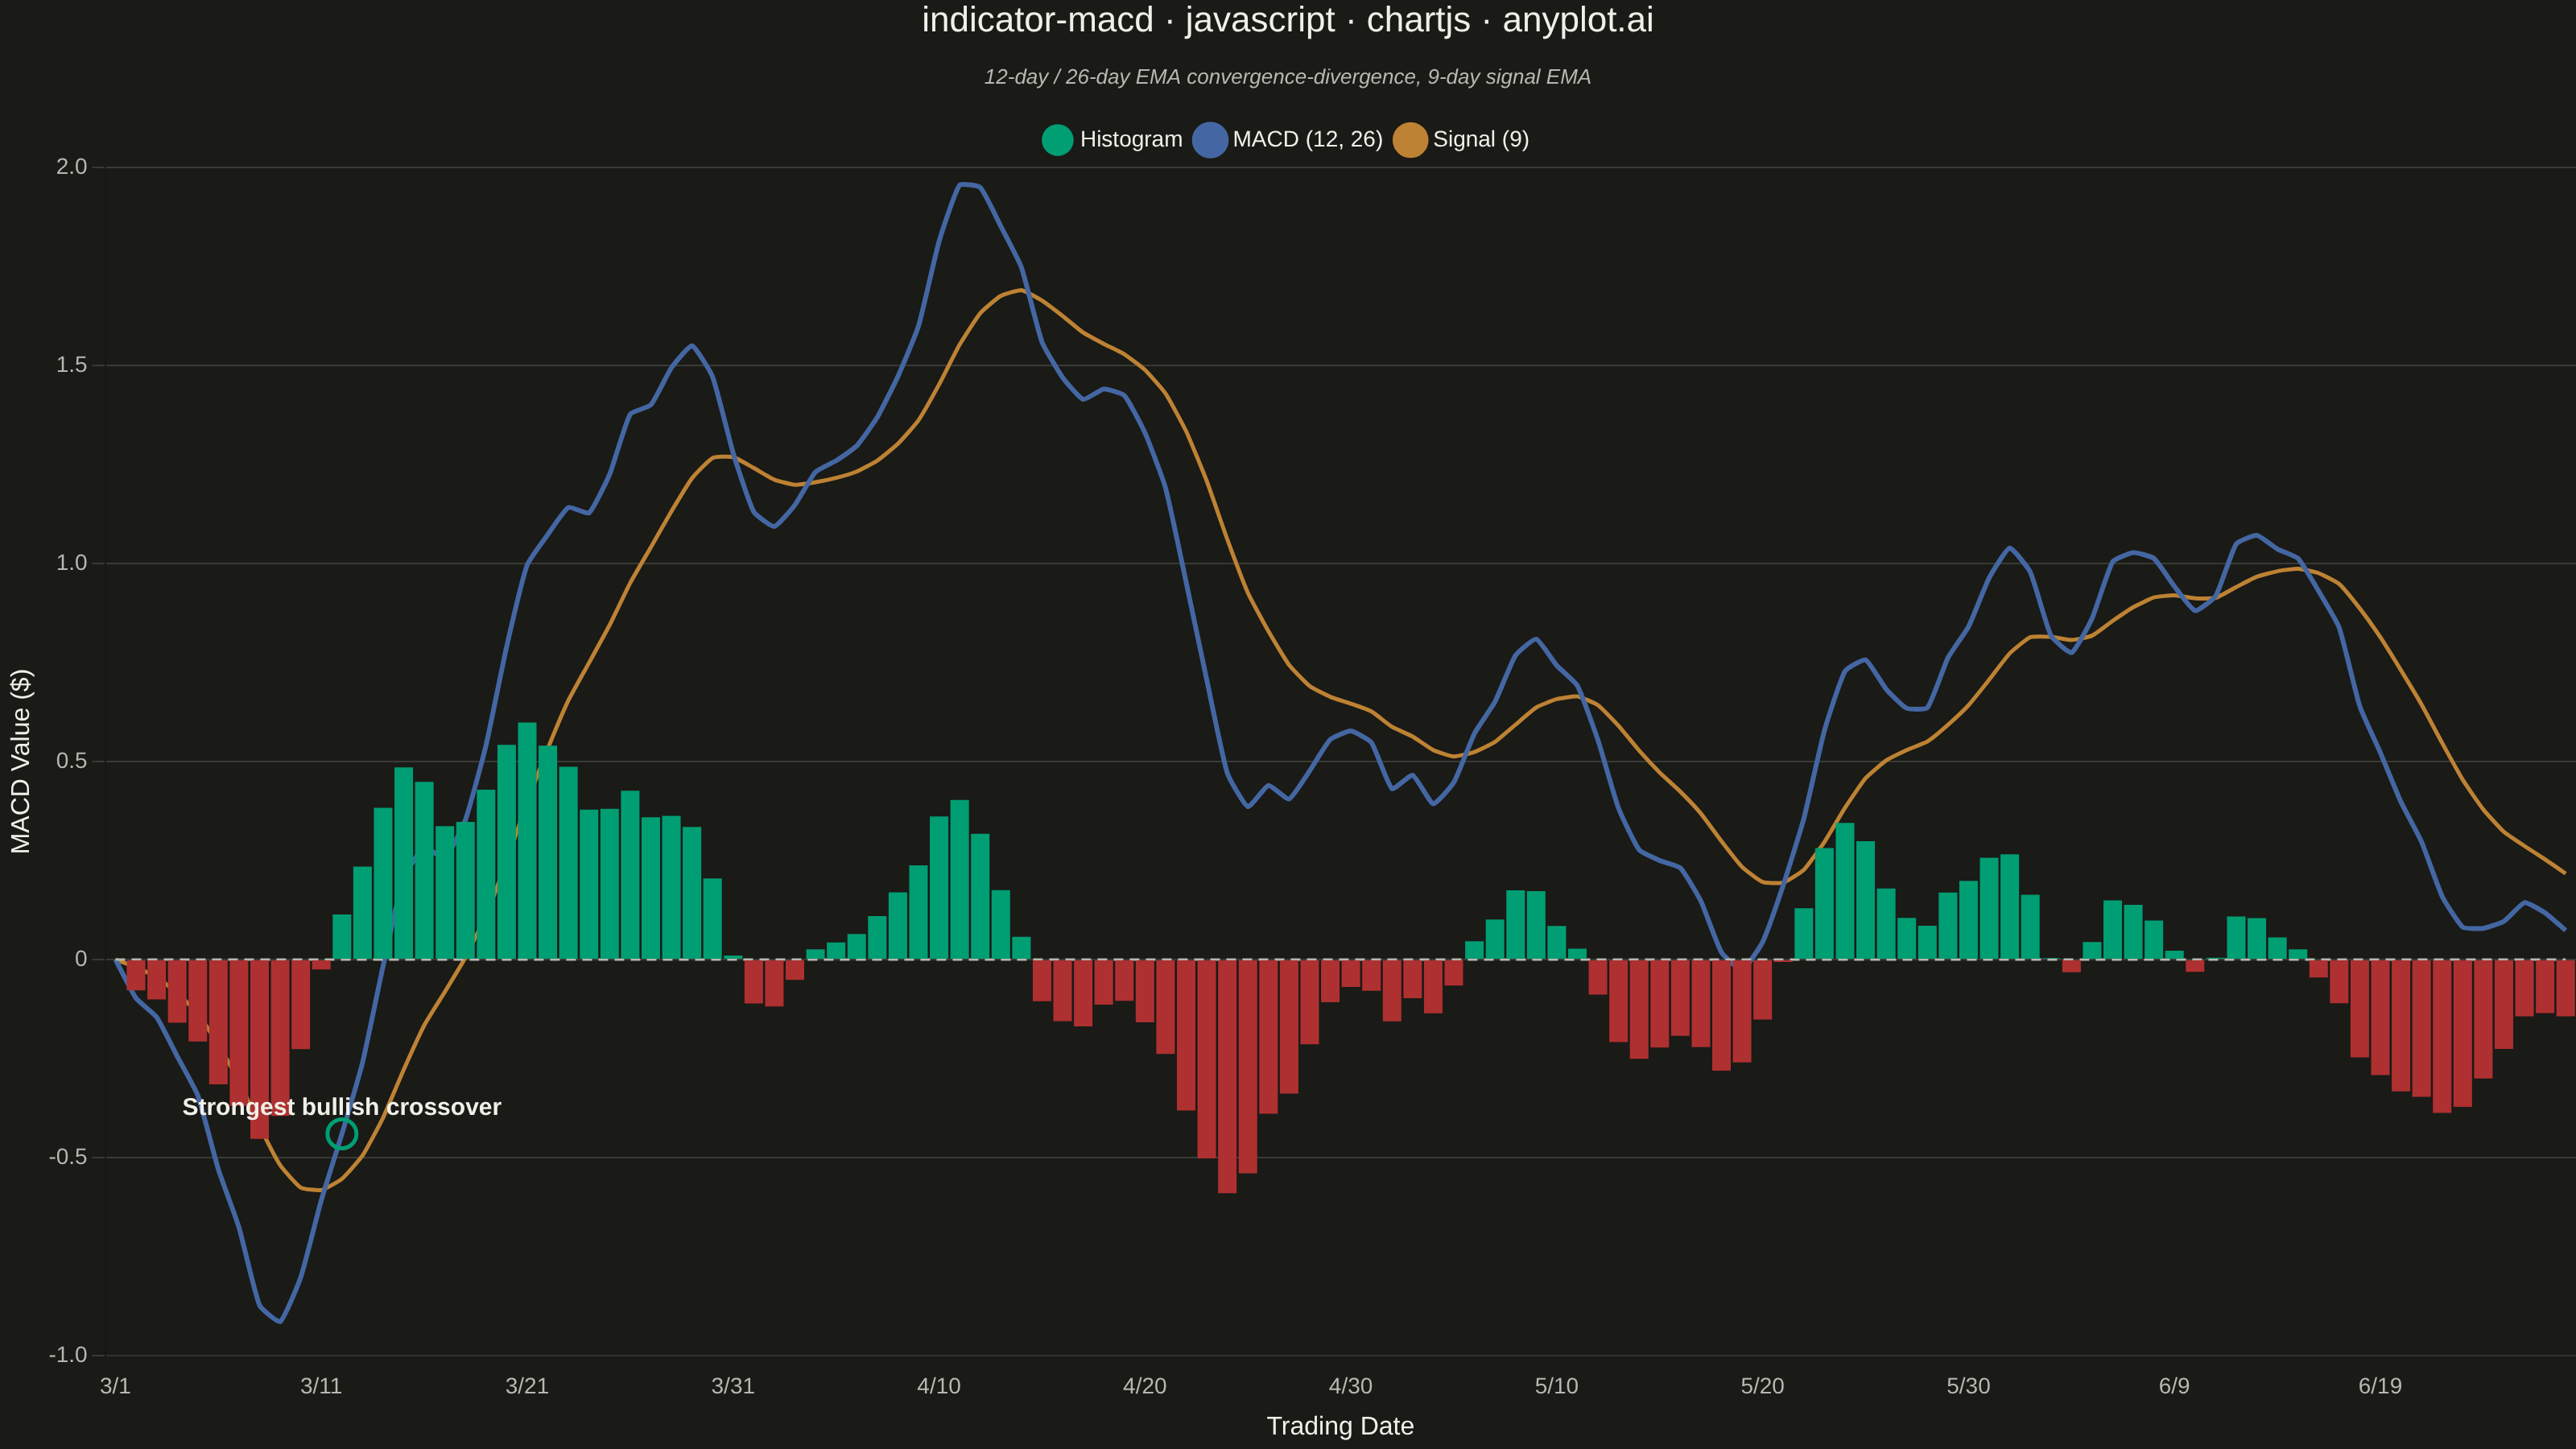
A MACD (Moving Average Convergence Divergence) chart displaying three components: the MACD line, signal line, and histogram. The MACD line represents the difference between 12-day and 26-day exponential moving averages, while the signal line is a 9-day EMA of the MACD. The histogram visualizes the difference between these two lines. This is an essential momentum oscillator for technical analysis, helping traders identify trend direction, momentum strength, and potential buy/sell signals through line crossovers.
// anyplot.ai
// indicator-macd: MACD Technical Indicator Chart
// Library: chartjs 4.4.7 | JavaScript 22.23.2
// Quality: 92/100 | Created: 2026-09-05
//# anyplot-orientation: landscape

const t = window.ANYPLOT_TOKENS;

// --- Data (in-memory, deterministic) ---------------------------------------
// Small LCG for reproducible pseudo-randomness (Math.random() is not seeded)
let seed = 42;
function nextRandom() {
  seed = (seed * 1664525 + 1013904223) % 4294967296;
  return seed / 4294967296;
}

function ema(values, period) {
  const k = 2 / (period + 1);
  const result = [];
  let prev = values[0];
  values.forEach((value, i) => {
    prev = i === 0 ? value : value * k + prev * (1 - k);
    result.push(prev);
  });
  return result;
}

const periods = 120;
const startDate = new Date("2024-03-01T00:00:00Z");
const dates = [];
const closes = [];
let price = 182;
for (let i = 0; i < periods; i++) {
  const d = new Date(startDate);
  d.setUTCDate(d.getUTCDate() + i);
  dates.push(`${d.getUTCMonth() + 1}/${d.getUTCDate()}`);
  price += (nextRandom() - 0.47) * 3.2;
  closes.push(price);
}

const emaFast = ema(closes, 12);
const emaSlow = ema(closes, 26);
const macdLine = emaFast.map((v, i) => v - emaSlow[i]);
const signalLine = ema(macdLine, 9);
const histogram = macdLine.map((v, i) => v - signalLine[i]);
const zeroLine = dates.map(() => 0);

// Find the strongest crossover (largest ensuing histogram swing) to give the
// chart a focal point instead of pure data display.
function strongestCrossover(hist) {
  let best = null;
  for (let i = 1; i < hist.length; i++) {
    const bullish = hist[i - 1] <= 0 && hist[i] > 0;
    const bearish = hist[i - 1] >= 0 && hist[i] < 0;
    if (!bullish && !bearish) continue;
    let strength = 0;
    for (let j = i; j < Math.min(hist.length, i + 15); j++) {
      if ((bullish && hist[j] < 0) || (bearish && hist[j] > 0)) break;
      strength = Math.max(strength, Math.abs(hist[j]));
    }
    if (!best || strength > best.strength) best = { index: i, bullish, strength };
  }
  return best;
}
const crossover = strongestCrossover(histogram);

// --- Mount -------------------------------------------------------------------
const canvas = document.createElement("canvas");
document.getElementById("container").appendChild(canvas);

// --- Chart -------------------------------------------------------------------
const bullColor = t.palette[0]; // #009E73 brand green — positive histogram / gain
const bearColor = t.palette[4]; // #AE3030 matte red — negative histogram / loss (semantic anchor)
const macdColor = t.palette[2]; // #4467A3 blue — MACD line
const signalColor = t.palette[3]; // #BD8233 ochre — signal line

// Native Chart.js plugin (no external dependency) marking the strongest
// bullish/bearish crossover — a distinctive, library-idiomatic way to give
// the chart a storytelling focal point beyond generic combo-chart usage.
const crossoverPlugin = {
  id: "crossoverAnnotation",
  afterDatasetsDraw(chart) {
    const meta = chart.getDatasetMeta(2); // MACD line dataset
    const point = meta.data[crossover.index];
    if (!point) return;
    const { ctx, chartArea } = chart;
    const markerColor = crossover.bullish ? bullColor : bearColor;
    ctx.save();
    ctx.beginPath();
    ctx.arc(point.x, point.y, 9, 0, Math.PI * 2);
    ctx.lineWidth = 2.5;
    ctx.strokeStyle = markerColor;
    ctx.stroke();

    const label = crossover.bullish ? "Strongest bullish crossover" : "Strongest bearish crossover";
    const labelBelow = point.y - 24 < chartArea.top;
    const labelY = labelBelow ? point.y + 26 : point.y - 16;
    let align = "center";
    if (point.x < chartArea.left + 90) align = "left";
    else if (point.x > chartArea.right - 90) align = "right";
    ctx.font = "600 15px sans-serif";
    ctx.fillStyle = t.ink;
    ctx.textAlign = align;
    ctx.fillText(label, point.x, labelY);
    ctx.restore();
  },
};

new Chart(canvas, {
  type: "bar",
  data: {
    labels: dates,
    datasets: [
      {
        type: "bar",
        label: "Histogram",
        data: histogram,
        backgroundColor: histogram.map((v) => (v >= 0 ? bullColor : bearColor)),
        borderWidth: 0,
        barPercentage: 1.0,
        categoryPercentage: 0.9,
      },
      {
        type: "line",
        label: "Zero line",
        data: zeroLine,
        borderColor: t.inkSoft,
        borderWidth: 1.5,
        borderDash: [6, 4],
        pointRadius: 0,
        pointHoverRadius: 0,
      },
      {
        type: "line",
        label: "MACD (12, 26)",
        data: macdLine,
        borderColor: macdColor,
        backgroundColor: macdColor,
        borderWidth: 3,
        pointRadius: 0,
        pointHoverRadius: 0,
        tension: 0.15,
      },
      {
        type: "line",
        label: "Signal (9)",
        data: signalLine,
        borderColor: signalColor,
        backgroundColor: signalColor,
        borderWidth: 2.5,
        pointRadius: 0,
        pointHoverRadius: 0,
        tension: 0.15,
      },
    ],
  },
  plugins: [crossoverPlugin],
  options: {
    responsive: true,
    maintainAspectRatio: false,
    animation: false,
    interaction: { mode: "index", intersect: false },
    plugins: {
      title: {
        display: true,
        text: "indicator-macd · javascript · chartjs · anyplot.ai",
        color: t.ink,
        font: { size: 22, weight: "500" },
        padding: { bottom: 14 },
      },
      subtitle: {
        display: true,
        text: "12-day / 26-day EMA convergence-divergence, 9-day signal EMA",
        color: t.inkSoft,
        font: { size: 13, style: "italic" },
        padding: { bottom: 14 },
      },
      legend: {
        position: "top",
        labels: {
          color: t.ink,
          font: { size: 14 },
          boxWidth: 24,
          usePointStyle: true,
          filter: (item) => item.text !== "Zero line",
        },
      },
    },
    scales: {
      x: {
        ticks: { color: t.inkSoft, font: { size: 14 }, maxTicksLimit: 12, autoSkip: true },
        grid: { display: false },
        title: { display: true, text: "Trading Date", color: t.ink, font: { size: 16 } },
      },
      y: {
        ticks: { color: t.inkSoft, font: { size: 14 } },
        grid: { color: t.grid },
        title: { display: true, text: "MACD Value ($)", color: t.ink, font: { size: 16 } },
      },
    },
  },
});
Runnable source as JSON, for any HTTP client: https://api.anyplot.ai/specs/indicator-macd/chartjs/code. Any spec id and library id listed in llms-full.txt fit the same URL shape; every URL below is complete and callable.
{
  "spec_id": "indicator-macd",
  "language": "javascript",
  "library": "chartjs",
  "page": "https://anyplot.ai/indicator-macd/javascript/chartjs",
  "hub": "https://anyplot.ai/indicator-macd",
  "code_json": "https://api.anyplot.ai/specs/indicator-macd/chartjs/code",
  "spec_json": "https://api.anyplot.ai/specs/indicator-macd",
  "render_light_png": "https://storage.googleapis.com/anyplot-images/plots/indicator-macd/javascript/chartjs/plot-light.png",
  "render_dark_png": "https://storage.googleapis.com/anyplot-images/plots/indicator-macd/javascript/chartjs/plot-dark.png",
  "interactive_light_html": "https://storage.googleapis.com/anyplot-images/plots/indicator-macd/javascript/chartjs/plot-light.html",
  "interactive_dark_html": "https://storage.googleapis.com/anyplot-images/plots/indicator-macd/javascript/chartjs/plot-dark.html",
  "quality_score": 92.0,
  "license": "MIT",
  "guide": "https://anyplot.ai/llms.txt"
}
Part of MACD Technical Indicator Chart on anyplot.ai.