The same plot in 14 other libraries — JavaScript: Chart.js, D3.js, Apache ECharts, MUI X Charts; Python: Altair, Bokeh, lets-plot, Matplotlib, Plotly, plotnine, Pygal, Seaborn; R: ggplot2; Julia: Makie.jl. Compare all 15 side by side: MACD Technical Indicator Chart in Python, R, Julia and JavaScript.
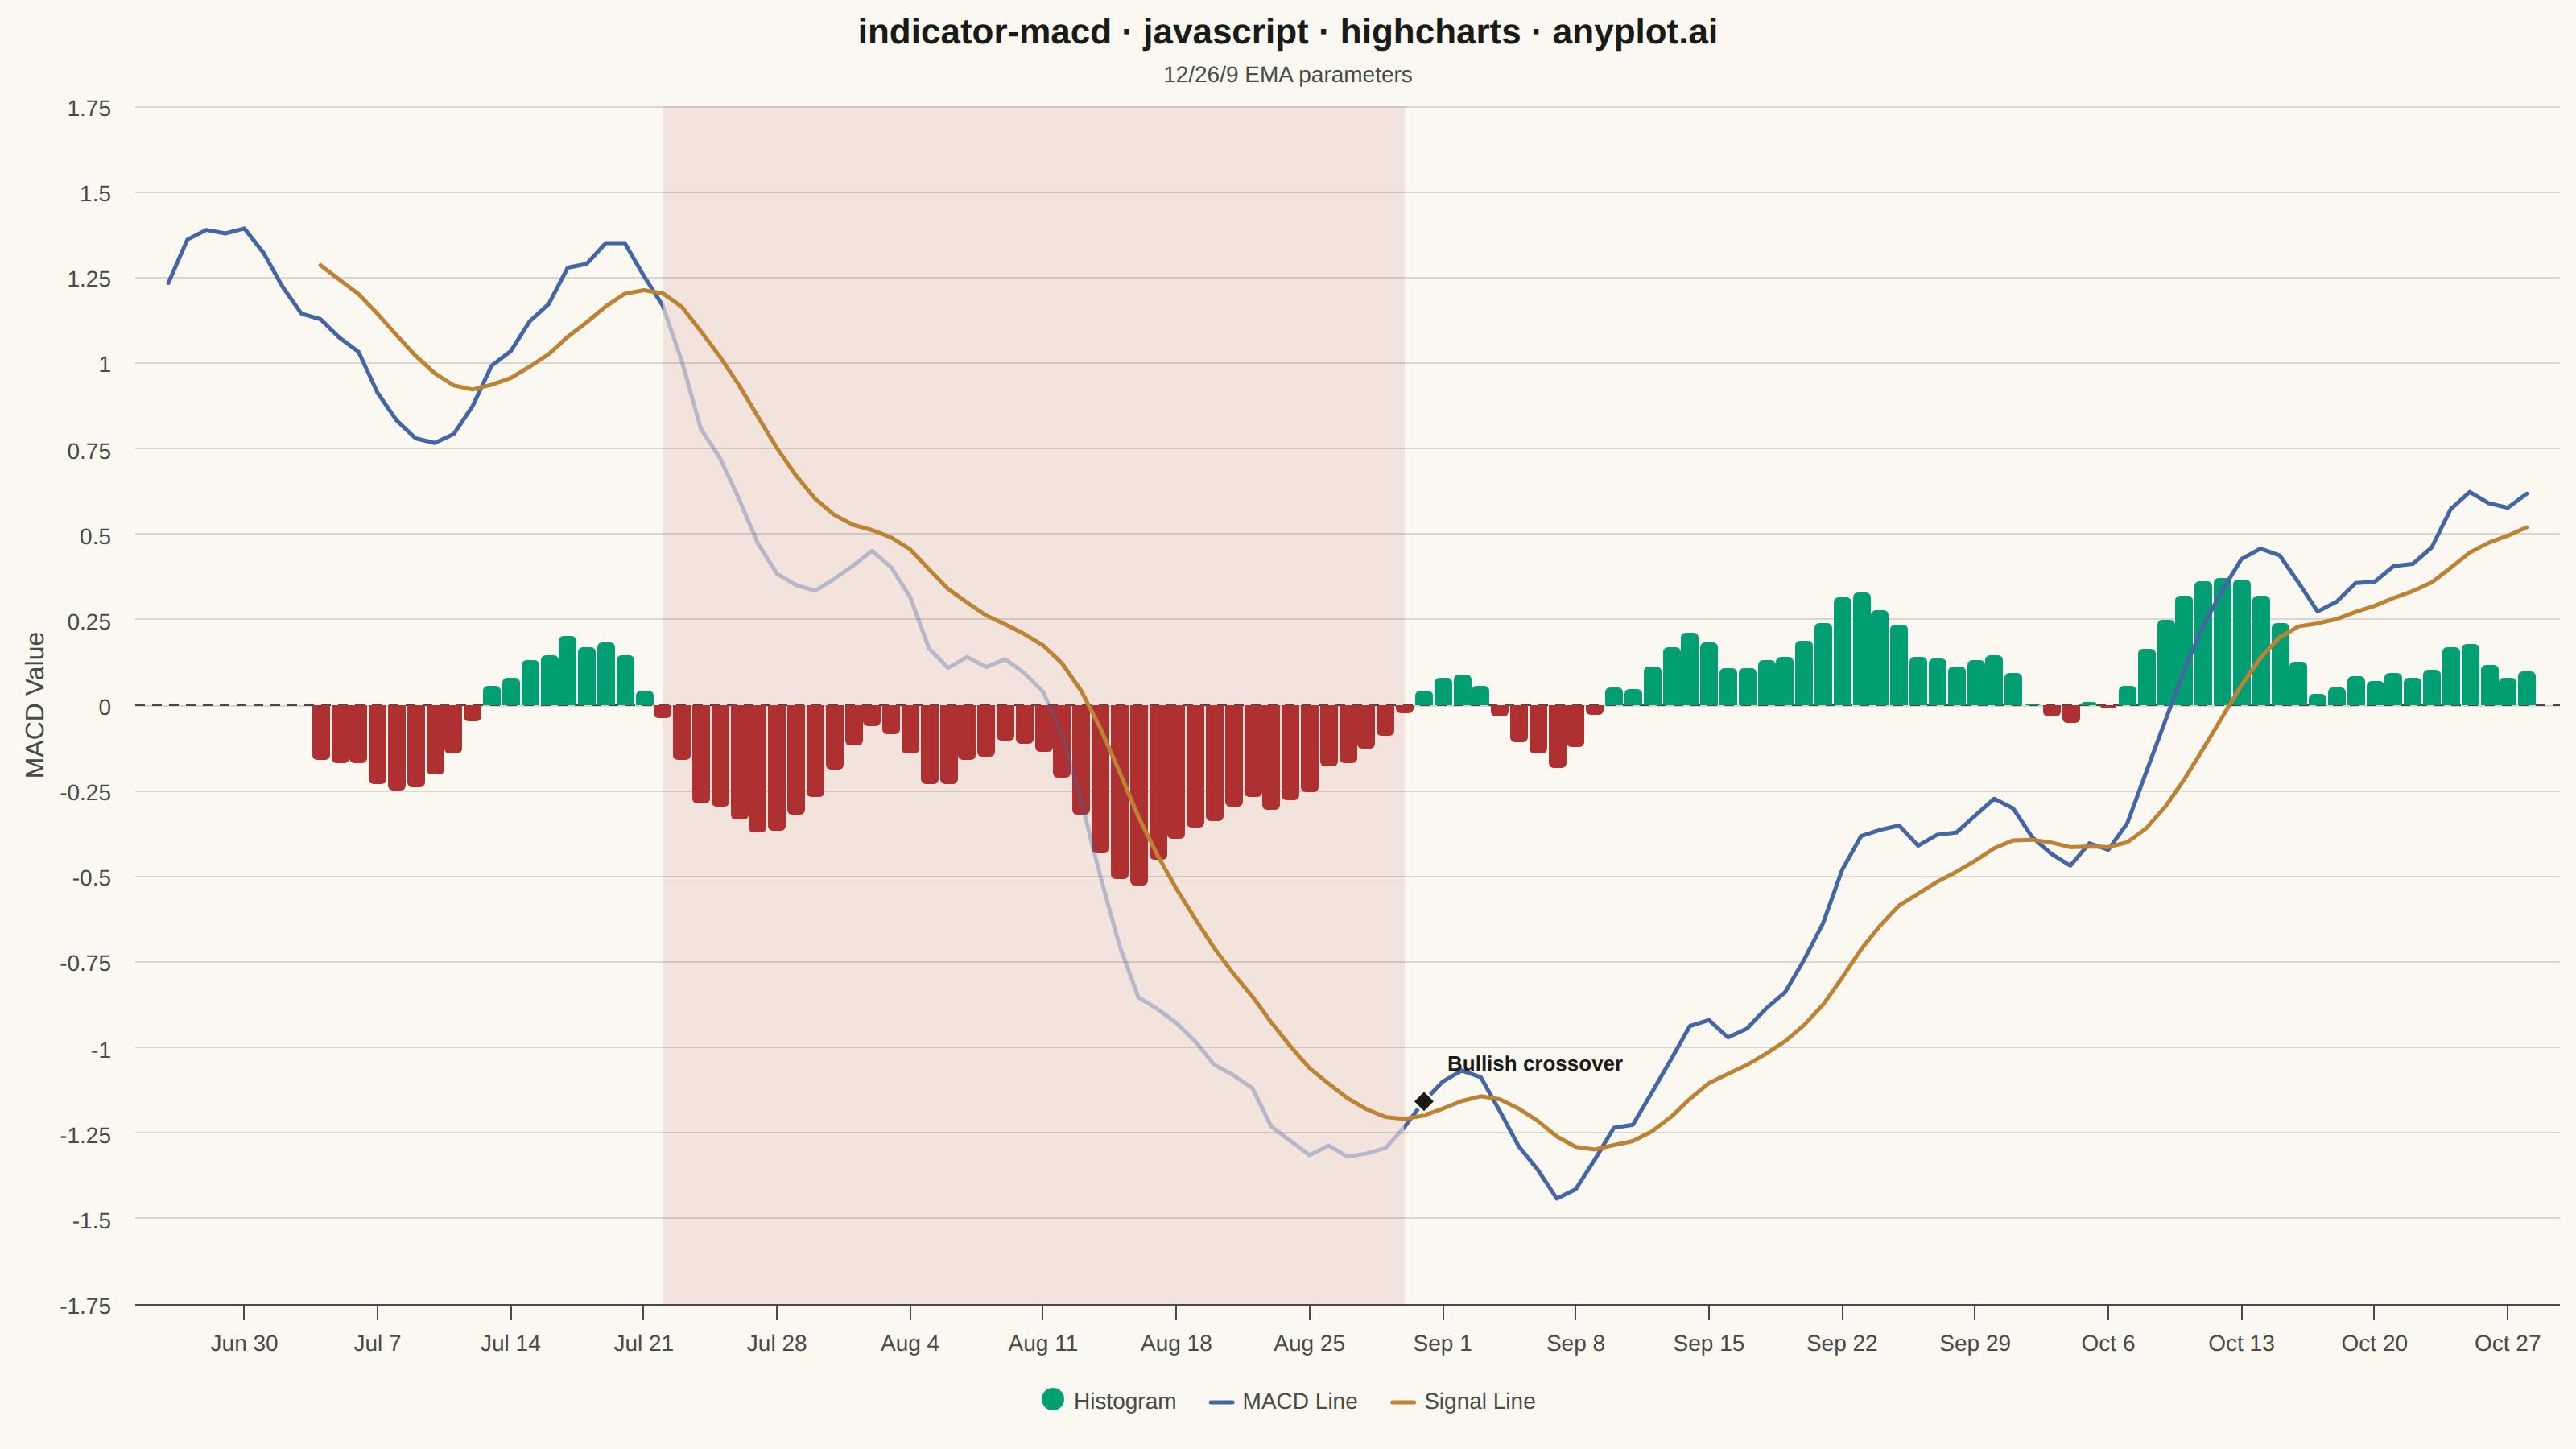
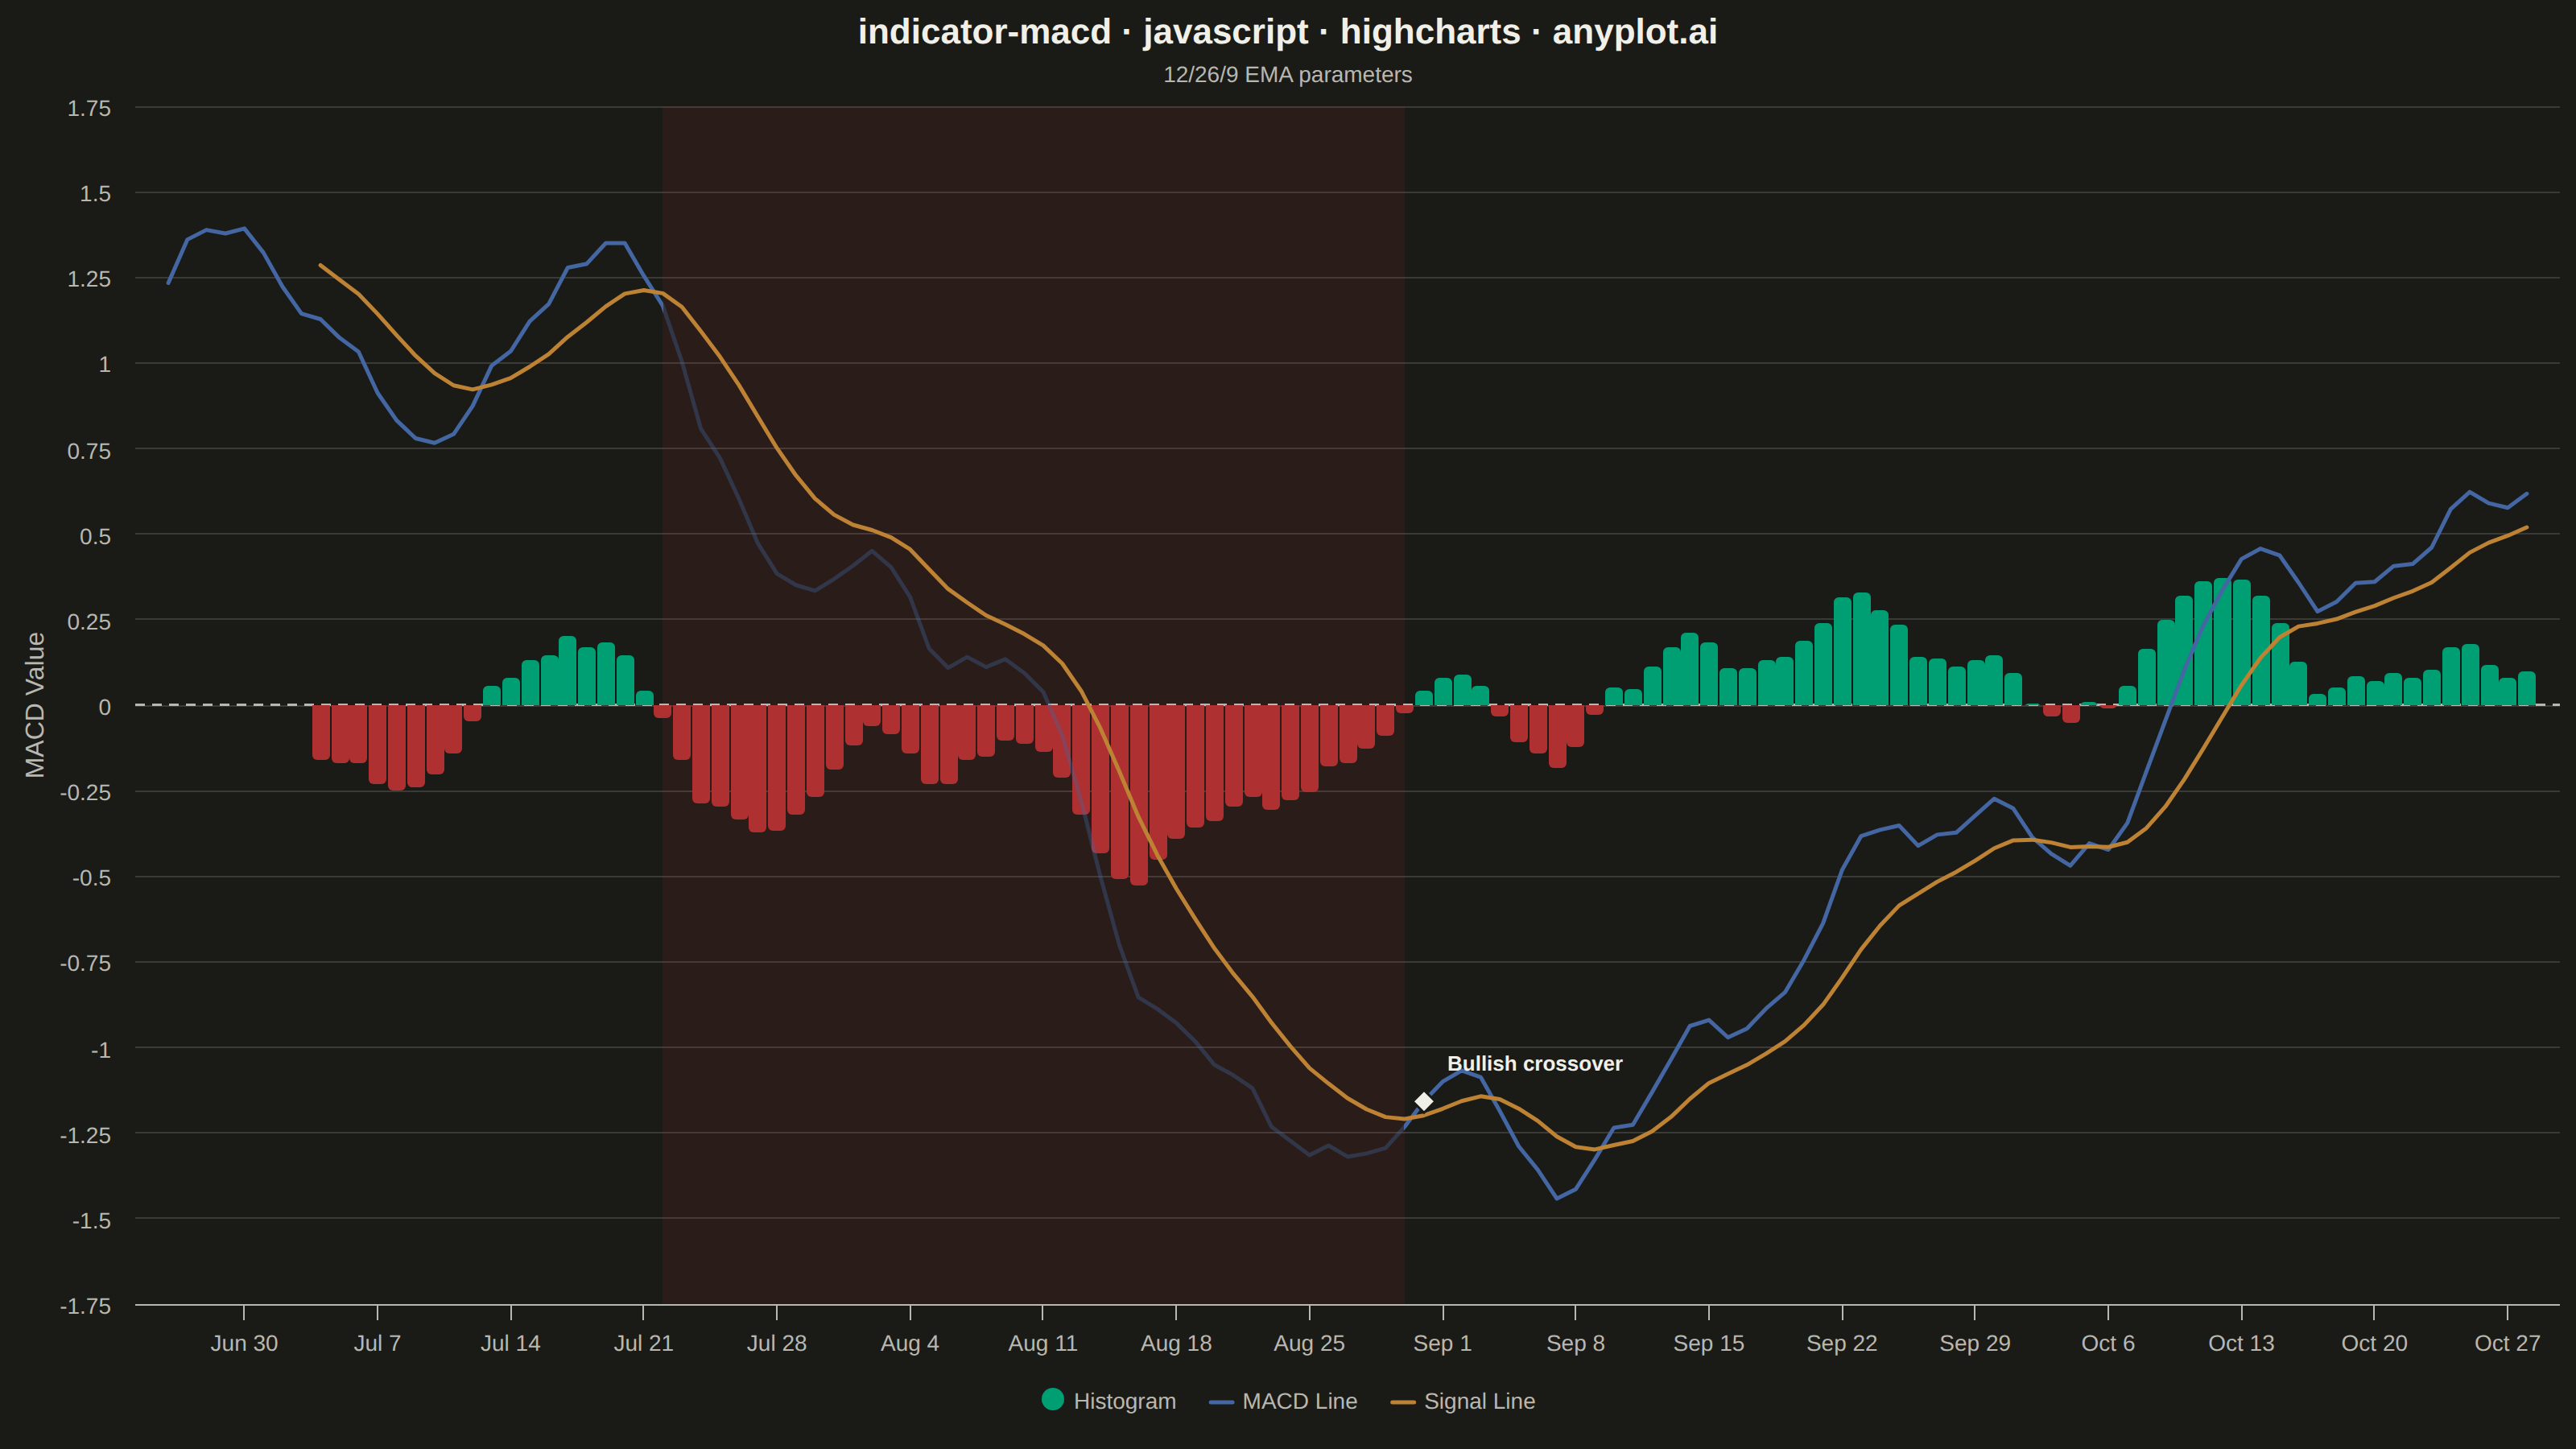
A MACD (Moving Average Convergence Divergence) chart displaying three components: the MACD line, signal line, and histogram. The MACD line represents the difference between 12-day and 26-day exponential moving averages, while the signal line is a 9-day EMA of the MACD. The histogram visualizes the difference between these two lines. This is an essential momentum oscillator for technical analysis, helping traders identify trend direction, momentum strength, and potential buy/sell signals through line crossovers.
// anyplot.ai
// indicator-macd: MACD Technical Indicator Chart
// Library: highcharts 12.6.0 | JavaScript 22.23.2
// Quality: 94/100 | Created: 2026-09-05

//# anyplot-orientation: landscape
const t = window.ANYPLOT_TOKENS;

// --- Data (in-memory, deterministic) ---------------------------------------
function lcg(seed) {
  let state = seed;
  return () => {
    state = (state * 1103515245 + 12345) % 2147483648;
    return state / 2147483648;
  };
}
const random = lcg(42);

const periods = 150;
const startDate = Date.UTC(2025, 5, 1);
const dayMs = 24 * 60 * 60 * 1000;

// Simulated daily closing price: cyclical drift + noise, deterministic
const closingPrices = [];
let price = 150;
for (let i = 0; i < periods; i++) {
  const drift = 0.15 * Math.sin(i / 18);
  const noise = (random() - 0.5) * 2.2;
  price += drift + noise;
  closingPrices.push(price);
}

// EMA seeded with the SMA of the first `period` values, standard MACD practice
function ema(values, period) {
  const k = 2 / (period + 1);
  const out = new Array(values.length).fill(null);
  let sum = 0;
  for (let i = 0; i < period; i++) sum += values[i];
  let prev = sum / period;
  out[period - 1] = prev;
  for (let i = period; i < values.length; i++) {
    prev = values[i] * k + prev * (1 - k);
    out[i] = prev;
  }
  return out;
}

const ema12 = ema(closingPrices, 12);
const ema26 = ema(closingPrices, 26);

// MACD line starts once the slower 26-day EMA is defined
const macdValues = [];
for (let i = 25; i < periods; i++) {
  macdValues.push(ema12[i] - ema26[i]);
}
const signalValues = ema(macdValues, 9);

const macdSeries = [];
const signalSeries = [];
const histogramSeries = [];
for (let j = 0; j < macdValues.length; j++) {
  const timestamp = startDate + (25 + j) * dayMs;
  macdSeries.push([timestamp, macdValues[j]]);
  if (signalValues[j] !== null) {
    signalSeries.push([timestamp, signalValues[j]]);
    histogramSeries.push([timestamp, macdValues[j] - signalValues[j]]);
  }
}

// Find the deepest bearish stretch (the contiguous run of negative histogram
// bars around the global minimum) and shade it; the bar right after it is,
// by construction, the bullish crossover that ends the stretch — call it out.
let troughIdx = 0;
for (let k = 1; k < histogramSeries.length; k++) {
  if (histogramSeries[k][1] < histogramSeries[troughIdx][1]) troughIdx = k;
}
let bearStart = troughIdx;
while (bearStart > 0 && histogramSeries[bearStart - 1][1] < 0) bearStart--;
let bearEnd = troughIdx;
while (
  bearEnd < histogramSeries.length - 1 &&
  histogramSeries[bearEnd + 1][1] < 0
)
  bearEnd++;
const bearBandFrom = histogramSeries[bearStart][0];
const bearBandTo = histogramSeries[bearEnd][0];

const crossoverIdx = bearEnd + 1;
const crossoverPoint =
  crossoverIdx < histogramSeries.length && histogramSeries[crossoverIdx][1] >= 0
    ? {
        x: histogramSeries[crossoverIdx][0],
        y: signalSeries[crossoverIdx][1] + histogramSeries[crossoverIdx][1],
      }
    : null;
const mutedMacdColor = Highcharts.color(t.palette[2]).setOpacity(0.35).get();

// --- Chart -----------------------------------------------------------------
Highcharts.chart("container", {
  chart: {
    backgroundColor: "transparent",
    animation: false,
    style: { fontFamily: "inherit" },
  },
  credits: { enabled: false },
  colors: t.palette,
  title: {
    text: "indicator-macd · javascript · highcharts · anyplot.ai",
    style: { color: t.ink, fontSize: "22px", fontWeight: "600" },
  },
  subtitle: {
    text: "12/26/9 EMA parameters",
    style: { color: t.inkSoft, fontSize: "14px" },
  },
  xAxis: {
    type: "datetime",
    lineColor: t.inkSoft,
    tickColor: t.inkSoft,
    labels: { style: { color: t.inkSoft, fontSize: "14px" } },
    plotBands: [
      {
        from: bearBandFrom,
        to: bearBandTo,
        color: Highcharts.color(t.palette[4]).setOpacity(0.1).get(),
        zIndex: 0,
      },
    ],
  },
  yAxis: {
    title: {
      text: "MACD Value",
      style: { color: t.inkSoft, fontSize: "16px" },
    },
    gridLineColor: t.grid,
    labels: { style: { color: t.inkSoft, fontSize: "14px" } },
    plotLines: [
      { value: 0, color: t.inkSoft, width: 1.5, dashStyle: "Dash", zIndex: 3 },
    ],
  },
  legend: {
    itemStyle: { color: t.inkSoft, fontSize: "14px" },
    itemHoverStyle: { color: t.ink },
  },
  plotOptions: {
    series: { animation: false },
    column: { borderWidth: 0, pointPadding: 0.05, groupPadding: 0 },
    line: { lineWidth: 2.5, marker: { enabled: false } },
  },
  series: [
    {
      type: "column",
      name: "Histogram",
      data: histogramSeries,
      color: t.palette[0],
      negativeColor: t.palette[4],
    },
    {
      type: "line",
      name: "MACD Line",
      data: macdSeries,
      color: t.palette[2],
      zoneAxis: "x",
      zones: [
        { value: bearBandFrom, color: t.palette[2] },
        { value: bearBandTo, color: mutedMacdColor },
        { color: t.palette[2] },
      ],
    },
    {
      type: "line",
      name: "Signal Line",
      data: signalSeries,
      color: t.palette[3],
    },
    ...(crossoverPoint
      ? [
          {
            type: "scatter",
            name: "Bullish Crossover",
            data: [crossoverPoint],
            color: t.ink,
            marker: {
              symbol: "diamond",
              radius: 7,
              lineWidth: 1.5,
              lineColor: t.pageBg,
            },
            dataLabels: {
              enabled: true,
              format: "Bullish crossover",
              align: "left",
              x: 10,
              y: -12,
              style: {
                color: t.ink,
                fontSize: "13px",
                fontWeight: "600",
                textOutline: "none",
              },
            },
            enableMouseTracking: false,
            showInLegend: false,
          },
        ]
      : []),
  ],
});
Runnable source as JSON, for any HTTP client: https://api.anyplot.ai/specs/indicator-macd/highcharts/code. Any spec id and library id listed in llms-full.txt fit the same URL shape; every URL below is complete and callable.
{
  "spec_id": "indicator-macd",
  "language": "javascript",
  "library": "highcharts",
  "page": "https://anyplot.ai/indicator-macd/javascript/highcharts",
  "hub": "https://anyplot.ai/indicator-macd",
  "code_json": "https://api.anyplot.ai/specs/indicator-macd/highcharts/code",
  "spec_json": "https://api.anyplot.ai/specs/indicator-macd",
  "render_light_png": "https://storage.googleapis.com/anyplot-images/plots/indicator-macd/javascript/highcharts/plot-light.png",
  "render_dark_png": "https://storage.googleapis.com/anyplot-images/plots/indicator-macd/javascript/highcharts/plot-dark.png",
  "interactive_light_html": "https://storage.googleapis.com/anyplot-images/plots/indicator-macd/javascript/highcharts/plot-light.html",
  "interactive_dark_html": "https://storage.googleapis.com/anyplot-images/plots/indicator-macd/javascript/highcharts/plot-dark.html",
  "quality_score": 94.0,
  "license": "MIT",
  "guide": "https://anyplot.ai/llms.txt"
}
Part of MACD Technical Indicator Chart on anyplot.ai.