The same plot in 14 other libraries — JavaScript: Chart.js, Apache ECharts, Highcharts, MUI X Charts; Python: Altair, Bokeh, lets-plot, Matplotlib, Plotly, plotnine, Pygal, Seaborn; R: ggplot2; Julia: Makie.jl. Compare all 15 side by side: MACD Technical Indicator Chart in Python, R, Julia and JavaScript.
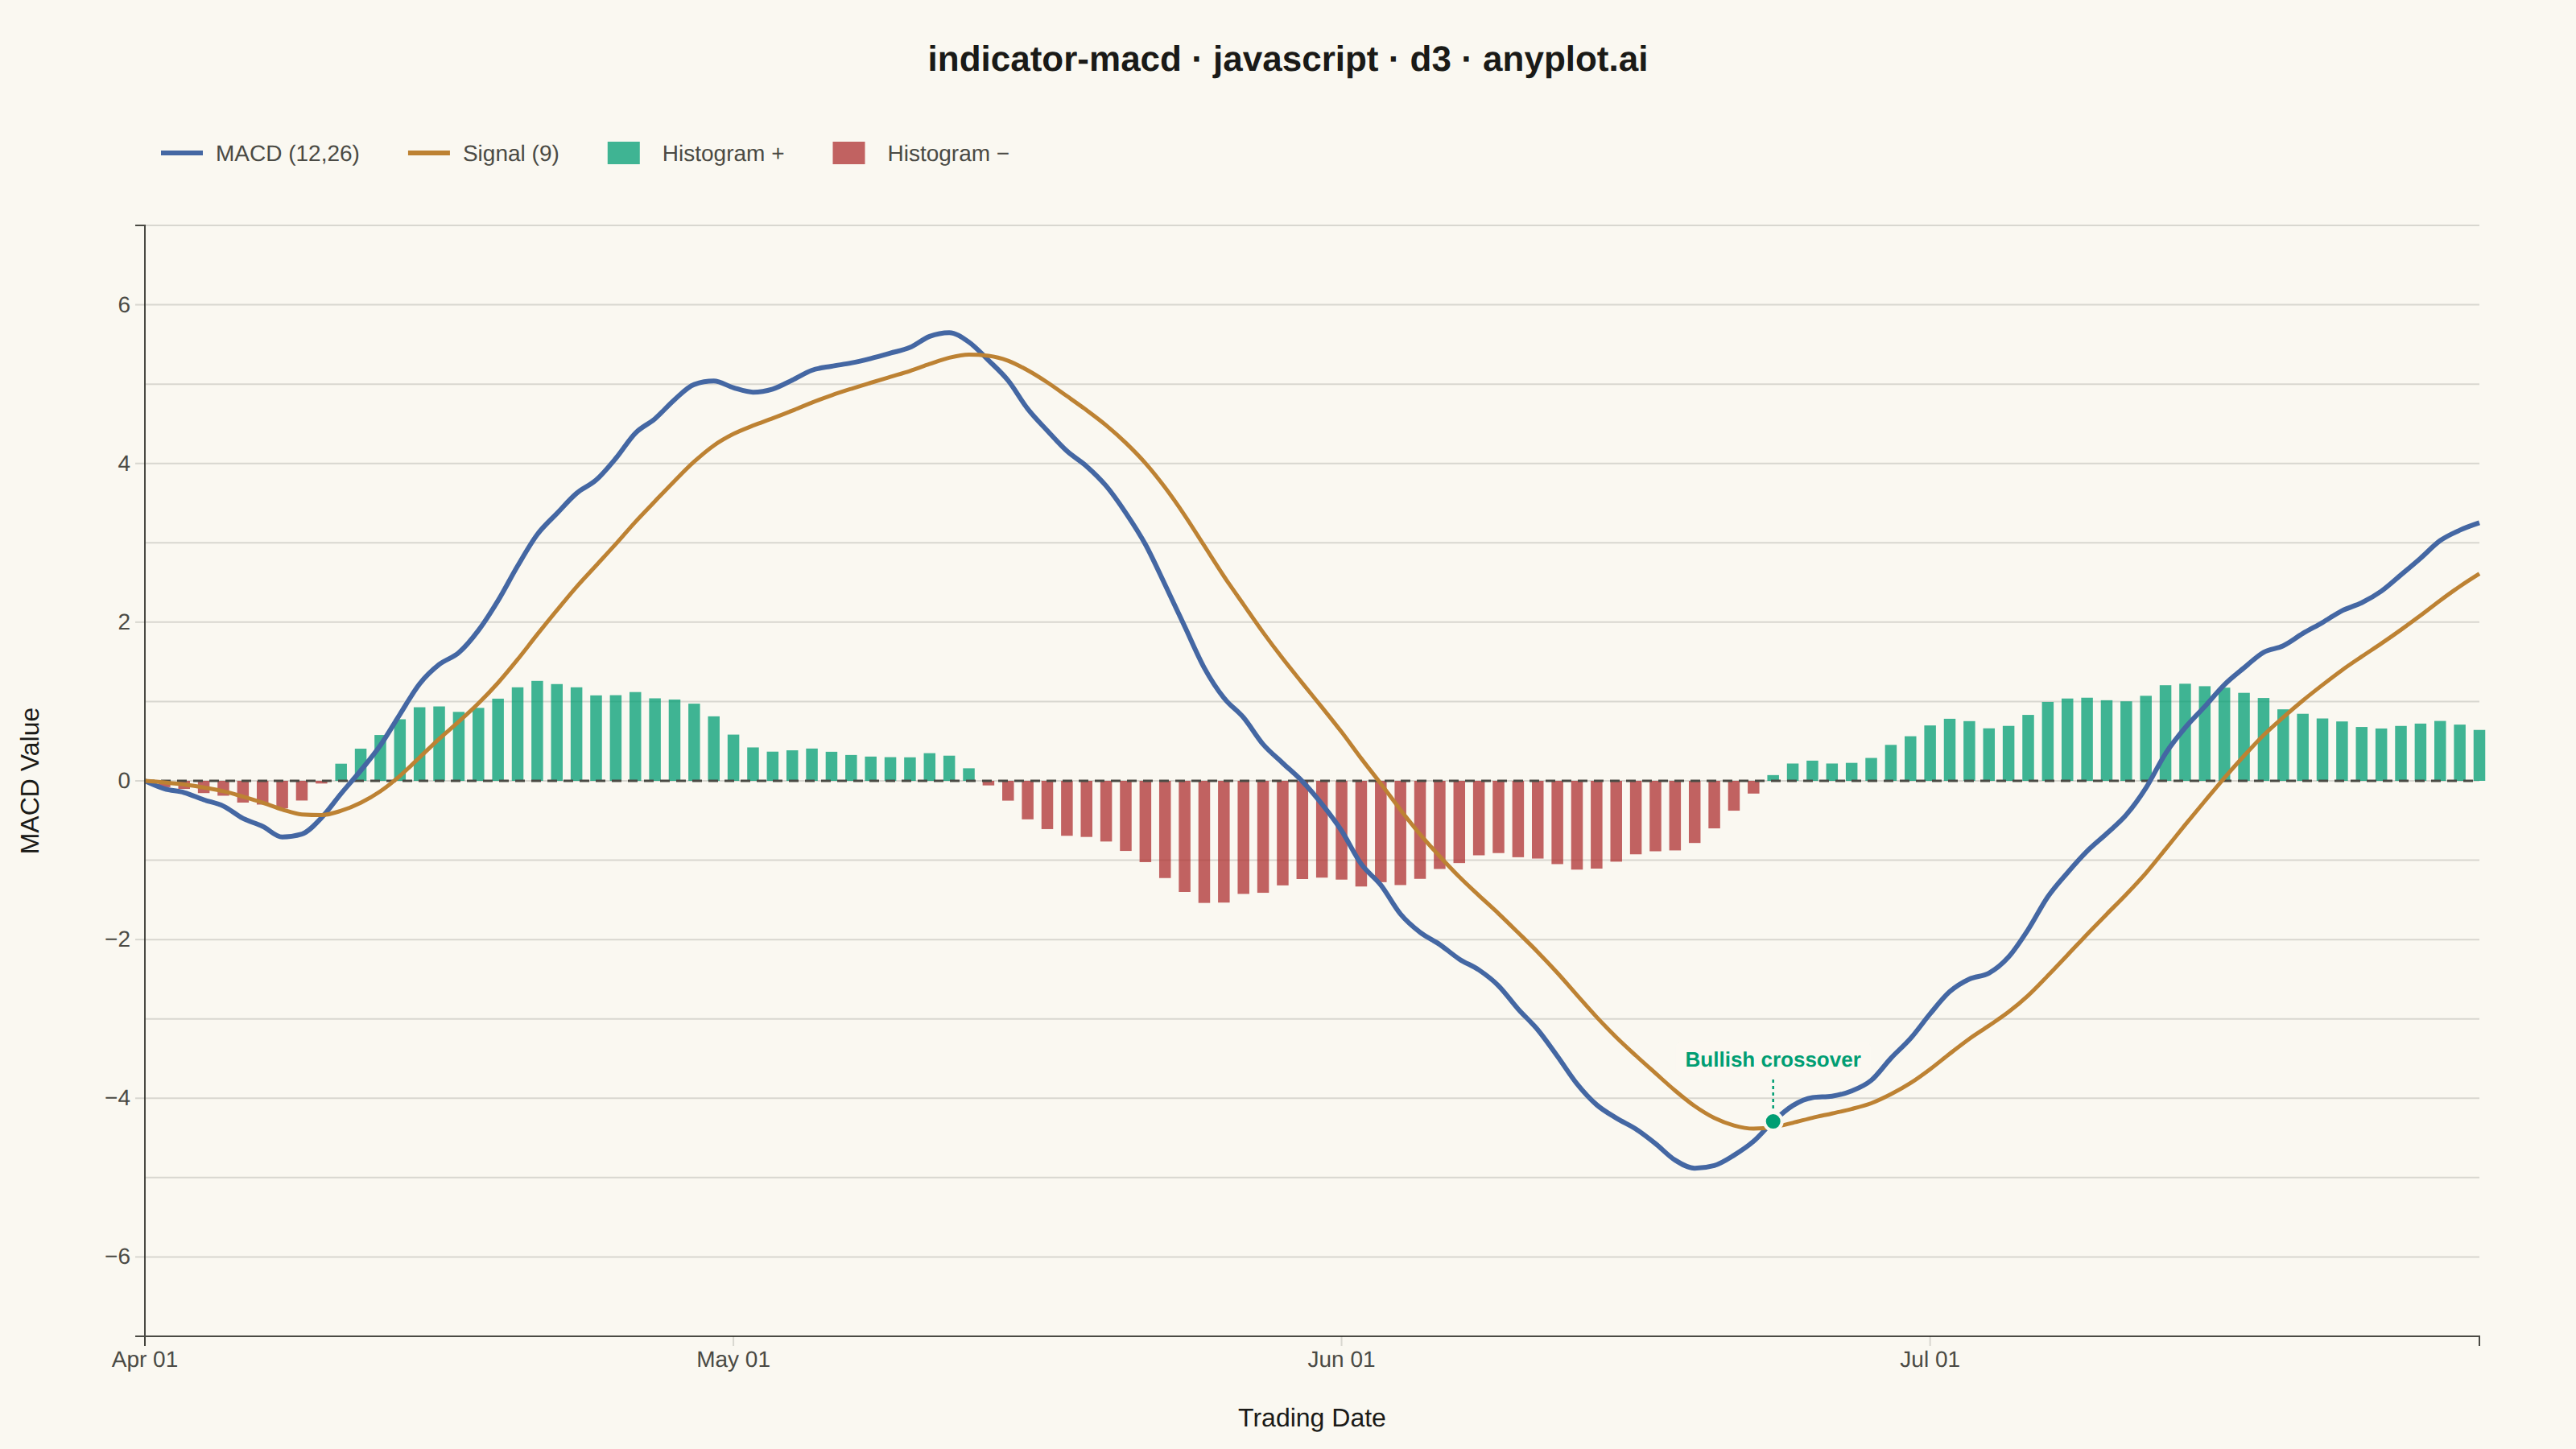
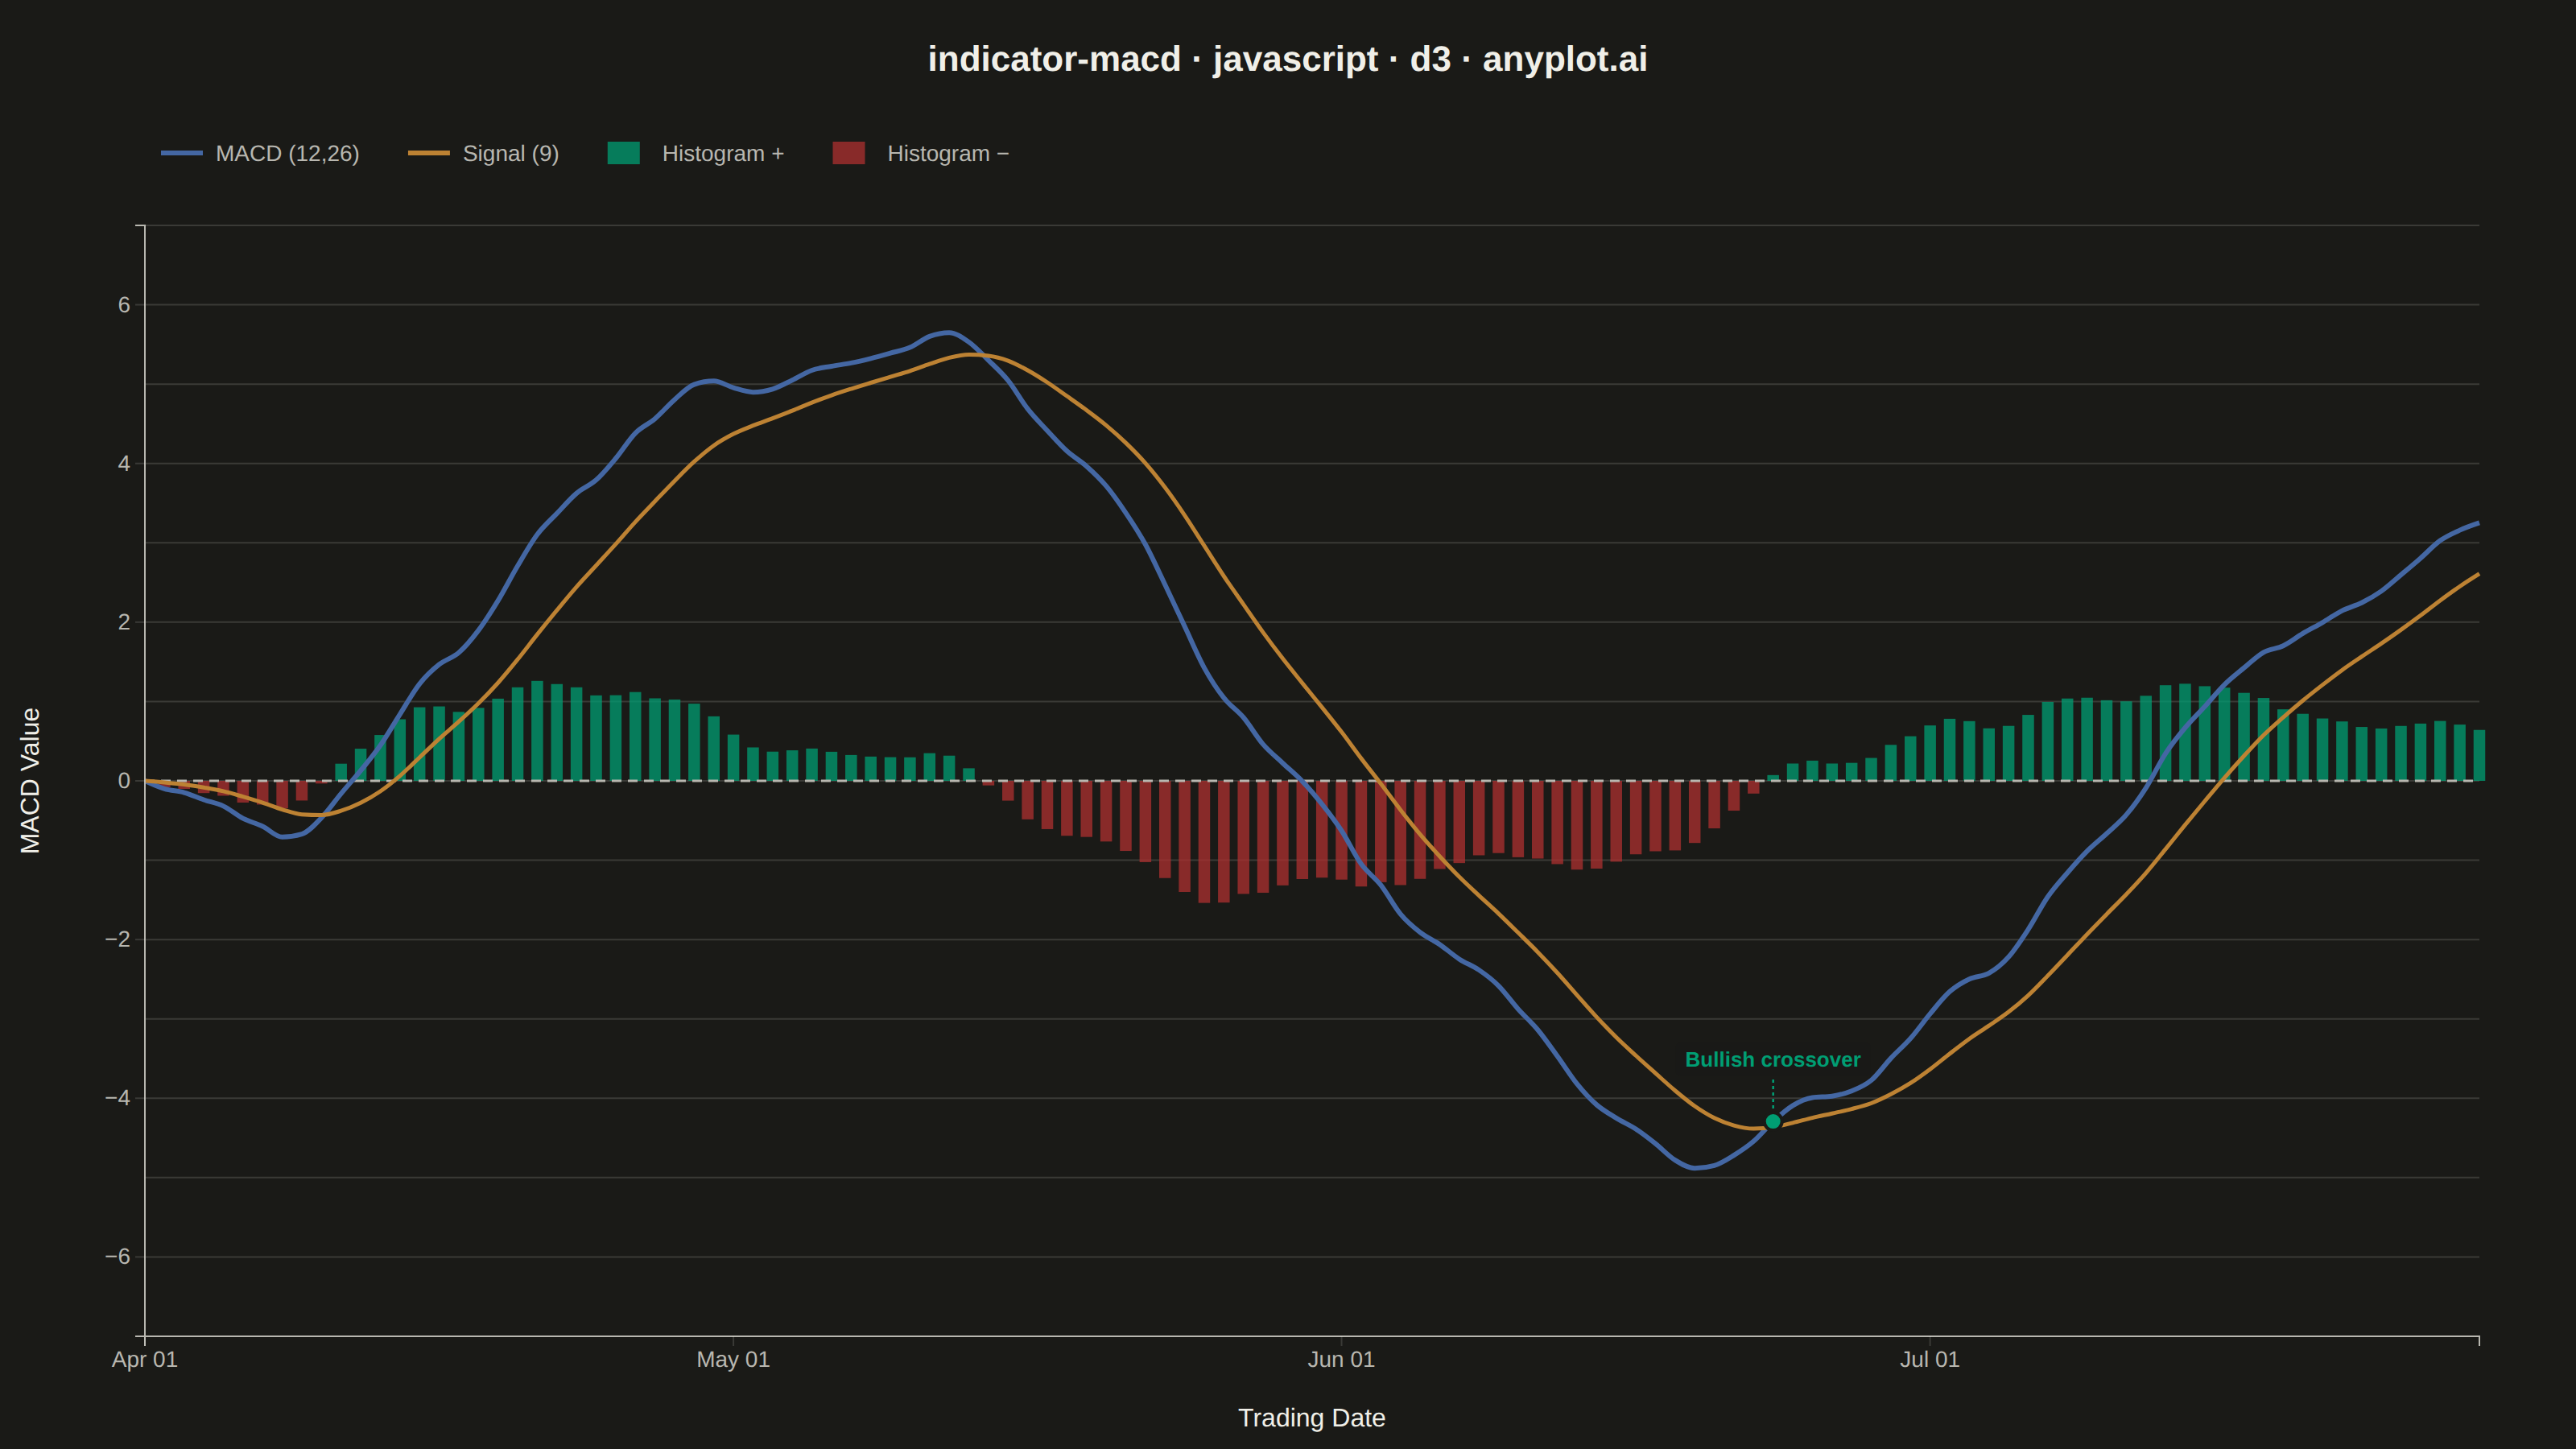
A MACD (Moving Average Convergence Divergence) chart displaying three components: the MACD line, signal line, and histogram. The MACD line represents the difference between 12-day and 26-day exponential moving averages, while the signal line is a 9-day EMA of the MACD. The histogram visualizes the difference between these two lines. This is an essential momentum oscillator for technical analysis, helping traders identify trend direction, momentum strength, and potential buy/sell signals through line crossovers.
// anyplot.ai
// indicator-macd: MACD Technical Indicator Chart
// Library: d3 7.9.0 | JavaScript 22.23.2
// Quality: 90/100 | Created: 2026-09-05

const t = window.ANYPLOT_TOKENS;
const { width, height } = window.ANYPLOT_SIZE;
const margin = { top: 140, right: 60, bottom: 70, left: 90 };
const iw = width - margin.left - margin.right;
const ih = height - margin.top - margin.bottom;

// --- Data: deterministic LCG-driven synthetic MACD series (12/26/9) ---------
let seed = 42;
function lcg() {
  seed = (seed * 1664525 + 1013904223) % 4294967296;
  return seed / 4294967296;
}

const numPeriods = 120;
const startDate = new Date("2025-04-01T00:00:00Z");

function ema(values, period) {
  const k = 2 / (period + 1);
  const out = new Array(values.length);
  out[0] = values[0];
  for (let i = 1; i < values.length; i += 1) {
    out[i] = values[i] * k + out[i - 1] * (1 - k);
  }
  return out;
}

const closes = [];
let price = 182;
let trendPhase = 0;
for (let i = 0; i < numPeriods; i += 1) {
  trendPhase = i / 14;
  const drift = Math.sin(trendPhase) * 0.9;
  const noise = (lcg() - 0.5) * 3.2;
  price += drift + noise;
  closes.push(price);
}

const ema12 = ema(closes, 12);
const ema26 = ema(closes, 26);
const macdLine = ema12.map((v, i) => v - ema26[i]);
const signalLine = ema(macdLine, 9);

const data = closes.map((_, i) => ({
  date: new Date(startDate.getTime() + i * 86400000),
  macd: macdLine[i],
  signal: signalLine[i],
  histogram: macdLine[i] - signalLine[i],
}));

// --- SVG mount ---------------------------------------------------------------
const svg = d3.select("#container").append("svg").attr("width", width).attr("height", height);
const g = svg.append("g").attr("transform", `translate(${margin.left},${margin.top})`);

// --- Scales -------------------------------------------------------------------
const x = d3
  .scaleTime()
  .domain(d3.extent(data, (d) => d.date))
  .range([0, iw]);

const yExtent = d3.extent(data.flatMap((d) => [d.macd, d.signal, d.histogram]));
const yPad = (yExtent[1] - yExtent[0]) * 0.12;
const y = d3
  .scaleLinear()
  .domain([yExtent[0] - yPad, yExtent[1] + yPad])
  .nice()
  .range([ih, 0]);

// --- Gridlines (y only) --------------------------------------------------------
g.append("g")
  .attr("class", "grid")
  .call(d3.axisLeft(y).tickSize(-iw).tickFormat(""))
  .call((sel) => sel.select(".domain").remove())
  .call((sel) => sel.selectAll("line").attr("stroke", t.grid));

// --- Histogram bars: green above zero, red below ------------------------------
const barWidth = Math.max(1.5, (iw / numPeriods) * 0.6);
const posColor = t.palette[0]; // brand green — gain
const negColor = t.palette[4]; // matte red — loss (semantic exception: finance up/down)

g.selectAll("rect.hist")
  .data(data)
  .join("rect")
  .attr("class", "hist")
  .attr("x", (d) => x(d.date) - barWidth / 2)
  .attr("y", (d) => y(Math.max(0, d.histogram)))
  .attr("width", barWidth)
  .attr("height", (d) => Math.abs(y(d.histogram) - y(0)))
  .attr("fill", (d) => (d.histogram >= 0 ? posColor : negColor))
  .attr("opacity", 0.75);

// --- Zero reference line (dashed to read as a reference, not another series) ----
g.append("line")
  .attr("x1", 0)
  .attr("x2", iw)
  .attr("y1", y(0))
  .attr("y2", y(0))
  .attr("stroke", t.inkSoft)
  .attr("stroke-width", 1.5)
  .attr("stroke-dasharray", "6,4");

// --- MACD + signal lines ---------------------------------------------------------
const macdColor = t.palette[2]; // blue
const signalColor = t.palette[3]; // ochre — distinct from blue, warm/cool contrast

const macdPath = d3
  .line()
  .x((d) => x(d.date))
  .y((d) => y(d.macd))
  .curve(d3.curveMonotoneX);

const signalPath = d3
  .line()
  .x((d) => x(d.date))
  .y((d) => y(d.signal))
  .curve(d3.curveMonotoneX);

g.append("path").datum(data).attr("fill", "none").attr("stroke", macdColor).attr("stroke-width", 3).attr("d", macdPath);

g.append("path")
  .datum(data)
  .attr("fill", "none")
  .attr("stroke", signalColor)
  .attr("stroke-width", 2.5)
  .attr("d", signalPath);

// --- Crossover callouts: detect sign flips of (macd - signal) past the EMA -----
// warm-up window and label the first bullish and first later bearish crossing
// with a leader-line + auto-sized backdrop (sized via getBBox(), not hard-coded).
function findCrossovers(rows, minIndex) {
  const found = [];
  for (let i = Math.max(1, minIndex); i < rows.length; i += 1) {
    const prevDiff = rows[i - 1].macd - rows[i - 1].signal;
    const currDiff = rows[i].macd - rows[i].signal;
    if (prevDiff <= 0 && currDiff > 0) found.push({ index: i, type: "bullish" });
    else if (prevDiff >= 0 && currDiff < 0) found.push({ index: i, type: "bearish" });
  }
  return found;
}

const crossings = findCrossovers(data, 35);
const bullishCross = crossings.find((c) => c.type === "bullish");
const bearishCross = crossings.find((c) => c.type === "bearish" && (!bullishCross || c.index > bullishCross.index));
const callouts = [bullishCross, bearishCross].filter(Boolean);

const calloutGroup = g.append("g").attr("class", "callouts");
callouts.forEach((c) => {
  const d = data[c.index];
  const isBullish = c.type === "bullish";
  const cx = x(d.date);
  const cy = y(d.macd);
  const dy = isBullish ? -34 : 34;
  const labelY = Math.max(14, Math.min(ih - 14, cy + dy));
  const calloutColor = isBullish ? posColor : negColor;

  calloutGroup
    .append("circle")
    .attr("cx", cx)
    .attr("cy", cy)
    .attr("r", 5.5)
    .attr("fill", calloutColor)
    .attr("stroke", t.pageBg)
    .attr("stroke-width", 2);

  calloutGroup
    .append("line")
    .attr("x1", cx)
    .attr("y1", cy + (labelY > cy ? 8 : -8))
    .attr("x2", cx)
    .attr("y2", labelY + (labelY > cy ? -8 : 8))
    .attr("stroke", calloutColor)
    .attr("stroke-width", 1.25)
    .attr("stroke-dasharray", "2,2");

  const label = calloutGroup
    .append("text")
    .attr("x", cx)
    .attr("y", labelY)
    .attr("text-anchor", "middle")
    .style("font-size", "13px")
    .style("font-weight", "600")
    .attr("fill", calloutColor)
    .text(isBullish ? "Bullish crossover" : "Bearish crossover");

  const bbox = label.node().getBBox();
  calloutGroup
    .insert("rect", () => label.node())
    .attr("x", bbox.x - 6)
    .attr("y", bbox.y - 3)
    .attr("width", bbox.width + 12)
    .attr("height", bbox.height + 6)
    .attr("rx", 3)
    .attr("fill", t.pageBg)
    .attr("opacity", 0.85);
});

// --- Axes --------------------------------------------------------------------
const xAxis = g
  .append("g")
  .attr("transform", `translate(0,${ih})`)
  .call(d3.axisBottom(x).ticks(6).tickFormat(d3.timeFormat("%b %d")));
const yAxis = g.append("g").call(d3.axisLeft(y).ticks(6));

for (const ax of [xAxis, yAxis]) {
  ax.selectAll("text").attr("fill", t.inkSoft).style("font-size", "14px");
  ax.selectAll("line").attr("stroke", t.grid);
  ax.select(".domain").attr("stroke", t.inkSoft);
}

// --- Axis labels ---------------------------------------------------------------
g.append("text")
  .attr("x", iw / 2)
  .attr("y", ih + 56)
  .attr("text-anchor", "middle")
  .attr("fill", t.ink)
  .style("font-size", "16px")
  .text("Trading Date");

g.append("text")
  .attr("transform", "rotate(-90)")
  .attr("x", -ih / 2)
  .attr("y", -66)
  .attr("text-anchor", "middle")
  .attr("fill", t.ink)
  .style("font-size", "16px")
  .text("MACD Value");

// --- Legend --------------------------------------------------------------------
const legend = [
  { label: "MACD (12,26)", color: macdColor, type: "line" },
  { label: "Signal (9)", color: signalColor, type: "line" },
  { label: "Histogram +", color: posColor, type: "swatch" },
  { label: "Histogram −", color: negColor, type: "swatch" },
];

const legendGroup = svg
  .append("g")
  .attr("transform", `translate(${margin.left + 10}, ${margin.top - 45})`);

let lx = 0;
legend.forEach((item) => {
  const entry = legendGroup.append("g").attr("transform", `translate(${lx},0)`);
  if (item.type === "line") {
    entry
      .append("line")
      .attr("x1", 0)
      .attr("x2", 26)
      .attr("y1", 0)
      .attr("y2", 0)
      .attr("stroke", item.color)
      .attr("stroke-width", 3);
  } else {
    entry.append("rect").attr("x", 0).attr("y", -7).attr("width", 20).attr("height", 14).attr("fill", item.color).attr("opacity", 0.75);
  }
  const textEl = entry
    .append("text")
    .attr("x", 34)
    .attr("y", 5)
    .attr("fill", t.inkSoft)
    .style("font-size", "14px")
    .text(item.label);
  lx += 34 + textEl.node().getBBox().width + 30;
});

// --- Title -----------------------------------------------------------------
svg
  .append("text")
  .attr("x", width / 2)
  .attr("y", 44)
  .attr("text-anchor", "middle")
  .attr("fill", t.ink)
  .style("font-size", "22px")
  .style("font-weight", "600")
  .text("indicator-macd · javascript · d3 · anyplot.ai");
Runnable source as JSON, for any HTTP client: https://api.anyplot.ai/specs/indicator-macd/d3/code. Any spec id and library id listed in llms-full.txt fit the same URL shape; every URL below is complete and callable.
{
  "spec_id": "indicator-macd",
  "language": "javascript",
  "library": "d3",
  "page": "https://anyplot.ai/indicator-macd/javascript/d3",
  "hub": "https://anyplot.ai/indicator-macd",
  "code_json": "https://api.anyplot.ai/specs/indicator-macd/d3/code",
  "spec_json": "https://api.anyplot.ai/specs/indicator-macd",
  "render_light_png": "https://storage.googleapis.com/anyplot-images/plots/indicator-macd/javascript/d3/plot-light.png",
  "render_dark_png": "https://storage.googleapis.com/anyplot-images/plots/indicator-macd/javascript/d3/plot-dark.png",
  "interactive_light_html": "https://storage.googleapis.com/anyplot-images/plots/indicator-macd/javascript/d3/plot-light.html",
  "interactive_dark_html": "https://storage.googleapis.com/anyplot-images/plots/indicator-macd/javascript/d3/plot-dark.html",
  "quality_score": 90.0,
  "license": "MIT",
  "guide": "https://anyplot.ai/llms.txt"
}
Part of MACD Technical Indicator Chart on anyplot.ai.