The same plot in 14 other libraries — Python: Altair, Bokeh, lets-plot, Matplotlib, Plotly, plotnine, Pygal, Seaborn; Julia: Makie.jl; JavaScript: Chart.js, D3.js, Apache ECharts, Highcharts, MUI X Charts. Compare all 15 side by side: MACD Technical Indicator Chart in Python, R, Julia and JavaScript.
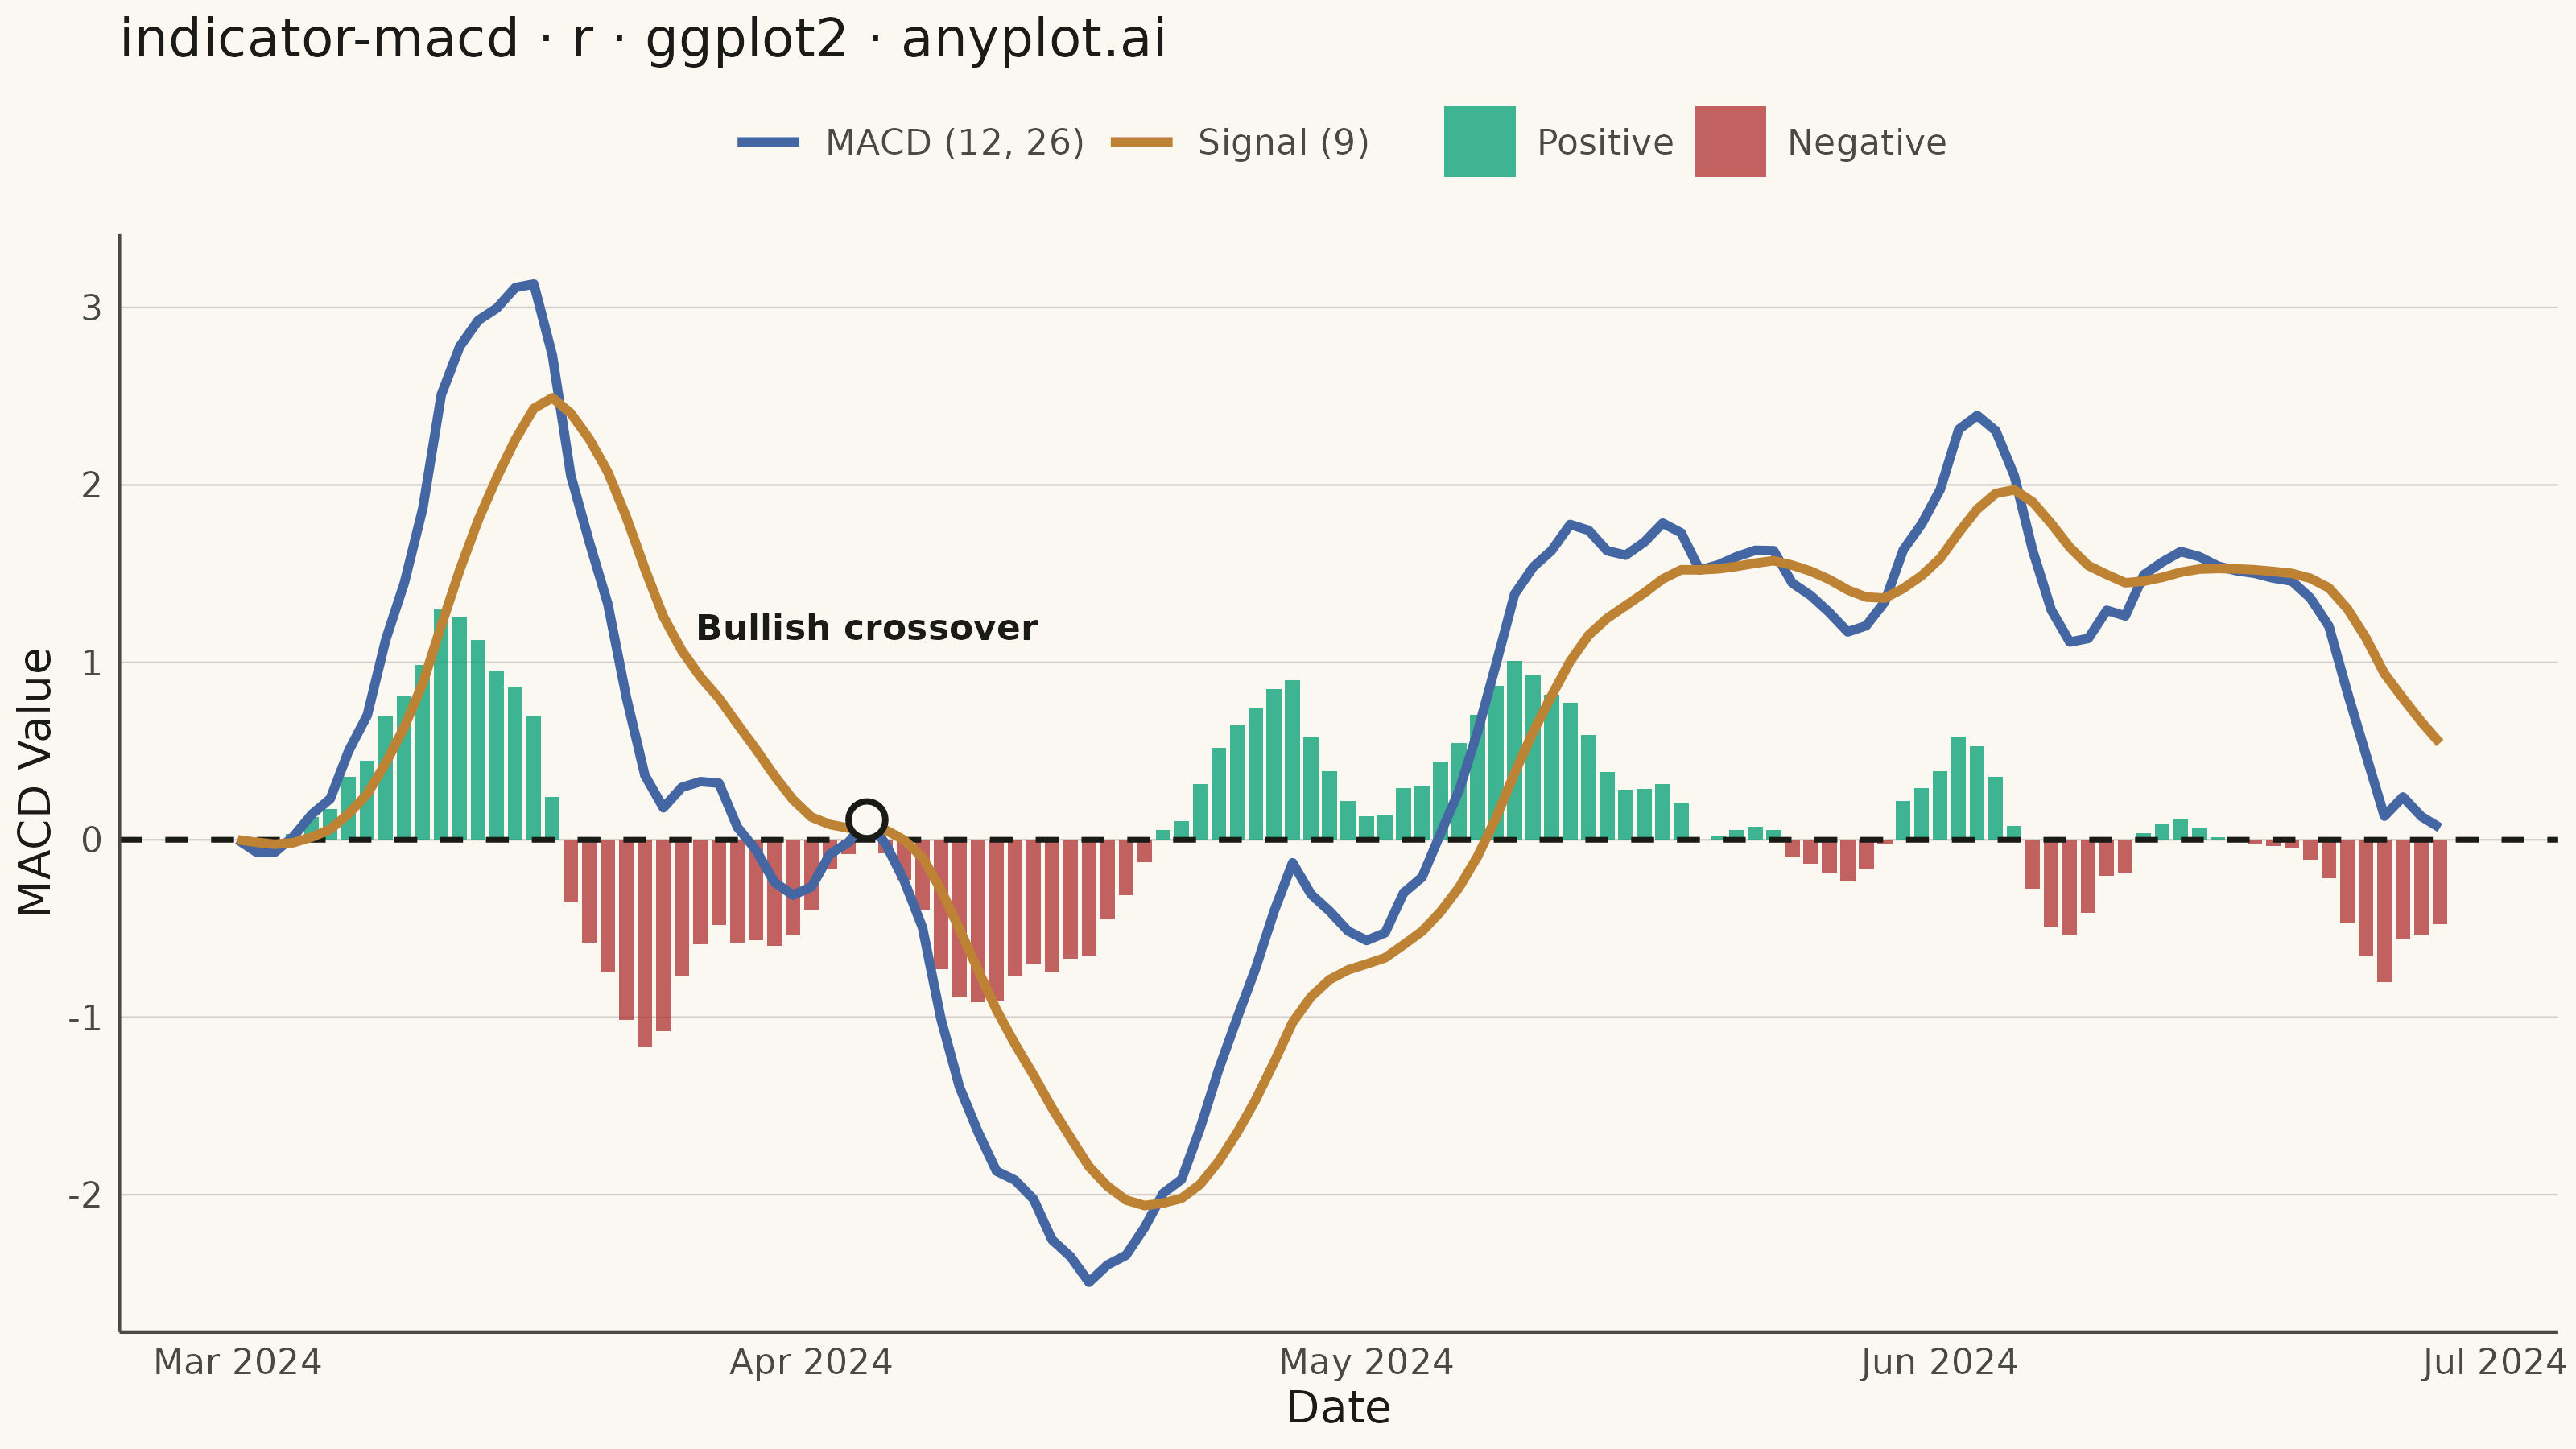
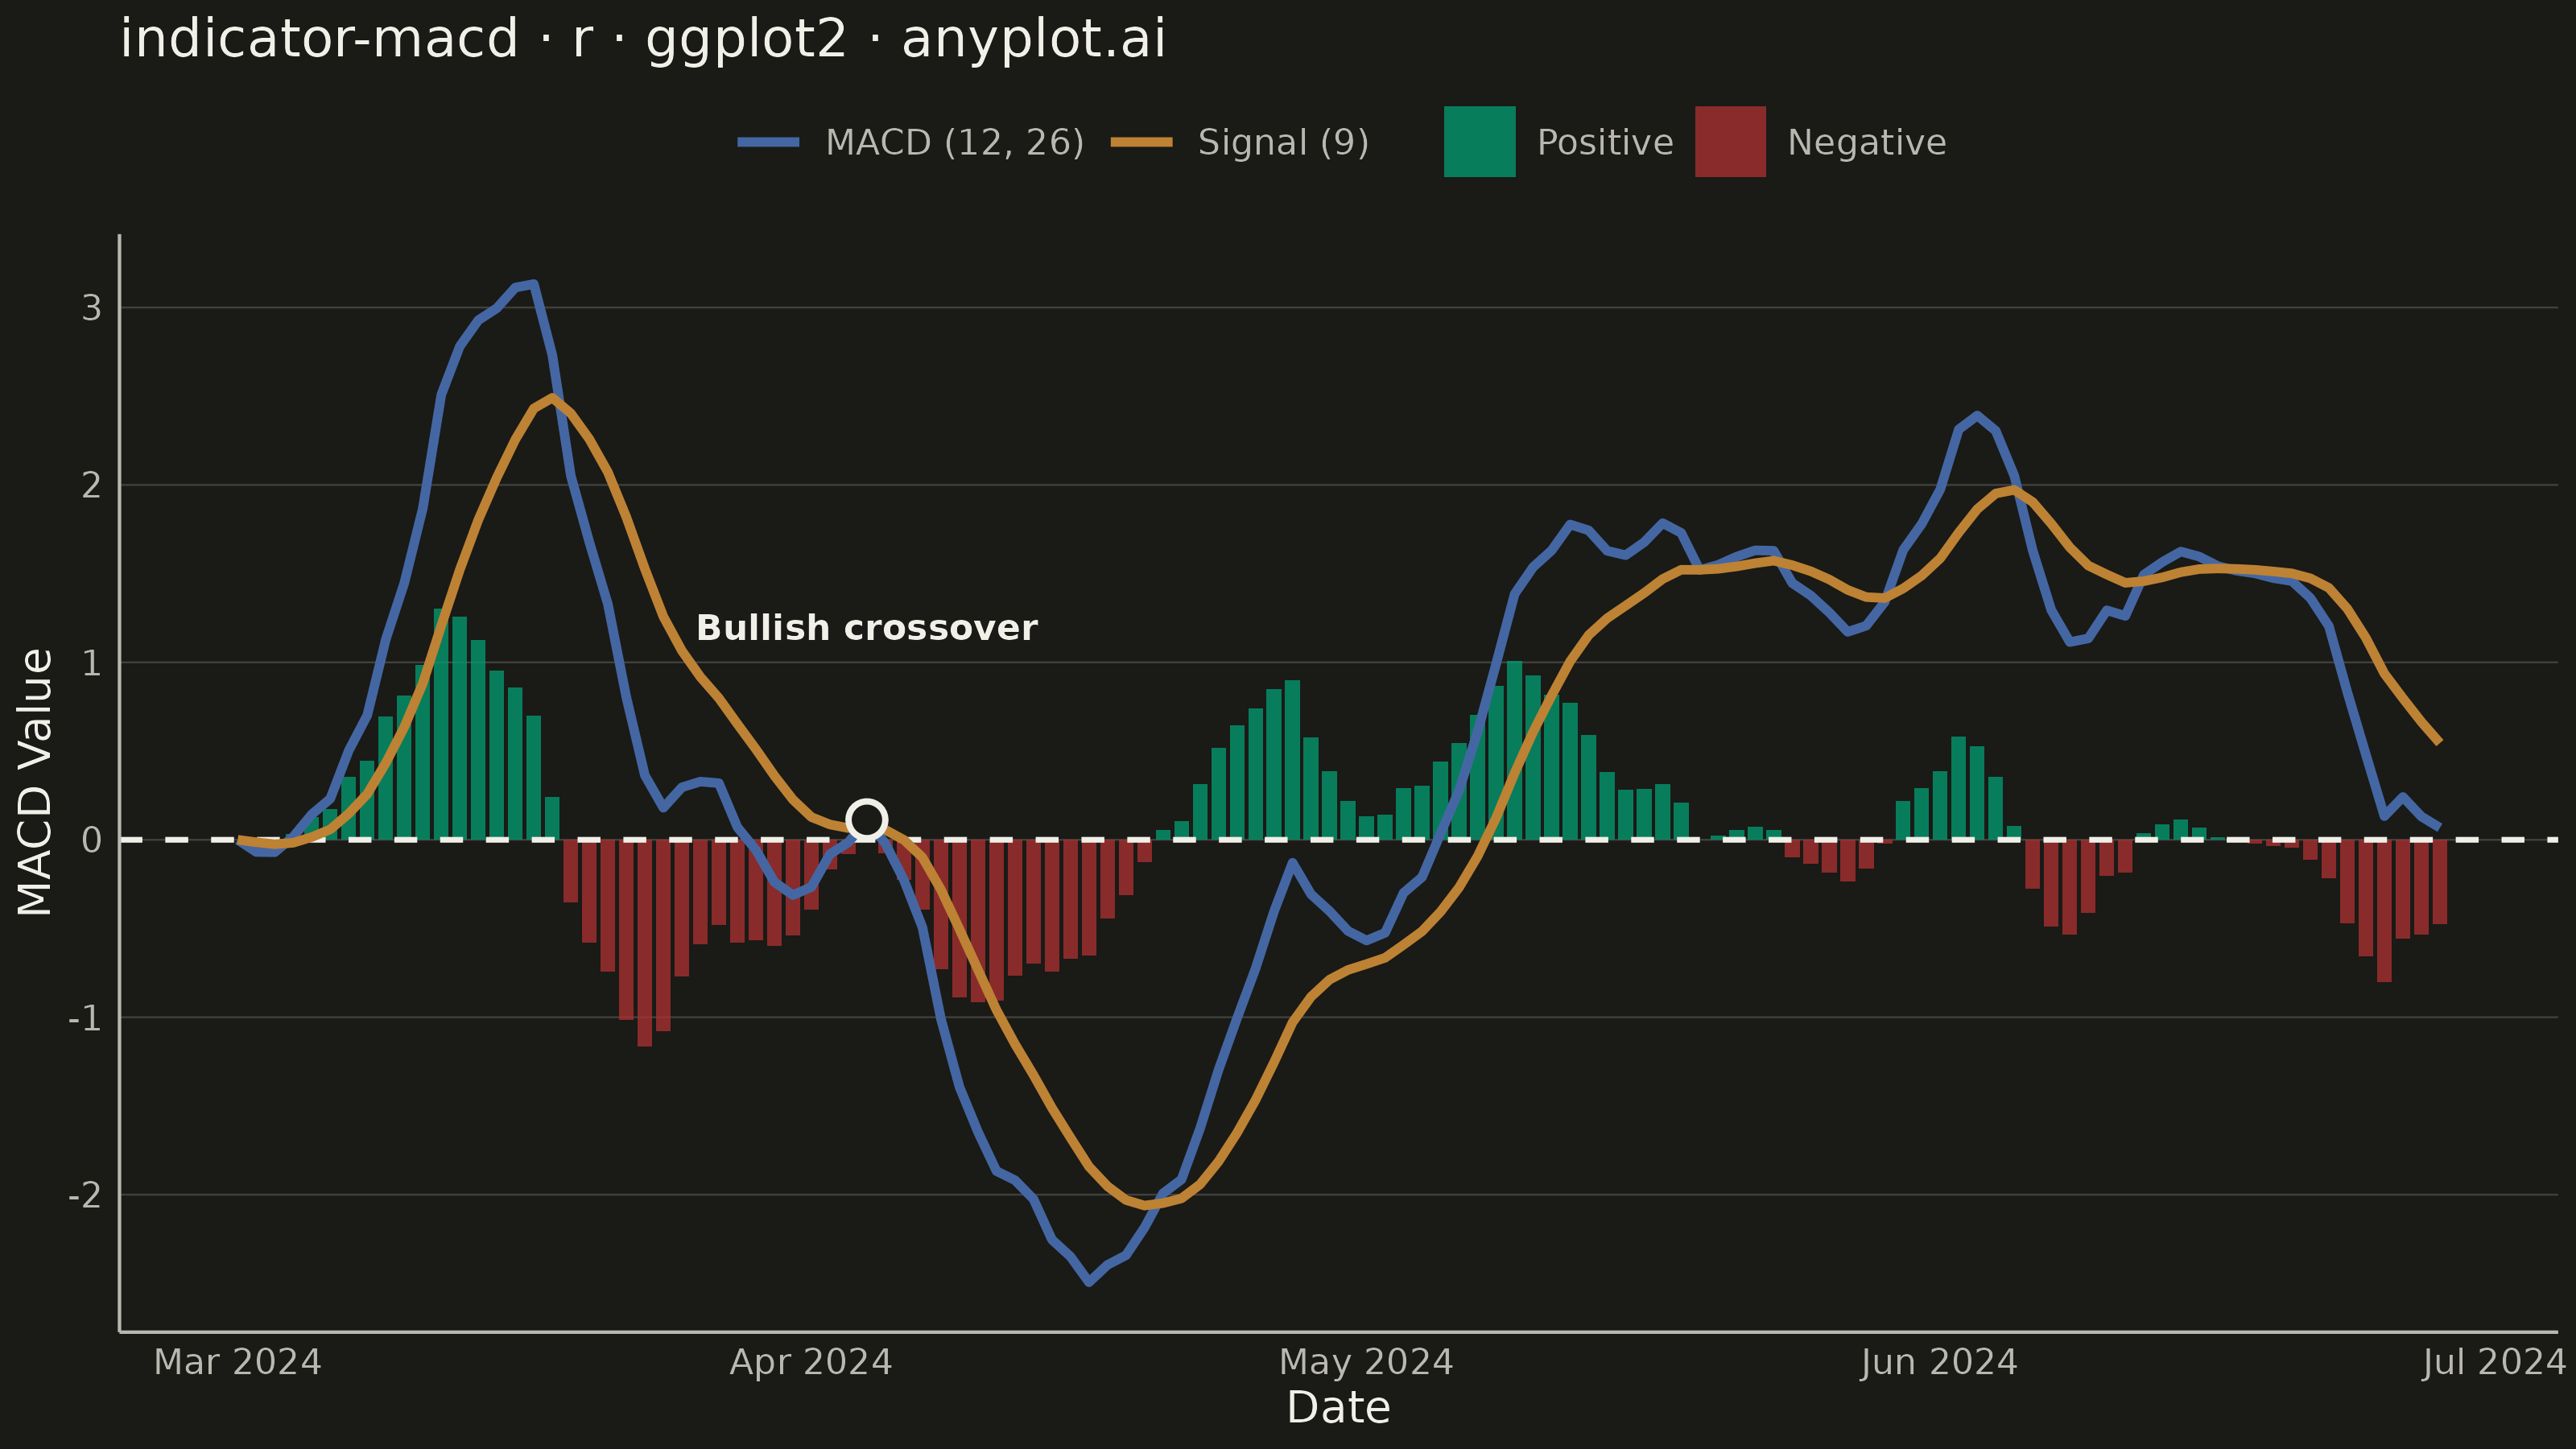
A MACD (Moving Average Convergence Divergence) chart displaying three components: the MACD line, signal line, and histogram. The MACD line represents the difference between 12-day and 26-day exponential moving averages, while the signal line is a 9-day EMA of the MACD. The histogram visualizes the difference between these two lines. This is an essential momentum oscillator for technical analysis, helping traders identify trend direction, momentum strength, and potential buy/sell signals through line crossovers.
#' anyplot.ai
#' indicator-macd: MACD Technical Indicator Chart
#' Library: ggplot2 3.5.1 | R 4.4.1
#' Quality: 89/100 | Created: 2026-09-05

library(ggplot2)
library(ragg)

set.seed(42)

# --- Theme tokens -------------------------------------------------------------
THEME    <- Sys.getenv("ANYPLOT_THEME", "light")
PAGE_BG  <- if (THEME == "light") "#FAF8F1" else "#1A1A17"
INK      <- if (THEME == "light") "#1A1A17" else "#F0EFE8"
INK_SOFT <- if (THEME == "light") "#4A4A44" else "#B8B7B0"
GRID_FAINT <- grDevices::adjustcolor(INK, alpha.f = 0.18)  # ggplot2 has no grid alpha; bake it into the color

GAIN <- "#009E73"  # Imprint brand green — semantic: histogram above zero
LOSS <- "#AE3030"  # Imprint matte red   — semantic: histogram below zero
MACD_COLOR   <- "#4467A3"  # Imprint blue
SIGNAL_COLOR <- "#BD8233"  # Imprint ochre

# --- Data ----------------------------------------------------------------------
n_days <- 120
dates <- seq(as.Date("2024-03-01"), by = "day", length.out = n_days)

daily_return <- rnorm(n_days, mean = 0.0006, sd = 0.016)
close_price <- 100 * cumprod(1 + daily_return)

ema <- function(x, span) {
  alpha <- 2 / (span + 1)
  out <- numeric(length(x))
  out[1] <- x[1]
  for (i in 2:length(x)) {
    out[i] <- alpha * x[i] + (1 - alpha) * out[i - 1]
  }
  out
}

ema_fast <- ema(close_price, 12)
ema_slow <- ema(close_price, 26)
macd_line <- ema_fast - ema_slow
signal_line <- ema(macd_line, 9)
histogram <- macd_line - signal_line

macd_df <- tibble::tibble(
  date      = dates,
  macd      = macd_line,
  signal    = signal_line,
  histogram = histogram,
  hist_sign = factor(
    ifelse(histogram >= 0, "Positive", "Negative"),
    levels = c("Positive", "Negative")
  )
)

lines_df <- tibble::tibble(
  date  = rep(dates, 2),
  value = c(macd_line, signal_line),
  line  = rep(c("MACD (12, 26)", "Signal (9)"), each = n_days)
)

# Highlight the first clear MACD/signal crossover after the EMA warm-up
# window so the chart's core "signal moment" is called out explicitly.
cross_idx <- which(diff(sign(histogram)) != 0) + 1
cross_idx <- cross_idx[cross_idx > 30]
highlight_idx <- cross_idx[1]
is_bullish <- histogram[highlight_idx] > 0
cross_label <- if (is_bullish) "Bullish crossover" else "Bearish crossover"
cross_date  <- dates[highlight_idx]
cross_value <- macd_line[highlight_idx]
label_offset <- diff(range(c(macd_line, signal_line))) * 0.18
label_y <- if (is_bullish) cross_value + label_offset else cross_value - label_offset
label_vjust <- if (is_bullish) 0 else 1

# --- Plot ------------------------------------------------------------------
title_text <- "indicator-macd · r · ggplot2 · anyplot.ai"

p <- ggplot() +
  geom_col(
    data = macd_df,
    aes(x = date, y = histogram, fill = hist_sign),
    width = 0.8, alpha = 0.75
  ) +
  geom_hline(yintercept = 0, color = INK, linewidth = 0.6, linetype = "dashed") +
  geom_line(
    data = lines_df,
    aes(x = date, y = value, color = line),
    linewidth = 1.0
  ) +
  annotate(
    "point", x = cross_date, y = cross_value,
    shape = 21, size = 3.2, fill = PAGE_BG, color = INK, stroke = 1
  ) +
  annotate(
    "text", x = cross_date, y = label_y, label = cross_label,
    color = INK, size = 2.8, vjust = label_vjust, fontface = "bold"
  ) +
  scale_fill_manual(values = c("Positive" = GAIN, "Negative" = LOSS), name = NULL) +
  scale_color_manual(values = c("MACD (12, 26)" = MACD_COLOR, "Signal (9)" = SIGNAL_COLOR), name = NULL) +
  scale_x_date(date_labels = "%b %Y") +
  labs(
    title = title_text,
    x = "Date",
    y = "MACD Value"
  ) +
  theme_minimal(base_size = 8) +
  theme(
    plot.background   = element_rect(fill = PAGE_BG, color = PAGE_BG),
    panel.background  = element_rect(fill = PAGE_BG, color = NA),
    panel.grid.major.x = element_blank(),
    panel.grid.minor.x = element_blank(),
    panel.grid.minor.y = element_blank(),
    panel.grid.major.y = element_line(color = GRID_FAINT, linewidth = 0.2),
    axis.title        = element_text(color = INK,      size = 10),
    axis.text         = element_text(color = INK_SOFT, size = 8),
    axis.line         = element_line(color = INK_SOFT),
    plot.title        = element_text(color = INK, size = 12),
    legend.position   = "top",
    legend.text       = element_text(color = INK_SOFT, size = 8),
    legend.key        = element_rect(fill = PAGE_BG, color = NA)
  )

# --- Save --------------------------------------------------------------------
ggsave(
  filename = sprintf("plot-%s.png", THEME),
  plot     = p,
  device   = ragg::agg_png,
  width    = 8,
  height   = 4.5,
  units    = "in",
  dpi      = 400
)
Runnable source as JSON, for any HTTP client: https://api.anyplot.ai/specs/indicator-macd/ggplot2/code. Any spec id and library id listed in llms-full.txt fit the same URL shape; every URL below is complete and callable.
{
  "spec_id": "indicator-macd",
  "language": "r",
  "library": "ggplot2",
  "page": "https://anyplot.ai/indicator-macd/r/ggplot2",
  "hub": "https://anyplot.ai/indicator-macd",
  "code_json": "https://api.anyplot.ai/specs/indicator-macd/ggplot2/code",
  "spec_json": "https://api.anyplot.ai/specs/indicator-macd",
  "render_light_png": "https://storage.googleapis.com/anyplot-images/plots/indicator-macd/r/ggplot2/plot-light.png",
  "render_dark_png": "https://storage.googleapis.com/anyplot-images/plots/indicator-macd/r/ggplot2/plot-dark.png",
  "quality_score": 89.0,
  "license": "MIT",
  "guide": "https://anyplot.ai/llms.txt"
}
Part of MACD Technical Indicator Chart on anyplot.ai.