The same plot in 14 other libraries — JavaScript: Chart.js, D3.js, Apache ECharts, Highcharts; Python: Altair, Bokeh, lets-plot, Matplotlib, Plotly, plotnine, Pygal, Seaborn; R: ggplot2; Julia: Makie.jl. Compare all 15 side by side: MACD Technical Indicator Chart in Python, R, Julia and JavaScript.
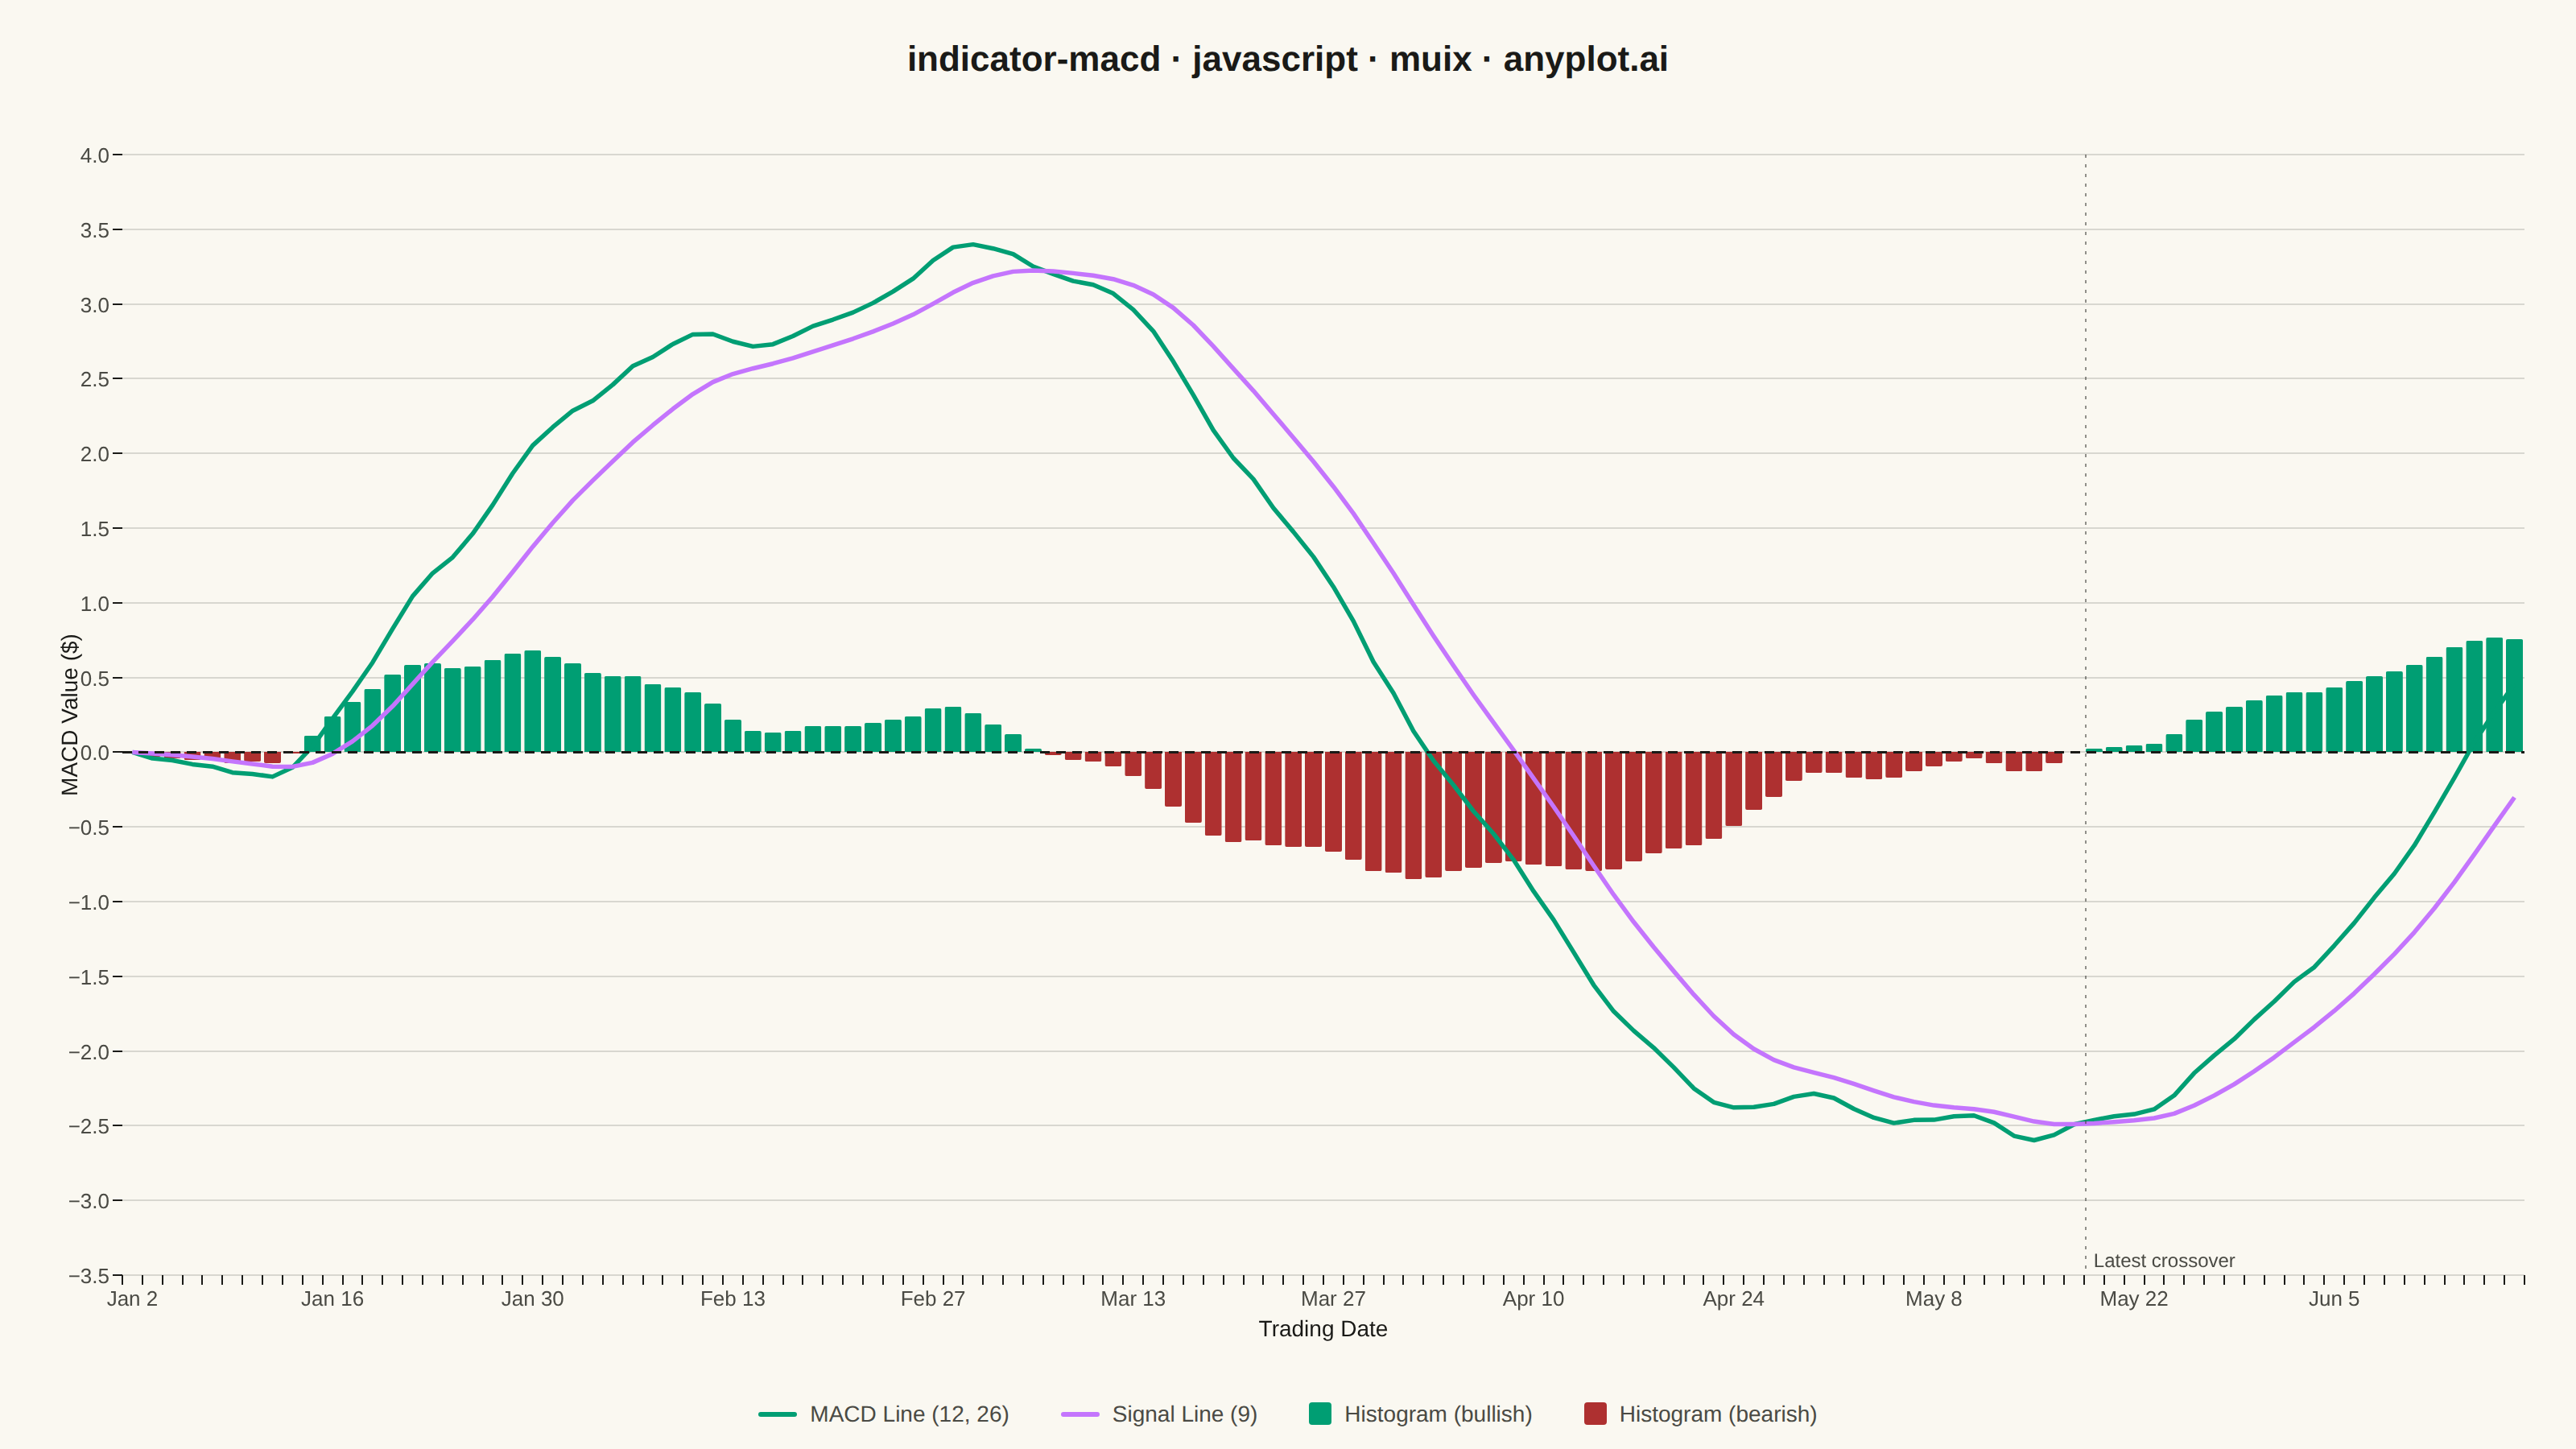
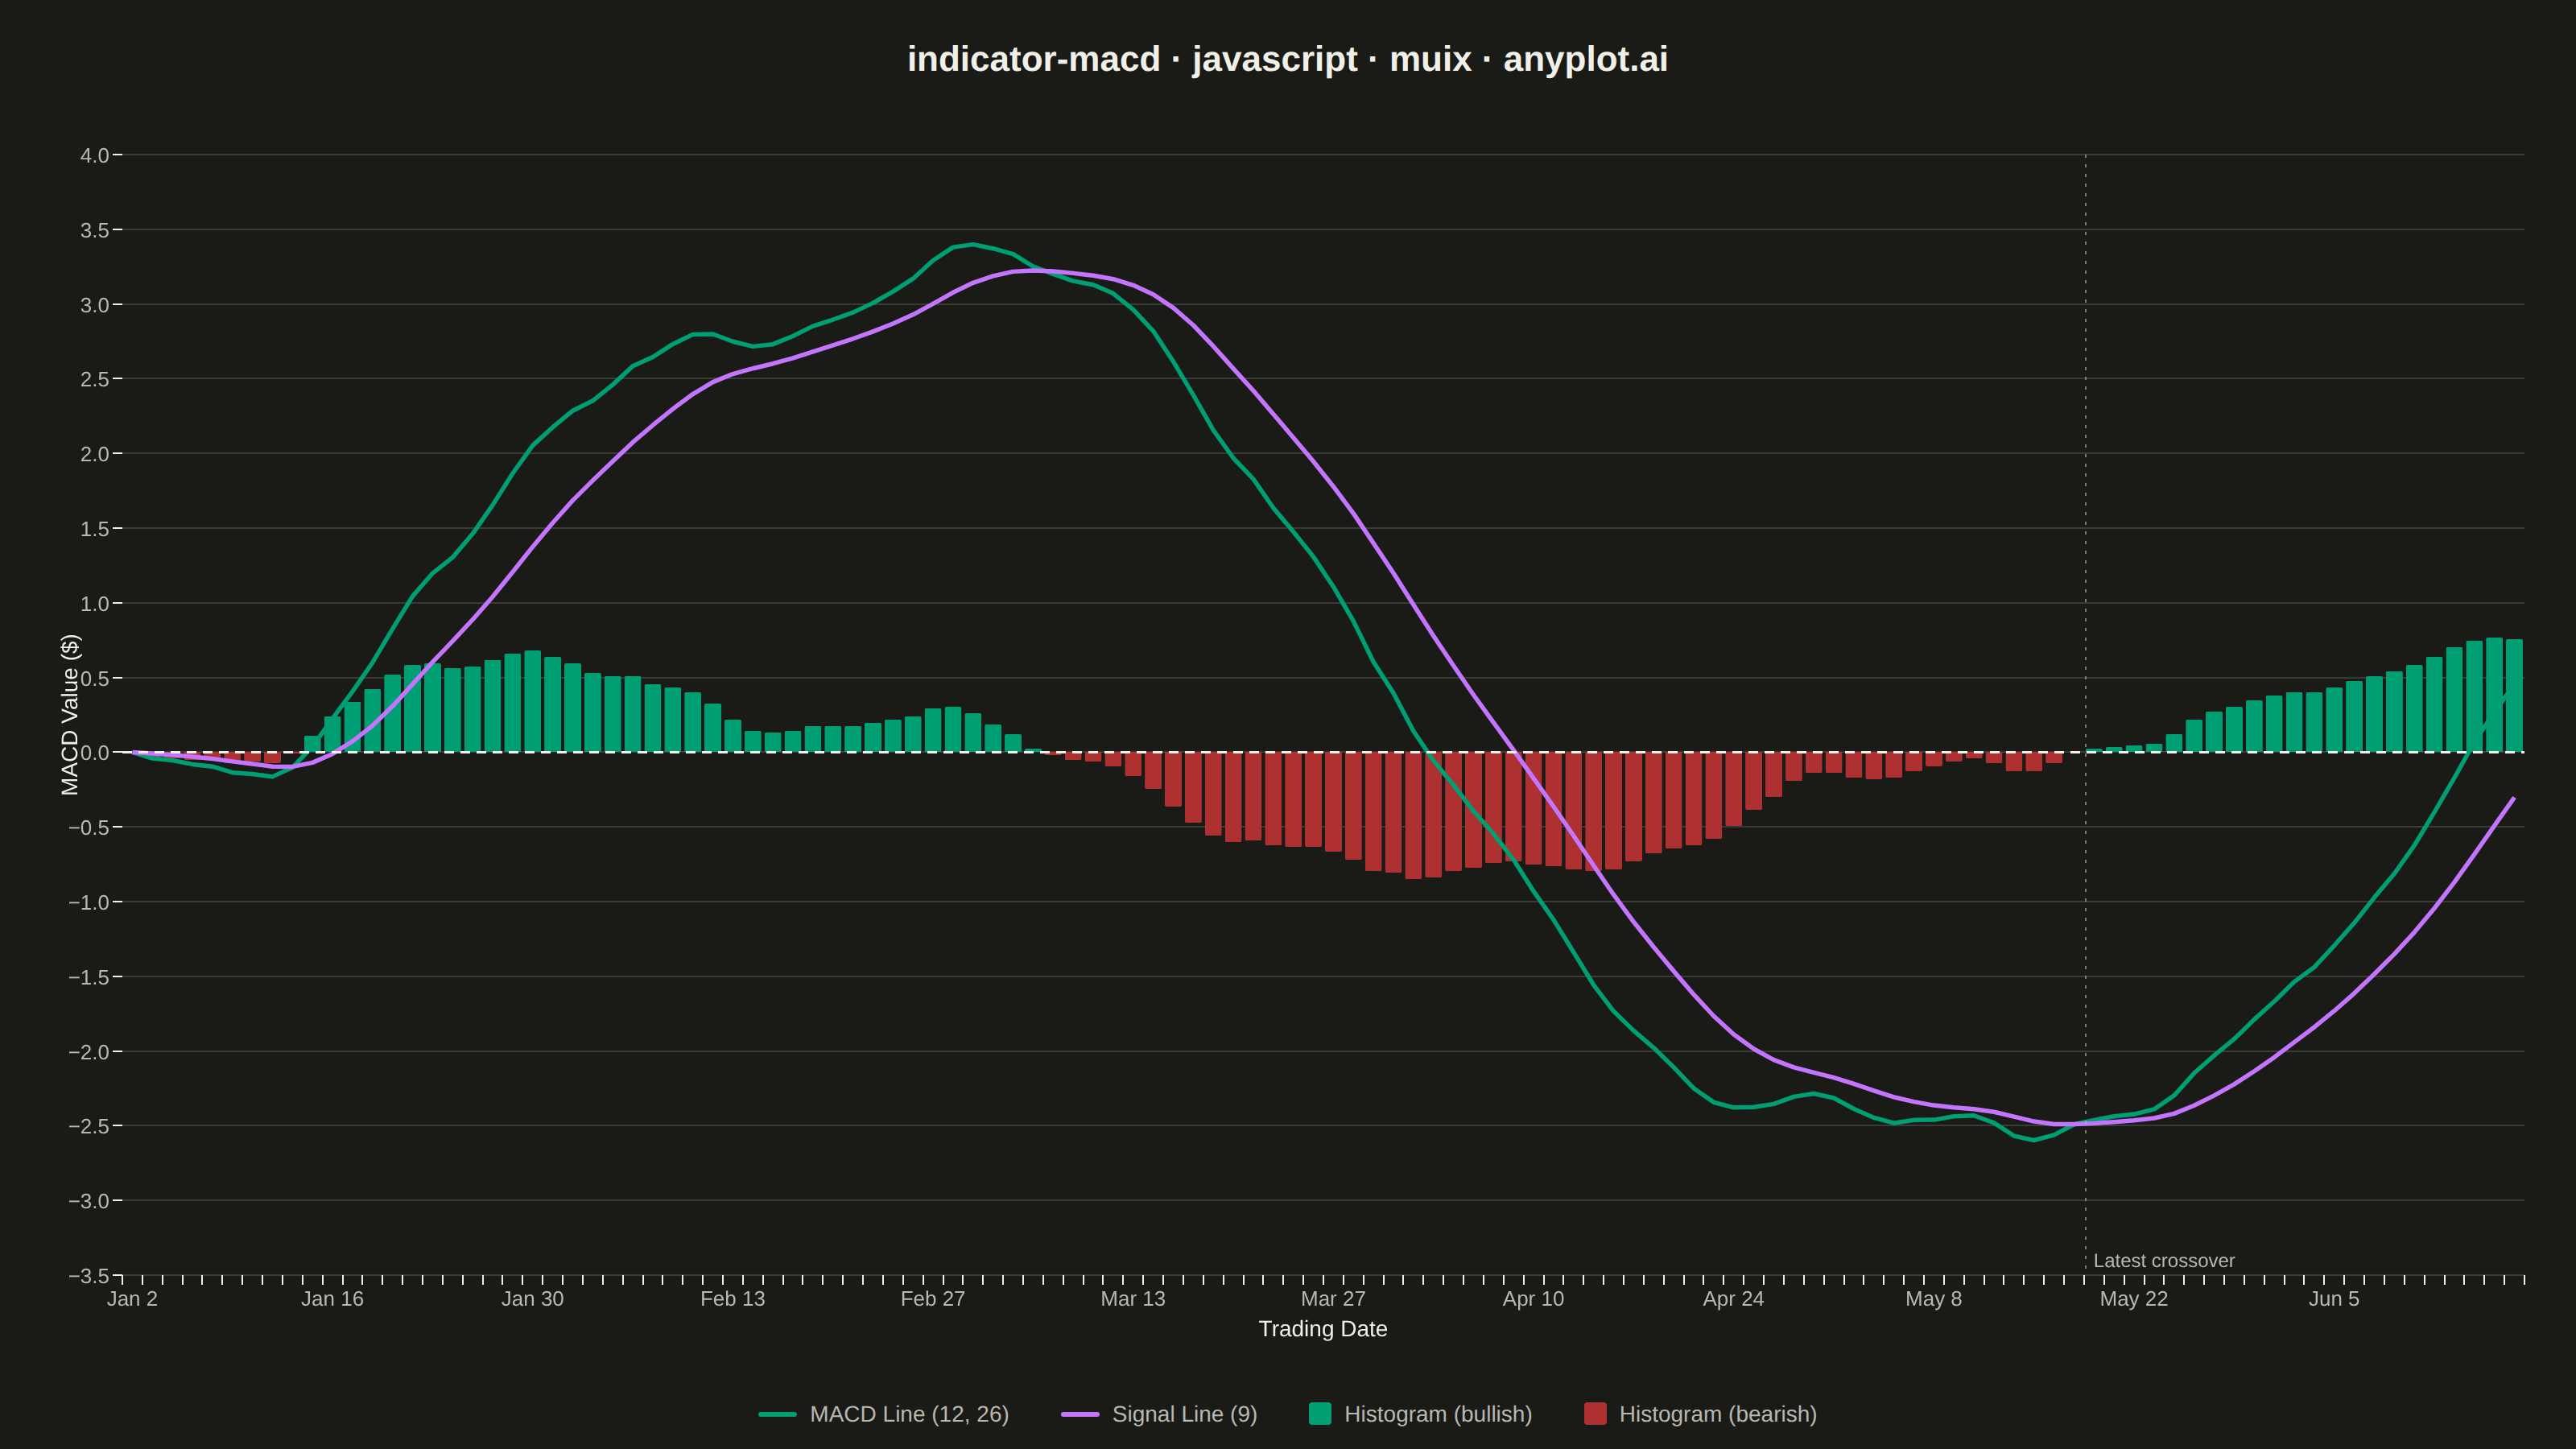
A MACD (Moving Average Convergence Divergence) chart displaying three components: the MACD line, signal line, and histogram. The MACD line represents the difference between 12-day and 26-day exponential moving averages, while the signal line is a 9-day EMA of the MACD. The histogram visualizes the difference between these two lines. This is an essential momentum oscillator for technical analysis, helping traders identify trend direction, momentum strength, and potential buy/sell signals through line crossovers.
// anyplot.ai
// indicator-macd: MACD Technical Indicator Chart
// Library: muix 7.29.1 | JavaScript 22.23.2
// Quality: 93/100 | Created: 2026-09-05

import { ChartContainer } from "@mui/x-charts/ChartContainer";
import { BarPlot } from "@mui/x-charts/BarChart";
import { LinePlot } from "@mui/x-charts/LineChart";
import { ChartsXAxis } from "@mui/x-charts/ChartsXAxis";
import { ChartsYAxis } from "@mui/x-charts/ChartsYAxis";
import { ChartsGrid } from "@mui/x-charts/ChartsGrid";
import { ChartsReferenceLine } from "@mui/x-charts/ChartsReferenceLine";
import { ChartsTooltip } from "@mui/x-charts/ChartsTooltip";
import Box from "@mui/material/Box";
import Typography from "@mui/material/Typography";

const t = window.ANYPLOT_TOKENS;

// --- Data: 120 trading days of a synthetic closing price, MACD(12,26,9) ------
const PERIODS = 120;

// Tiny fixed-seed LCG — the browser has no seeded Math.random().
function lcg(seed) {
  let state = seed;
  return () => {
    state = (state * 1664525 + 1013904223) % 4294967296;
    return state / 4294967296;
  };
}
const rand = lcg(42);

// Business-day dates starting Jan 2, 2025.
const dates = [];
const cursor = new Date(Date.UTC(2025, 0, 2));
while (dates.length < PERIODS) {
  const weekday = cursor.getUTCDay();
  if (weekday !== 0 && weekday !== 6) {
    dates.push(new Date(cursor));
  }
  cursor.setUTCDate(cursor.getUTCDate() + 1);
}
const dateFormatter = new Intl.DateTimeFormat("en-US", { month: "short", day: "numeric", timeZone: "UTC" });
const dateLabels = dates.map((d) => dateFormatter.format(d));

// Closing price: slow oscillation (trend reversals) + noise, so MACD crosses over several times.
const closes = [];
let price = 148;
for (let i = 0; i < PERIODS; i++) {
  const trend = 0.55 * Math.sin(i / 16) + 0.15 * Math.sin(i / 5.5);
  const noise = (rand() - 0.5) * 1.4;
  price += trend + noise;
  closes.push(price);
}

function ema(values, period) {
  const k = 2 / (period + 1);
  const out = [values[0]];
  for (let i = 1; i < values.length; i++) {
    out.push(values[i] * k + out[i - 1] * (1 - k));
  }
  return out;
}

const ema12 = ema(closes, 12);
const ema26 = ema(closes, 26);
const macdLine = ema12.map((v, i) => v - ema26[i]);
const signalLine = ema(macdLine, 9);
const histogram = macdLine.map((v, i) => parseFloat((v - signalLine[i]).toFixed(3)));

// Most recent sign flip in the histogram = the latest MACD/signal crossover,
// called out on the chart as a lightweight annotation.
let lastCrossoverIndex = null;
for (let i = 1; i < histogram.length; i++) {
  if (Math.sign(histogram[i]) !== 0 && Math.sign(histogram[i]) !== Math.sign(histogram[i - 1])) {
    lastCrossoverIndex = i;
  }
}

// Shared numeric domain for both y-axes so histogram bars and lines stay on
// the same visual scale (a colorMap-carrying axis can't also carry the lines'
// explicit series colors — see the dedicated "value-hist" axis below).
const allValues = [...macdLine, ...signalLine, ...histogram];
const rawMax = Math.max(...allValues);
const rawMin = Math.min(...allValues);
const pad = (rawMax - rawMin) * 0.08;
const Y_MAX = Math.ceil((rawMax + pad) * 2) / 2;
const Y_MIN = Math.floor((rawMin - pad) * 2) / 2;

const MARGIN = { top: 24, right: 32, bottom: 64, left: 76 };

export default function Chart() {
  const W = window.ANYPLOT_SIZE.width; // 1600 CSS px (landscape)
  const H = window.ANYPLOT_SIZE.height; // 900 CSS px
  const TITLE_H = 72;
  const LEGEND_H = 44;
  const chartH = H - TITLE_H - LEGEND_H;

  return (
    <Box
      sx={{
        width: W,
        height: H,
        bgcolor: t.pageBg,
        display: "flex",
        flexDirection: "column",
        fontFamily: "'Roboto', 'Helvetica Neue', Arial, sans-serif",
        boxSizing: "border-box",
      }}
    >
      {/* Title */}
      <Box sx={{ height: TITLE_H, display: "flex", alignItems: "center", justifyContent: "center" }}>
        <Typography sx={{ color: t.ink, fontSize: 22, fontWeight: 600 }}>
          indicator-macd · javascript · muix · anyplot.ai
        </Typography>
      </Box>

      {/* Chart */}
      <ChartContainer
        width={W}
        height={chartH}
        series={[
          {
            type: "bar",
            id: "histogram",
            yAxisId: "value-hist",
            data: histogram,
            color: t.palette[4],
          },
          {
            type: "line",
            id: "macd",
            yAxisId: "value",
            data: macdLine,
            label: "MACD (12, 26)",
            color: t.palette[0],
            showMark: false,
            curve: "linear",
          },
          {
            type: "line",
            id: "signal",
            yAxisId: "value",
            data: signalLine,
            label: "Signal (9)",
            color: t.palette[1],
            showMark: false,
            curve: "linear",
          },
        ]}
        xAxis={[
          {
            id: "dates",
            scaleType: "band",
            data: dateLabels,
            categoryGapRatio: 0.15,
            tickLabelInterval: (_value, index) => index % 10 === 0,
            tickLabelStyle: { fontSize: 13, fill: t.inkSoft },
          },
        ]}
        yAxis={[
          {
            id: "value",
            min: Y_MIN,
            max: Y_MAX,
            tickLabelStyle: { fontSize: 13, fill: t.inkSoft },
          },
          {
            // Dedicated axis for the histogram only — a colorMap-carrying axis
            // overrides per-point colors for every series bound to it (lines
            // included), so it must stay separate from the MACD/Signal axis.
            id: "value-hist",
            min: Y_MIN,
            max: Y_MAX,
            colorMap: { type: "piecewise", thresholds: [0], colors: [t.palette[4], t.palette[0]] },
          },
        ]}
        margin={MARGIN}
        skipAnimation
        sx={{
          "& .MuiChartsGrid-line": { stroke: t.grid },
          "& .MuiLineElement-root": { strokeWidth: 2.75 },
        }}
      >
        <ChartsGrid horizontal />
        <BarPlot skipAnimation borderRadius={1} />
        <LinePlot skipAnimation />
        <ChartsReferenceLine
          y={0}
          axisId="value"
          lineStyle={{ stroke: t.ink, strokeDasharray: "6 4", strokeWidth: 1.5 }}
        />
        {lastCrossoverIndex !== null && (
          <ChartsReferenceLine
            x={dateLabels[lastCrossoverIndex]}
            axisId="dates"
            label="Latest crossover"
            labelAlign="end"
            labelStyle={{ fontSize: 12, fill: t.inkSoft }}
            lineStyle={{ stroke: t.inkSoft, strokeDasharray: "2 4", strokeOpacity: 0.6 }}
          />
        )}
        <ChartsXAxis
          axisId="dates"
          position="bottom"
          label="Trading Date"
          labelStyle={{ fontSize: 14, fill: t.ink }}
          disableLine
        />
        <ChartsYAxis
          axisId="value"
          position="left"
          label="MACD Value ($)"
          labelStyle={{ fontSize: 14, fill: t.ink }}
          disableLine
        />
        <ChartsTooltip trigger="axis" />
      </ChartContainer>

      {/* Legend */}
      <Box sx={{ height: LEGEND_H, display: "flex", alignItems: "center", justifyContent: "center", gap: "32px" }}>
        <Box sx={{ display: "flex", alignItems: "center", gap: "8px" }}>
          <Box sx={{ width: 24, height: 3, bgcolor: t.palette[0], borderRadius: "2px", flexShrink: 0 }} />
          <Typography sx={{ color: t.inkSoft, fontSize: 14 }}>MACD Line (12, 26)</Typography>
        </Box>
        <Box sx={{ display: "flex", alignItems: "center", gap: "8px" }}>
          <Box sx={{ width: 24, height: 3, bgcolor: t.palette[1], borderRadius: "2px", flexShrink: 0 }} />
          <Typography sx={{ color: t.inkSoft, fontSize: 14 }}>Signal Line (9)</Typography>
        </Box>
        <Box sx={{ display: "flex", alignItems: "center", gap: "8px" }}>
          <Box sx={{ width: 14, height: 14, bgcolor: t.palette[0], borderRadius: "2px", flexShrink: 0 }} />
          <Typography sx={{ color: t.inkSoft, fontSize: 14 }}>Histogram (bullish)</Typography>
        </Box>
        <Box sx={{ display: "flex", alignItems: "center", gap: "8px" }}>
          <Box sx={{ width: 14, height: 14, bgcolor: t.palette[4], borderRadius: "2px", flexShrink: 0 }} />
          <Typography sx={{ color: t.inkSoft, fontSize: 14 }}>Histogram (bearish)</Typography>
        </Box>
      </Box>
    </Box>
  );
}
Runnable source as JSON, for any HTTP client: https://api.anyplot.ai/specs/indicator-macd/muix/code. Any spec id and library id listed in llms-full.txt fit the same URL shape; every URL below is complete and callable.
{
  "spec_id": "indicator-macd",
  "language": "javascript",
  "library": "muix",
  "page": "https://anyplot.ai/indicator-macd/javascript/muix",
  "hub": "https://anyplot.ai/indicator-macd",
  "code_json": "https://api.anyplot.ai/specs/indicator-macd/muix/code",
  "spec_json": "https://api.anyplot.ai/specs/indicator-macd",
  "render_light_png": "https://storage.googleapis.com/anyplot-images/plots/indicator-macd/javascript/muix/plot-light.png",
  "render_dark_png": "https://storage.googleapis.com/anyplot-images/plots/indicator-macd/javascript/muix/plot-dark.png",
  "interactive_light_html": "https://storage.googleapis.com/anyplot-images/plots/indicator-macd/javascript/muix/plot-light.html",
  "interactive_dark_html": "https://storage.googleapis.com/anyplot-images/plots/indicator-macd/javascript/muix/plot-dark.html",
  "quality_score": 93.0,
  "license": "MIT",
  "guide": "https://anyplot.ai/llms.txt"
}
Part of MACD Technical Indicator Chart on anyplot.ai.