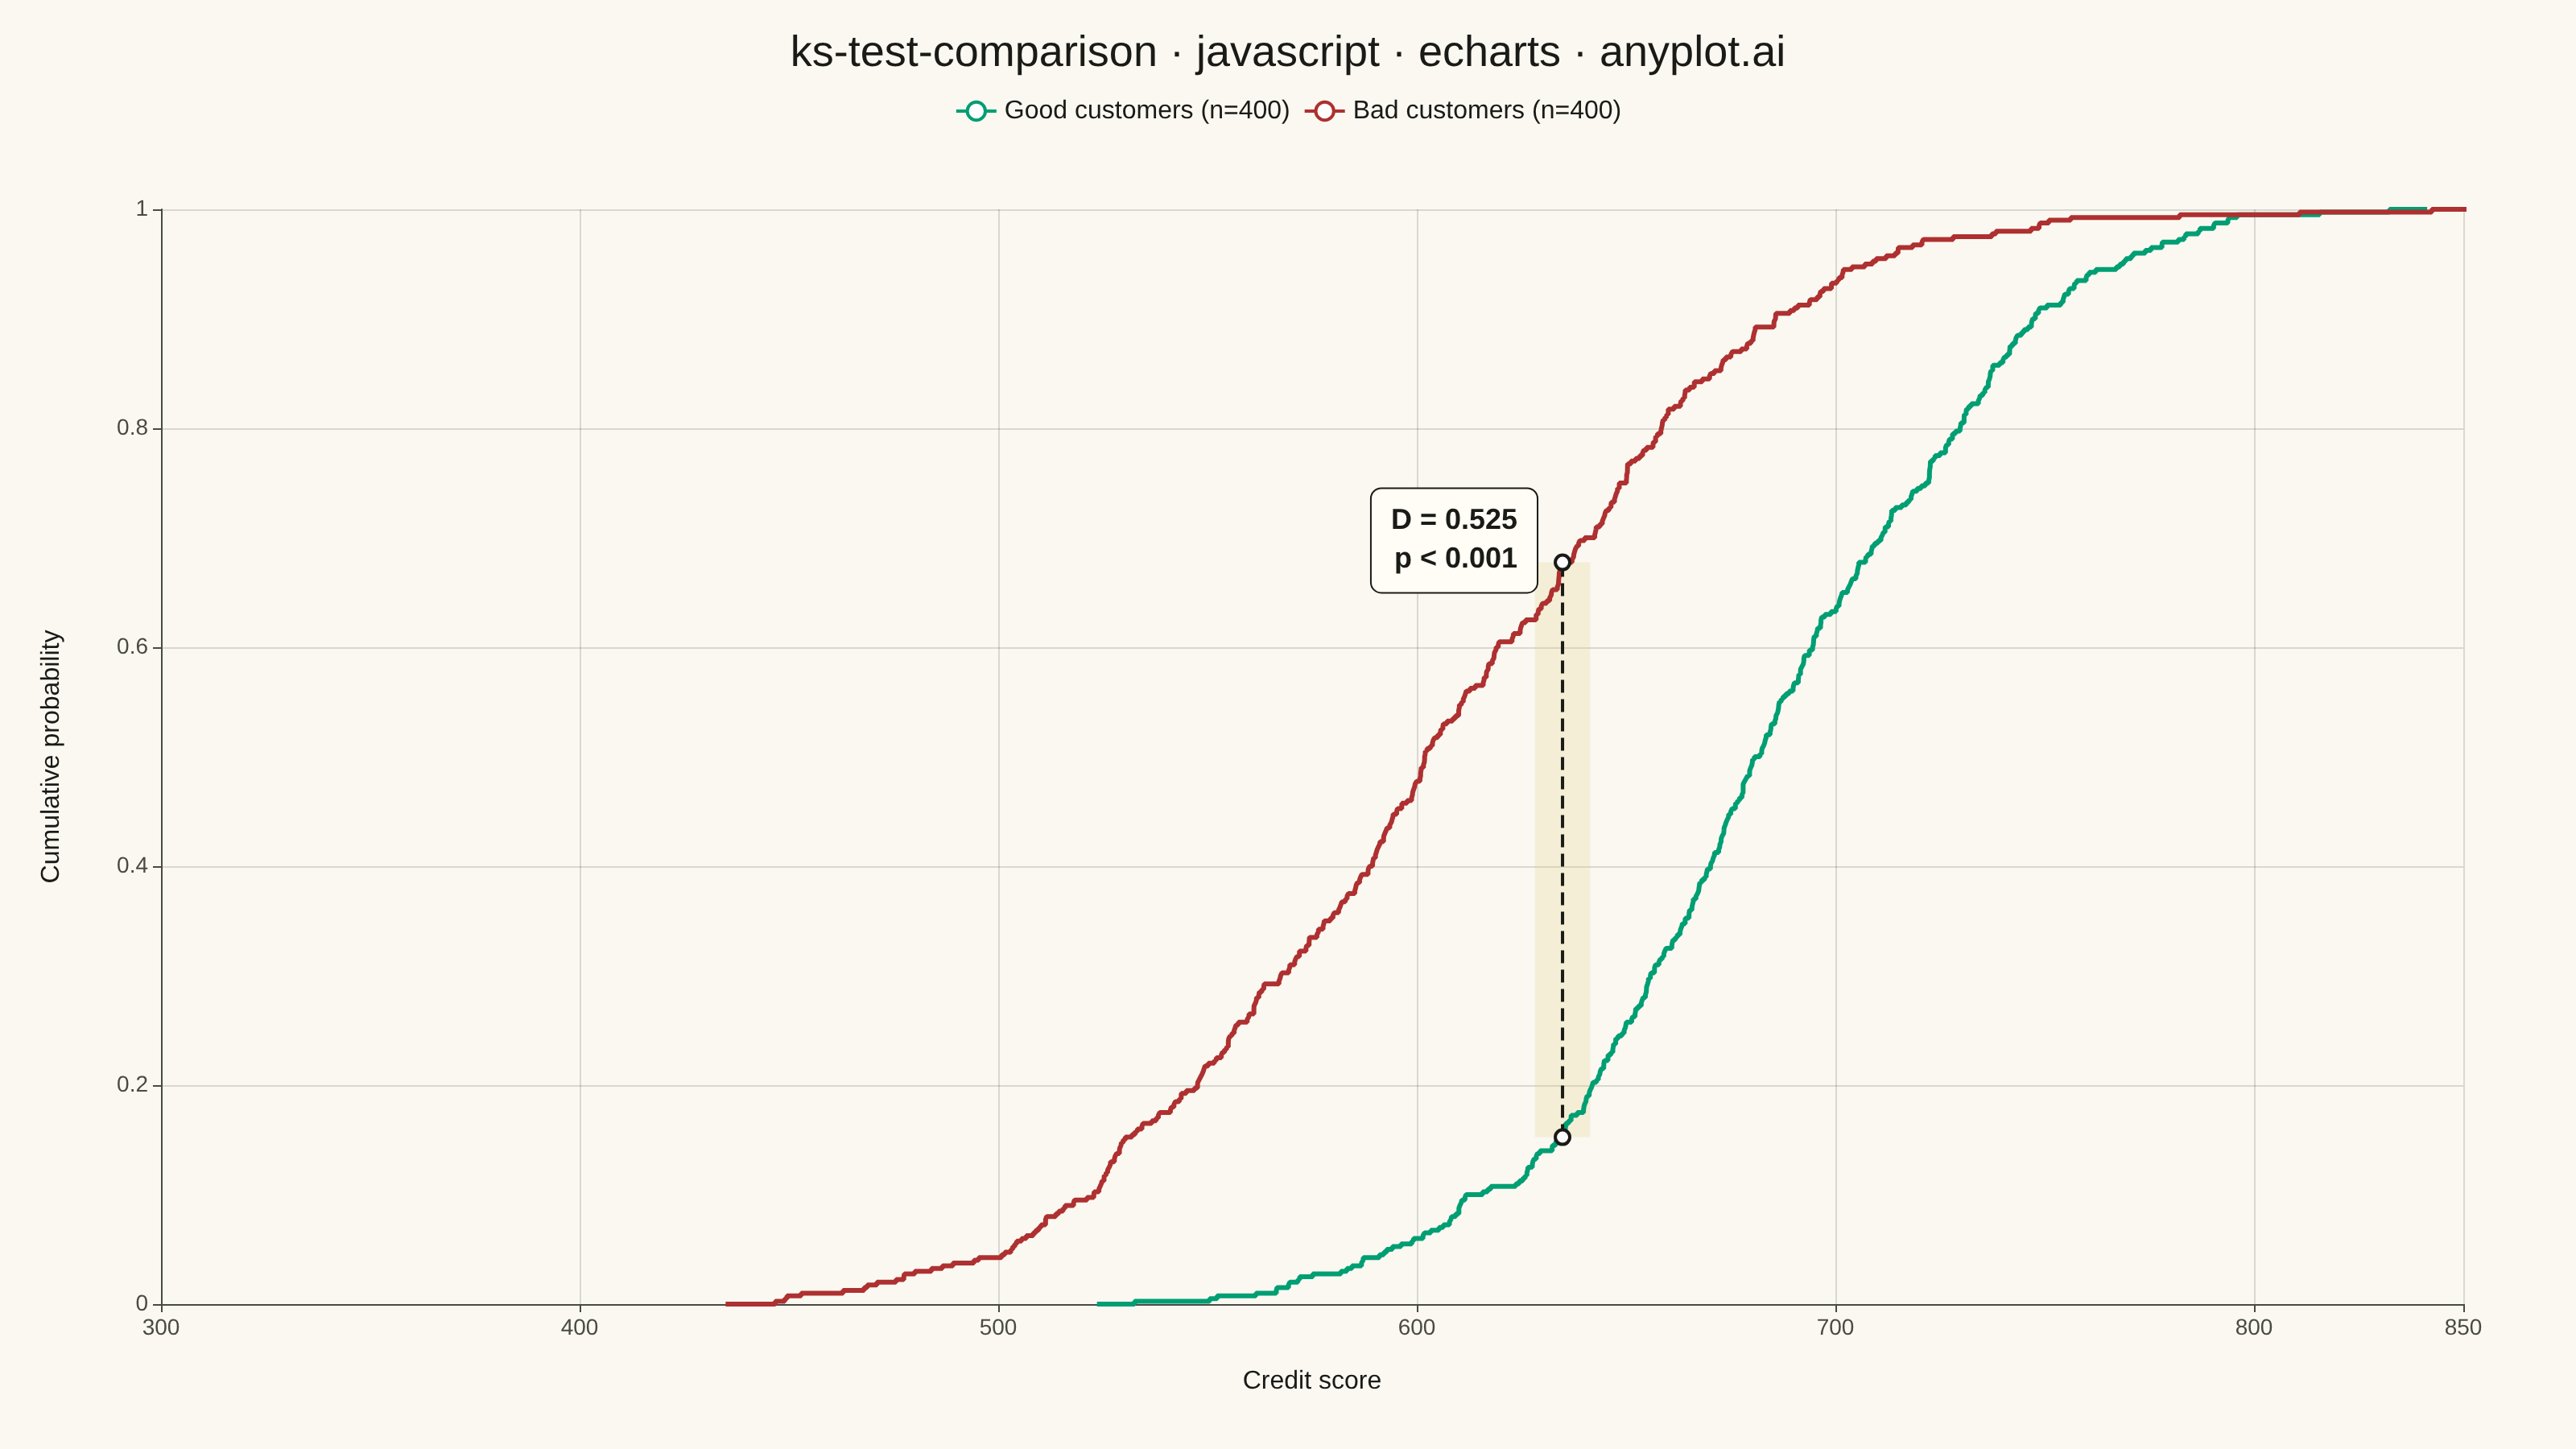
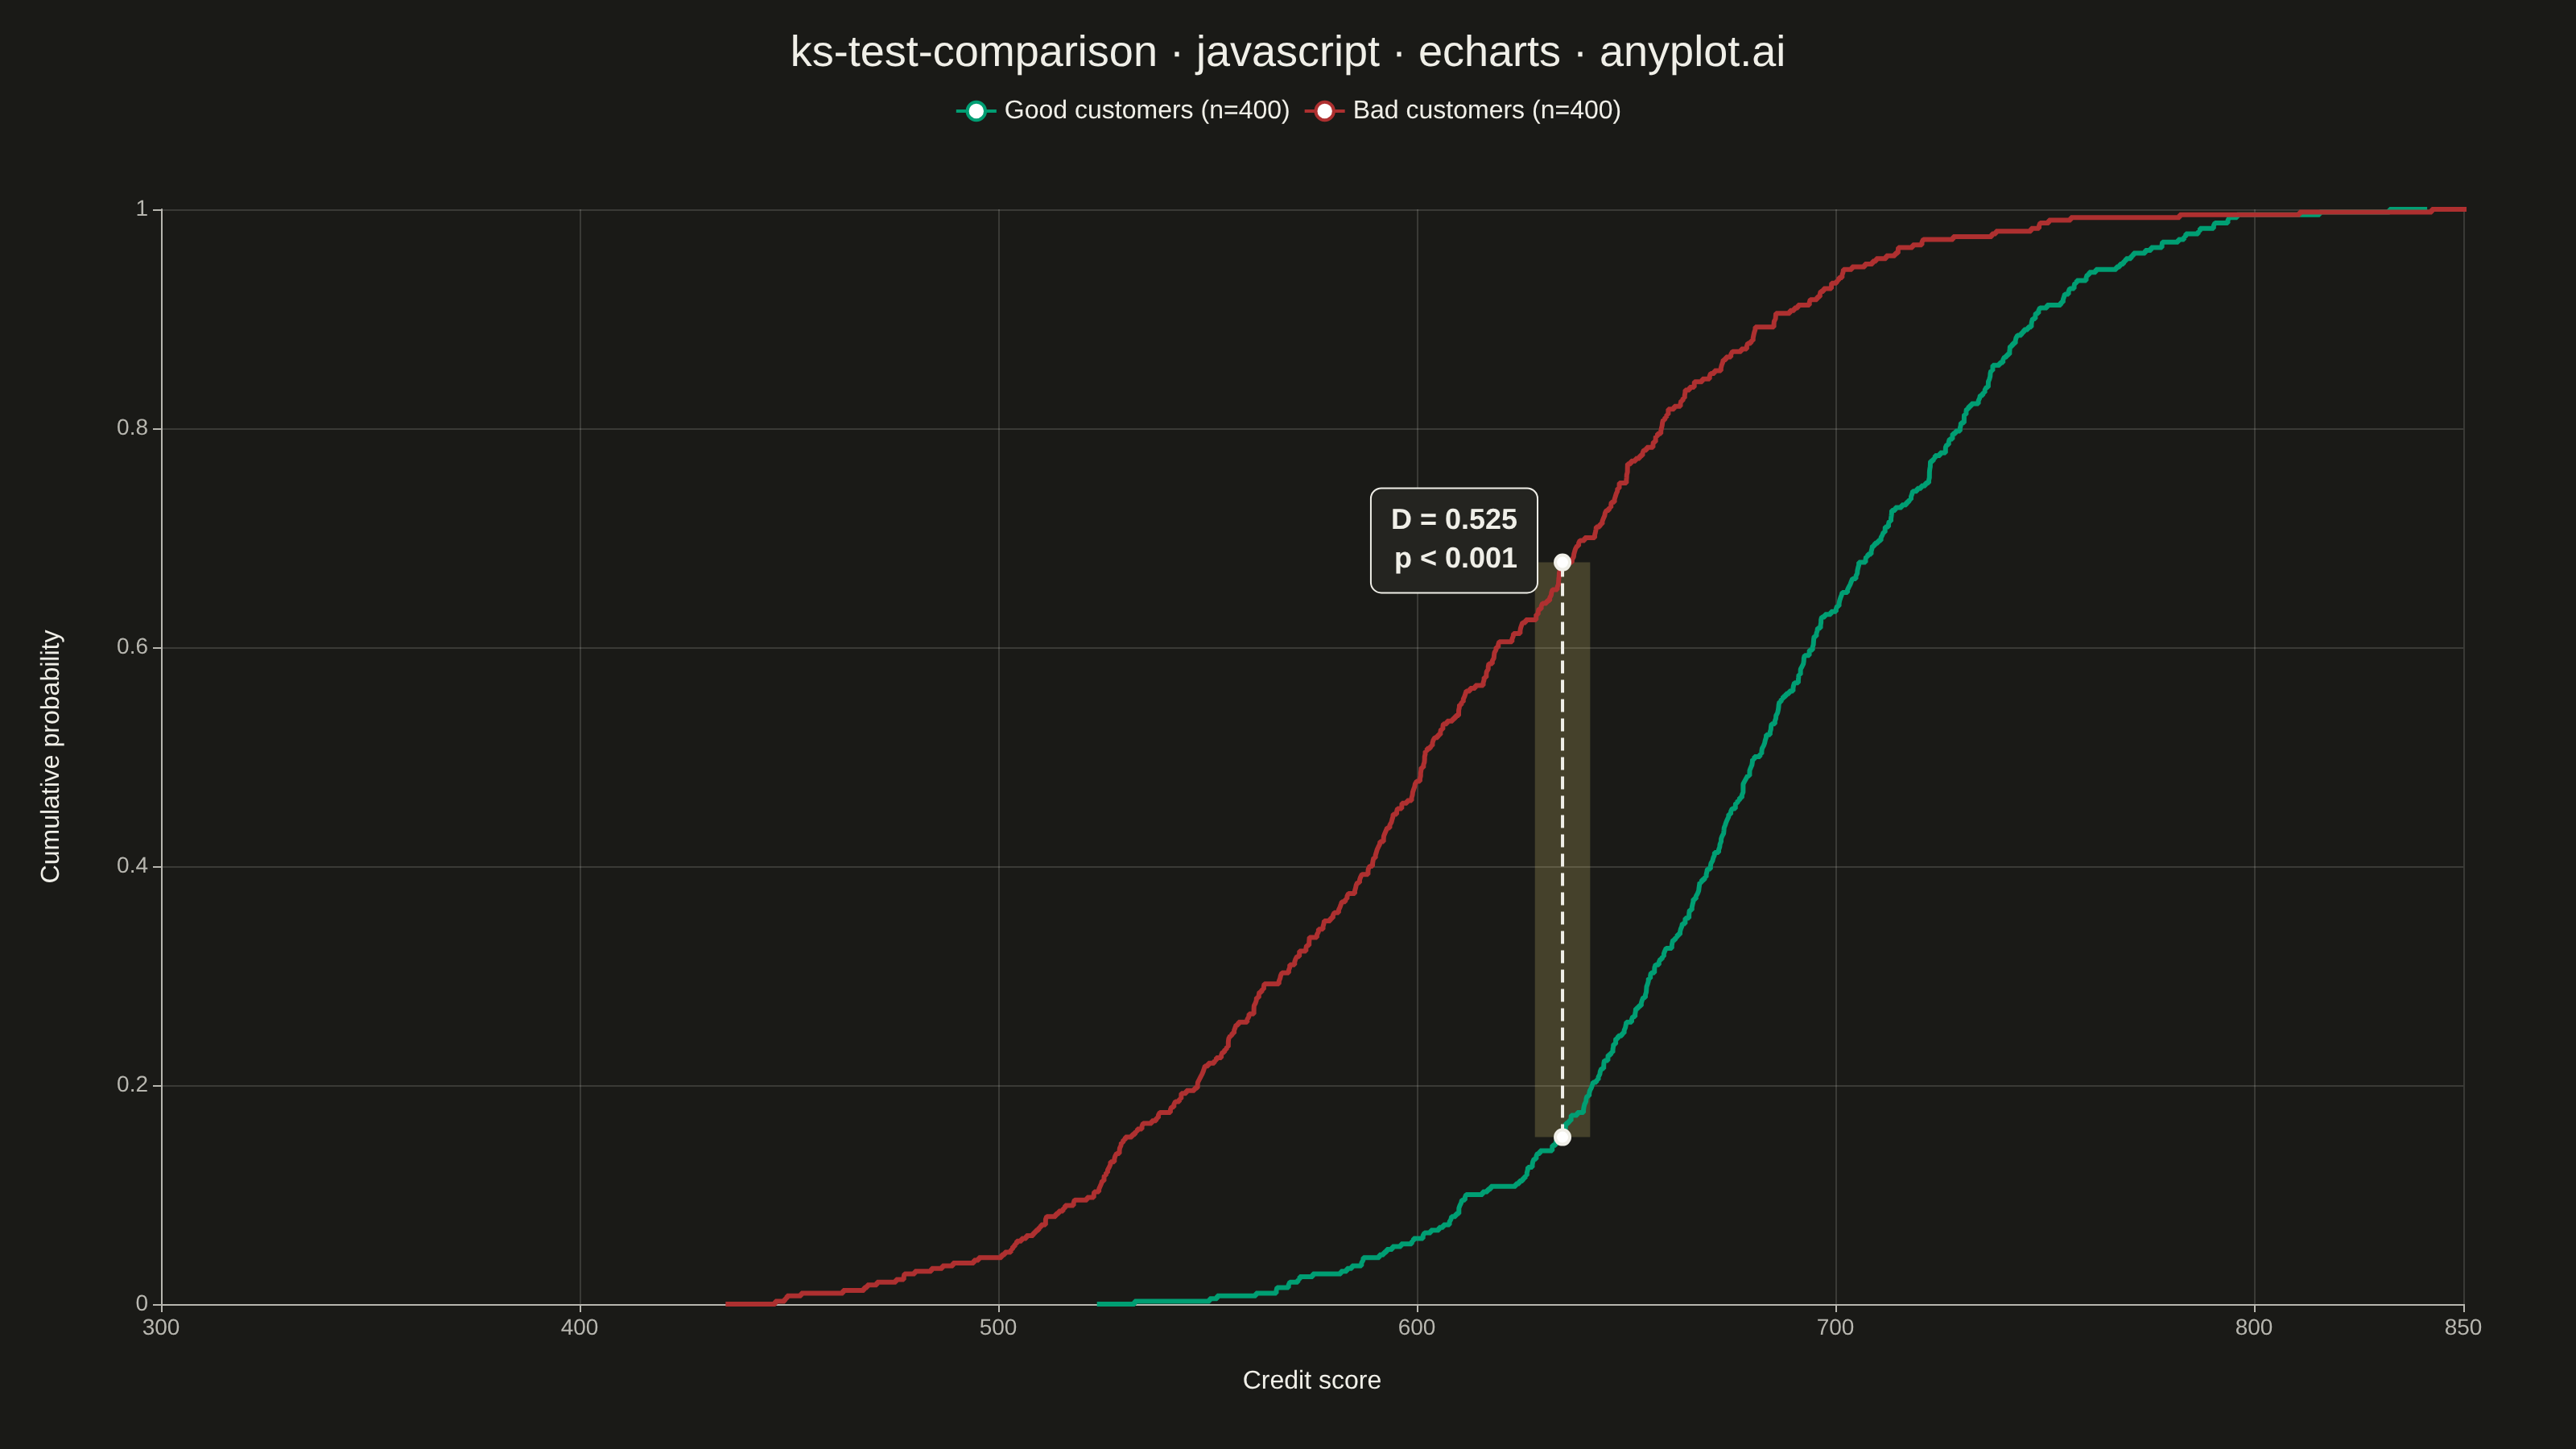
A Kolmogorov-Smirnov (K-S) plot compares two empirical cumulative distribution functions (ECDFs) and visualizes the K-S statistic, which is the maximum vertical distance between the two distributions. The plot displays both ECDFs as step functions, highlights the point of maximum divergence, and typically reports the K-S statistic value and p-value for hypothesis testing. This visualization is essential for determining whether two samples come from the same underlying distribution.
Preview render from the Apache ECharts implementation.