The same plot in 14 other libraries — JavaScript: Chart.js, D3.js, Highcharts, MUI X Charts; Python: Altair, Bokeh, lets-plot, Matplotlib, Plotly, plotnine, Pygal, Seaborn; R: ggplot2; Julia: Makie.jl. Compare all 15 side by side: Kolmogorov-Smirnov Plot for Distribution Comparison in Python, R, Julia and JavaScript.
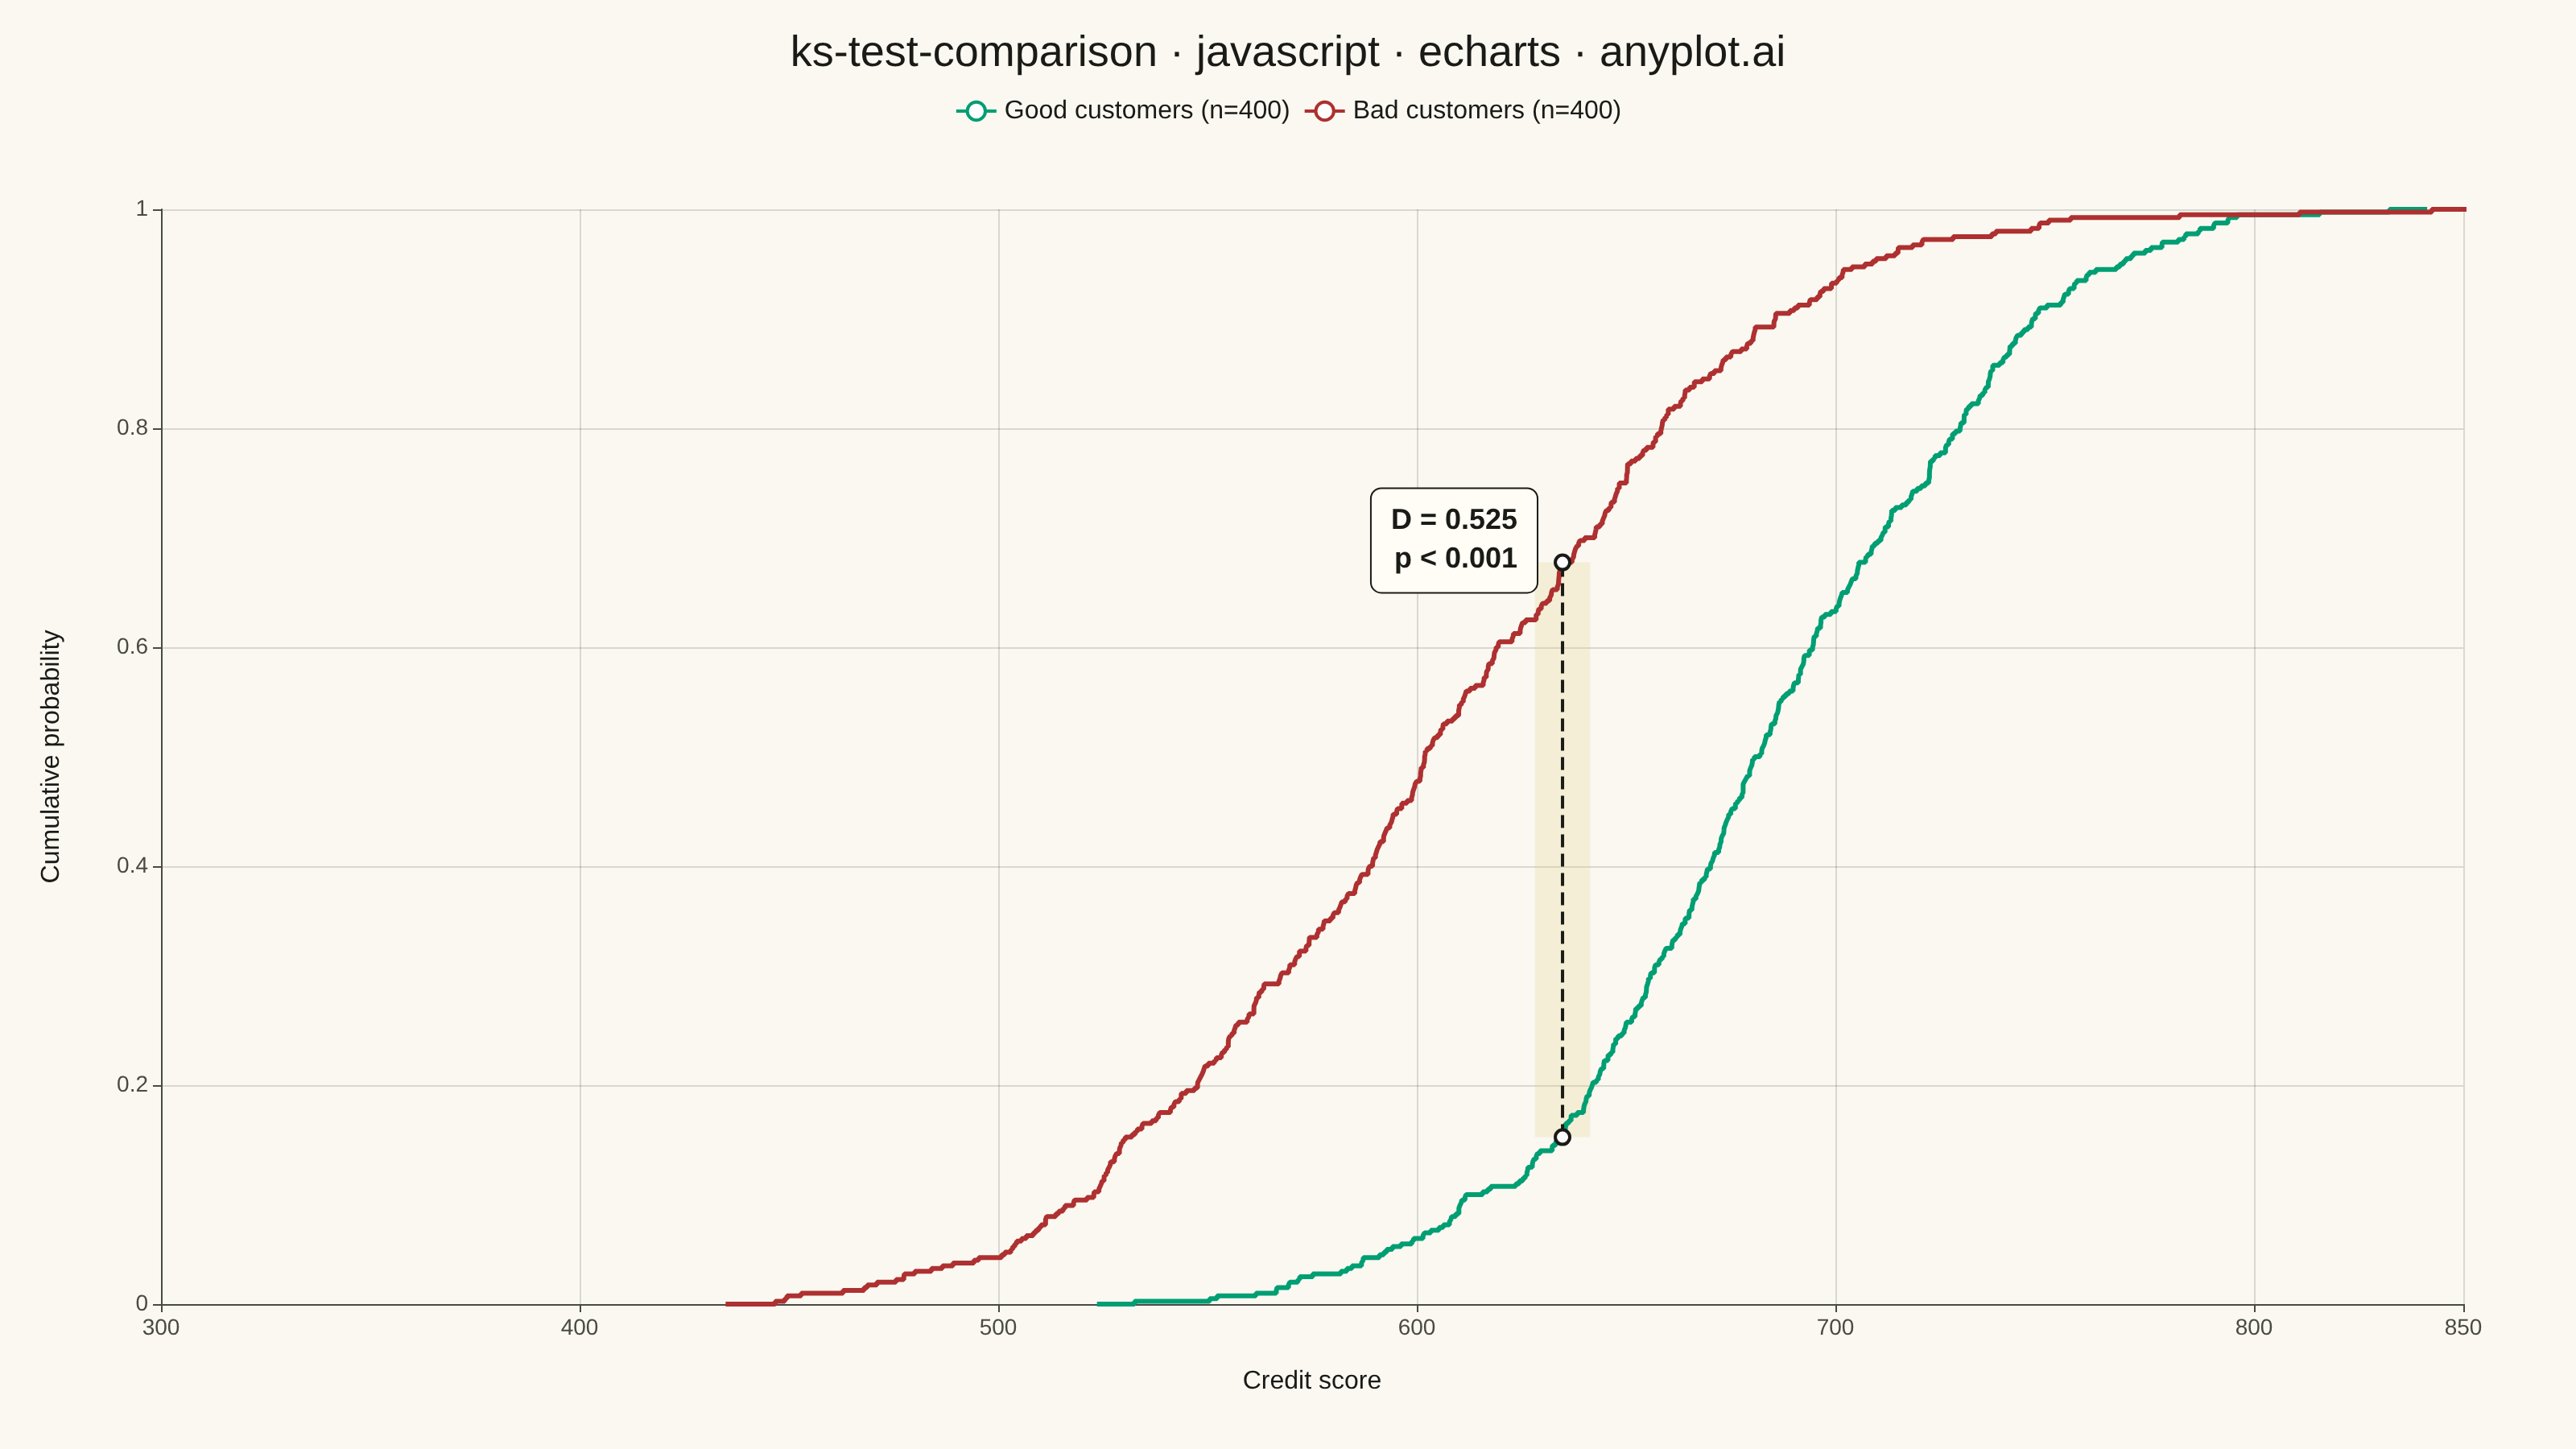
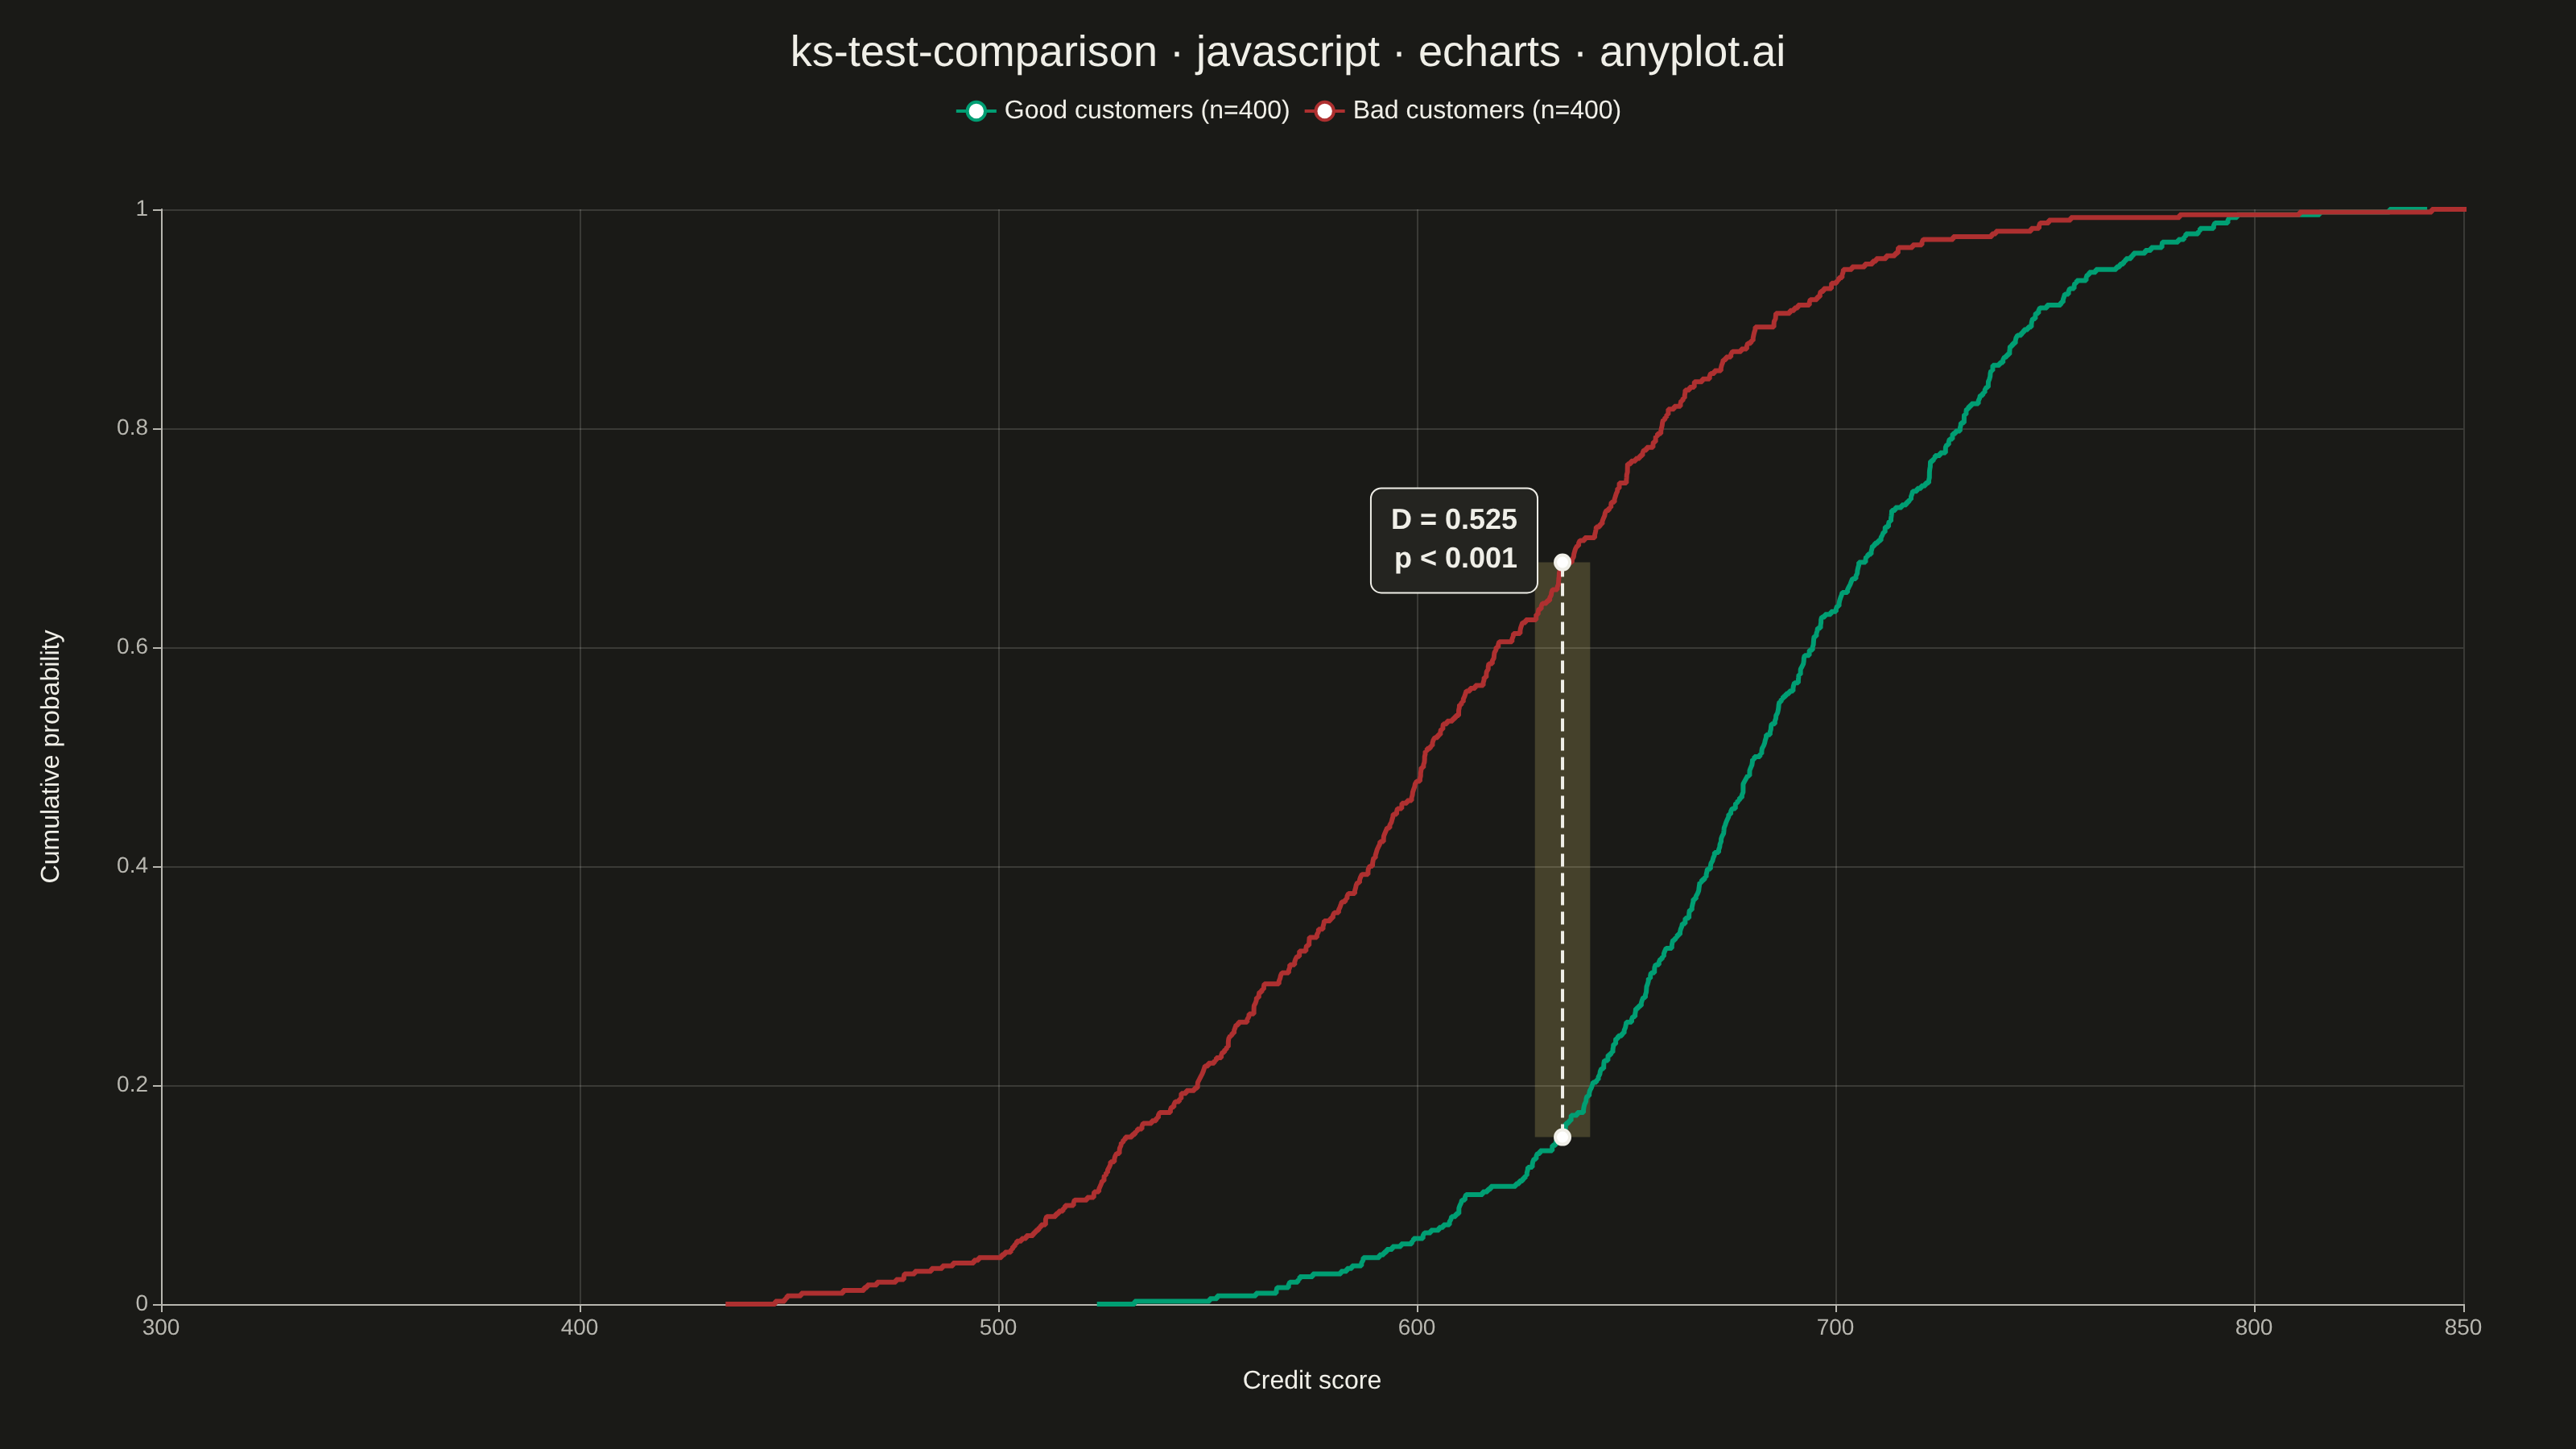
A Kolmogorov-Smirnov (K-S) plot compares two empirical cumulative distribution functions (ECDFs) and visualizes the K-S statistic, which is the maximum vertical distance between the two distributions. The plot displays both ECDFs as step functions, highlights the point of maximum divergence, and typically reports the K-S statistic value and p-value for hypothesis testing. This visualization is essential for determining whether two samples come from the same underlying distribution.
// anyplot.ai
// ks-test-comparison: Kolmogorov-Smirnov Plot for Distribution Comparison
// Library: echarts 6.1.0 | JavaScript 22.23.2
// Quality: 95/100 | Created: 2026-08-26

const t = window.ANYPLOT_TOKENS;

// --- Data (in-memory, deterministic LCG + Box-Muller) -----------------------
function makeLcg(seed) {
  let state = seed >>> 0;
  return function () {
    state = (Math.imul(state, 1664525) + 1013904223) >>> 0;
    return state / 4294967296;
  };
}

function normalSamples(n, mean, std, rng) {
  const out = [];
  while (out.length < n) {
    const u1 = Math.max(rng(), 1e-12);
    const u2 = rng();
    const mag = Math.sqrt(-2 * Math.log(u1));
    out.push(mean + std * mag * Math.cos(2 * Math.PI * u2));
    if (out.length < n) out.push(mean + std * mag * Math.sin(2 * Math.PI * u2));
  }
  return out.slice(0, n);
}

const rng = makeLcg(42);
const goodScores = normalSamples(400, 680, 55, rng)
  .map((v) => Math.min(850, Math.max(300, v)))
  .sort((a, b) => a - b);
const badScores = normalSamples(400, 605, 68, rng)
  .map((v) => Math.min(850, Math.max(300, v)))
  .sort((a, b) => a - b);

// --- ECDF construction --------------------------------------------------
function ecdfPoints(sorted) {
  const n = sorted.length;
  const pad = (sorted[n - 1] - sorted[0]) * 0.03;
  const points = [[sorted[0] - pad, 0]];
  sorted.forEach((value, i) => points.push([value, (i + 1) / n]));
  points.push([sorted[n - 1] + pad, 1]);
  return points;
}

function ecdfValue(sorted, x) {
  let lo = 0;
  let hi = sorted.length;
  while (lo < hi) {
    const mid = (lo + hi) >> 1;
    if (sorted[mid] <= x) lo = mid + 1;
    else hi = mid;
  }
  return lo / sorted.length;
}

// --- K-S statistic: max |F_good(x) - F_bad(x)| over all sample values -------
const combined = goodScores.concat(badScores).sort((a, b) => a - b);
let ksStat = 0;
let ksX = combined[0];
combined.forEach((x) => {
  const diff = Math.abs(ecdfValue(goodScores, x) - ecdfValue(badScores, x));
  if (diff > ksStat) {
    ksStat = diff;
    ksX = x;
  }
});
const f1AtKs = ecdfValue(goodScores, ksX);
const f2AtKs = ecdfValue(badScores, ksX);
const bandHalfWidth = (850 - 300) * 0.012;

// Asymptotic two-sample K-S p-value (Kolmogorov distribution)
const n1 = goodScores.length;
const n2 = badScores.length;
const nEff = (n1 * n2) / (n1 + n2);
const lambda = (Math.sqrt(nEff) + 0.12 + 0.11 / Math.sqrt(nEff)) * ksStat;
let pValue = 0;
for (let k = 1; k <= 100; k++) {
  pValue += 2 * (k % 2 === 0 ? -1 : 1) * Math.exp(-2 * k * k * lambda * lambda);
}
pValue = Math.min(1, Math.max(0, pValue));
const pLabel = pValue < 0.001 ? "p < 0.001" : `p = ${pValue.toFixed(3)}`;

// --- Init ---------------------------------------------------------------
const chart = echarts.init(document.getElementById("container"));

// --- Option ---------------------------------------------------------------
chart.setOption({
  animation: false,
  color: [t.palette[0], t.palette[4]],
  backgroundColor: "transparent",
  title: {
    text: "ks-test-comparison · javascript · echarts · anyplot.ai",
    left: "center",
    textStyle: { color: t.ink, fontSize: 27, fontWeight: 500 },
  },
  legend: {
    data: ["Good customers (n=400)", "Bad customers (n=400)"],
    top: 56,
    textStyle: { color: t.ink, fontSize: 16 },
  },
  grid: { left: 100, right: 70, top: 130, bottom: 90 },
  xAxis: {
    type: "value",
    name: "Credit score",
    nameLocation: "middle",
    nameGap: 40,
    nameTextStyle: { color: t.ink, fontSize: 16 },
    min: 300,
    max: 850,
    axisLabel: { color: t.inkSoft, fontSize: 14 },
    axisLine: { lineStyle: { color: t.inkSoft } },
    splitLine: { lineStyle: { color: t.grid } },
  },
  yAxis: {
    type: "value",
    name: "Cumulative probability",
    nameLocation: "middle",
    nameGap: 60,
    nameTextStyle: { color: t.ink, fontSize: 16 },
    min: 0,
    max: 1,
    axisLabel: { color: t.inkSoft, fontSize: 14 },
    axisLine: { lineStyle: { color: t.inkSoft } },
    splitLine: { lineStyle: { color: t.grid } },
  },
  series: [
    {
      name: "Good customers (n=400)",
      type: "line",
      step: "end",
      showSymbol: false,
      lineStyle: { width: 3, color: t.palette[0] },
      data: ecdfPoints(goodScores),
    },
    {
      name: "Bad customers (n=400)",
      type: "line",
      step: "end",
      showSymbol: false,
      lineStyle: { width: 3, color: t.palette[4] },
      data: ecdfPoints(badScores),
    },
    {
      name: "Max divergence",
      type: "line",
      showSymbol: true,
      symbolSize: 9,
      silent: true,
      legendHoverLink: false,
      lineStyle: { width: 2, type: "dashed", color: t.ink },
      itemStyle: { color: t.ink },
      data: [
        [ksX, f1AtKs],
        [ksX, f2AtKs],
      ],
      markArea: {
        silent: true,
        itemStyle: { color: t.amber, opacity: 0.22 },
        data: [
          [
            { xAxis: ksX - bandHalfWidth, yAxis: Math.min(f1AtKs, f2AtKs) },
            { xAxis: ksX + bandHalfWidth, yAxis: Math.max(f1AtKs, f2AtKs) },
          ],
        ],
      },
      markPoint: {
        symbol: "circle",
        symbolSize: 0,
        label: {
          show: true,
          position: ksX > 575 ? "left" : "right",
          distance: 16,
          color: t.ink,
          fontSize: 18,
          fontWeight: "bold",
          lineHeight: 24,
          padding: [8, 12],
          backgroundColor: t.elevatedBg,
          borderColor: t.ink,
          borderWidth: 1,
          borderRadius: 6,
          formatter: `D = ${ksStat.toFixed(3)}\n${pLabel}`,
        },
        data: [{ coord: [ksX, Math.max(f1AtKs, f2AtKs) + 0.02] }],
      },
    },
  ],
});
Runnable source as JSON, for any HTTP client: https://api.anyplot.ai/specs/ks-test-comparison/echarts/code. Any spec id and library id listed in llms-full.txt fit the same URL shape; every URL below is complete and callable.
{
  "spec_id": "ks-test-comparison",
  "language": "javascript",
  "library": "echarts",
  "page": "https://anyplot.ai/ks-test-comparison/javascript/echarts",
  "hub": "https://anyplot.ai/ks-test-comparison",
  "code_json": "https://api.anyplot.ai/specs/ks-test-comparison/echarts/code",
  "spec_json": "https://api.anyplot.ai/specs/ks-test-comparison",
  "render_light_png": "https://storage.googleapis.com/anyplot-images/plots/ks-test-comparison/javascript/echarts/plot-light.png",
  "render_dark_png": "https://storage.googleapis.com/anyplot-images/plots/ks-test-comparison/javascript/echarts/plot-dark.png",
  "interactive_light_html": "https://storage.googleapis.com/anyplot-images/plots/ks-test-comparison/javascript/echarts/plot-light.html",
  "interactive_dark_html": "https://storage.googleapis.com/anyplot-images/plots/ks-test-comparison/javascript/echarts/plot-dark.html",
  "quality_score": 95.0,
  "license": "MIT",
  "guide": "https://anyplot.ai/llms.txt"
}
Part of Kolmogorov-Smirnov Plot for Distribution Comparison on anyplot.ai.