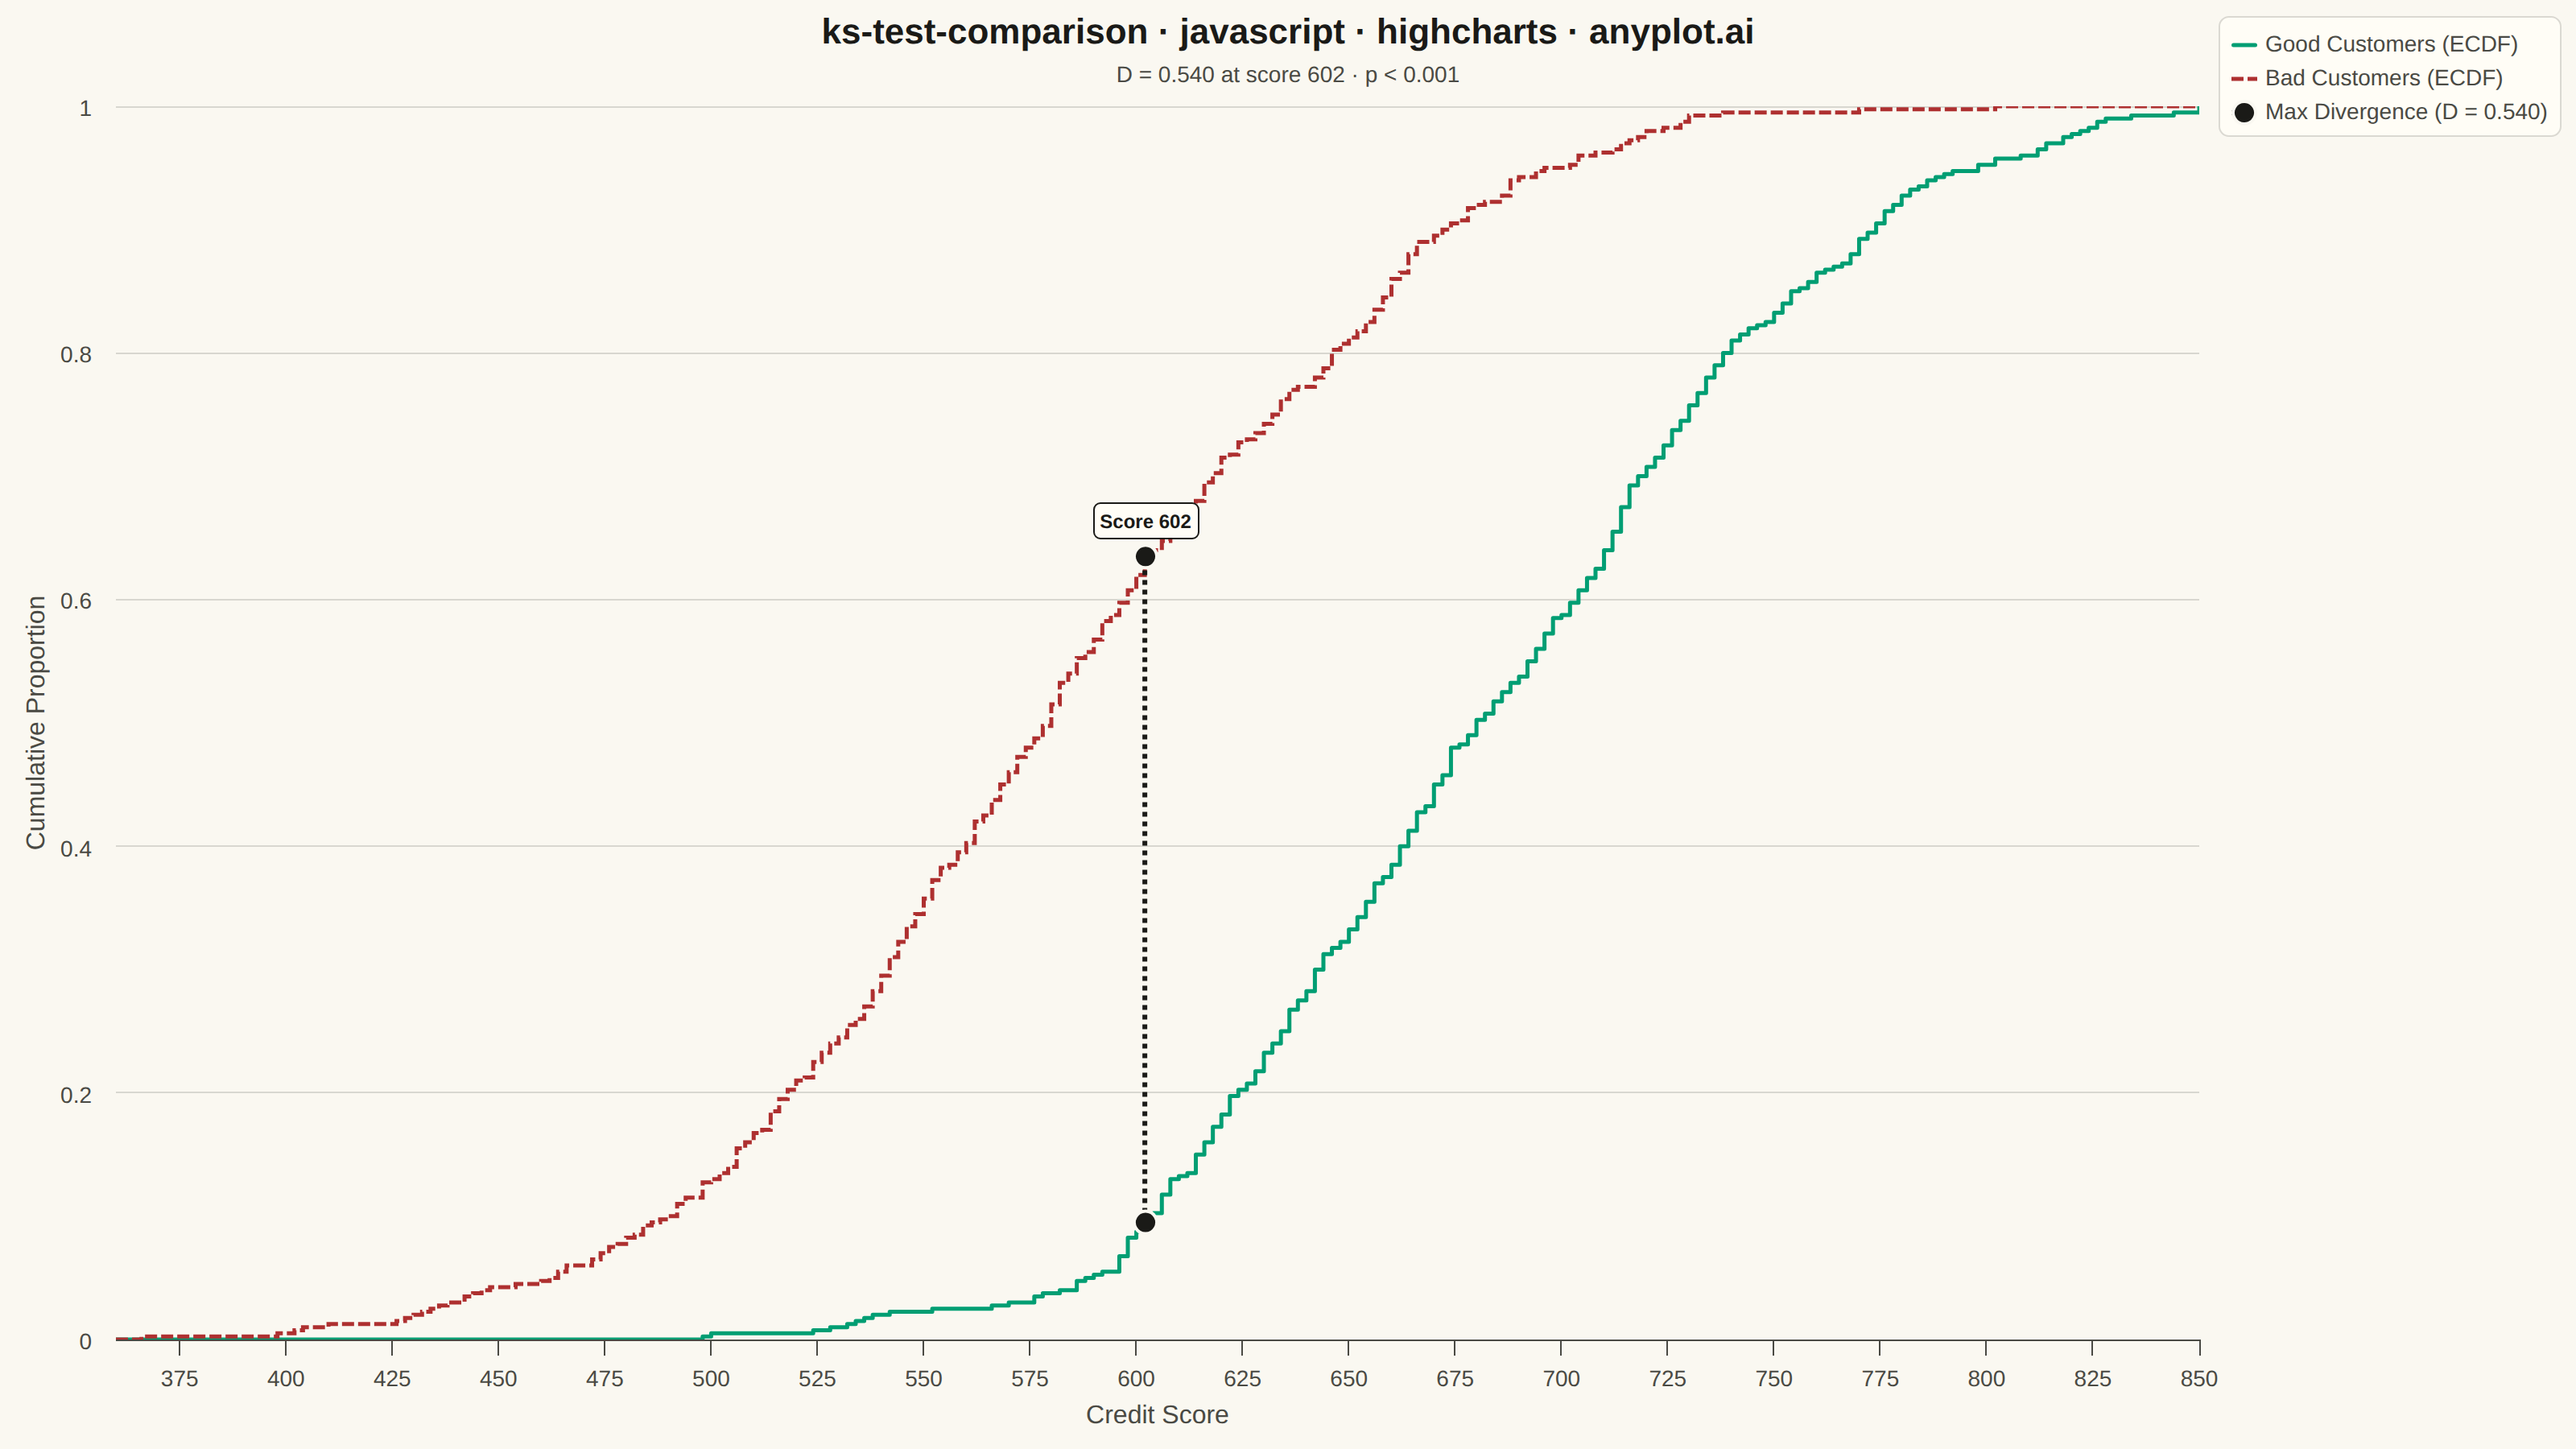
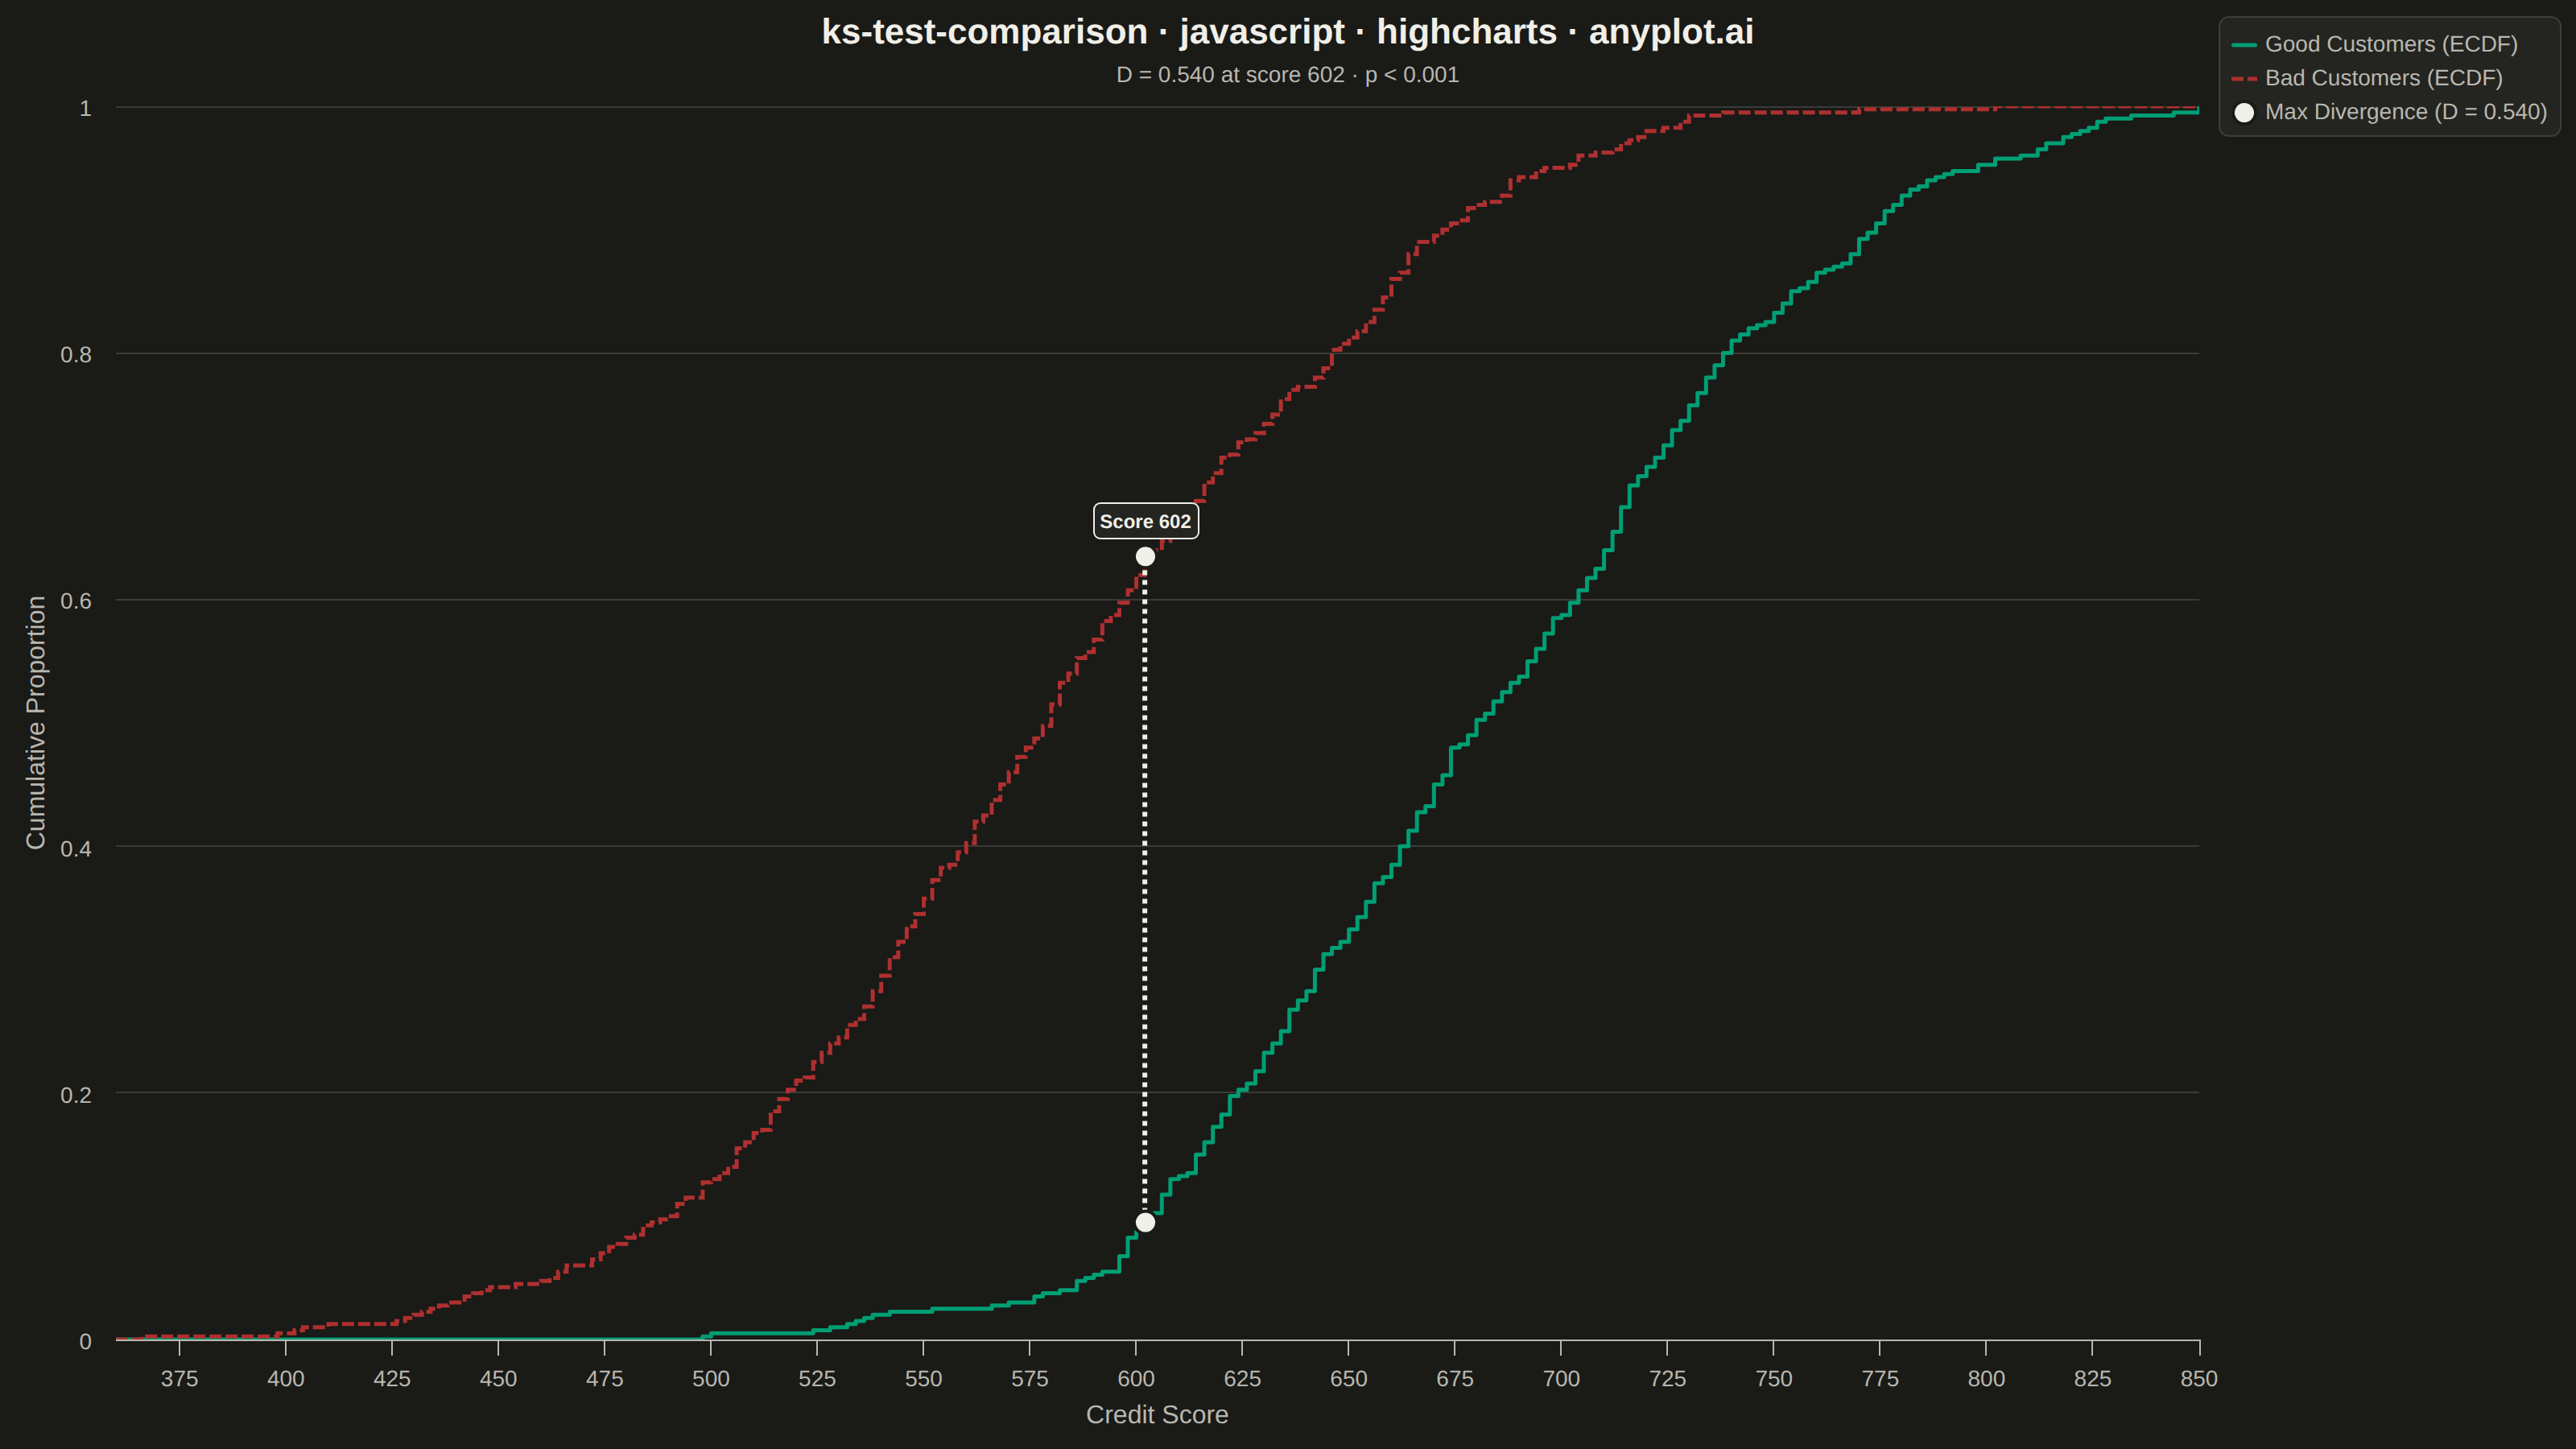
The same plot in 14 other libraries — JavaScript: Chart.js, D3.js, Apache ECharts, MUI X Charts; Python: Altair, Bokeh, lets-plot, Matplotlib, Plotly, plotnine, Pygal, Seaborn; R: ggplot2; Julia: Makie.jl. Compare all 15 side by side: Kolmogorov-Smirnov Plot for Distribution Comparison in Python, R, Julia and JavaScript.
A Kolmogorov-Smirnov (K-S) plot compares two empirical cumulative distribution functions (ECDFs) and visualizes the K-S statistic, which is the maximum vertical distance between the two distributions. The plot displays both ECDFs as step functions, highlights the point of maximum divergence, and typically reports the K-S statistic value and p-value for hypothesis testing. This visualization is essential for determining whether two samples come from the same underlying distribution.
// anyplot.ai
// ks-test-comparison: Kolmogorov-Smirnov Plot for Distribution Comparison
// Library: highcharts 12.6.0 | JavaScript 22.23.2
// Quality: 92/100 | Created: 2026-08-26

const t = window.ANYPLOT_TOKENS;

// --- Data: credit-scoring model validation (Good vs Bad customers) ---------
// Tiny fixed-seed LCG for deterministic pseudo-random sampling in the browser.
let lcgState = 20260826;
function nextRandom() {
  lcgState = (lcgState * 1664525 + 1013904223) % 4294967296;
  return lcgState / 4294967296;
}
function randomNormal(mean, stdDev) {
  const u1 = Math.max(nextRandom(), 1e-9);
  const u2 = nextRandom();
  const z = Math.sqrt(-2 * Math.log(u1)) * Math.cos(2 * Math.PI * u2);
  return mean + z * stdDev;
}

const SAMPLE_SIZE = 400;
const goodScores = [];
const badScores = [];
for (let i = 0; i < SAMPLE_SIZE; i += 1) {
  goodScores.push(Math.min(850, Math.max(300, randomNormal(680, 65))));
  badScores.push(Math.min(850, Math.max(300, randomNormal(590, 75))));
}
goodScores.sort((a, b) => a - b);
badScores.sort((a, b) => a - b);

// Build an ECDF as a step series over a shared grid of x values.
function buildEcdf(sortedSample, xGrid) {
  const n = sortedSample.length;
  let pointer = 0;
  return xGrid.map((x) => {
    while (pointer < n && sortedSample[pointer] <= x) pointer += 1;
    return pointer / n;
  });
}

const minScore = Math.floor(Math.min(goodScores[0], badScores[0]) / 10) * 10;
const maxScore = Math.ceil(Math.max(goodScores[SAMPLE_SIZE - 1], badScores[SAMPLE_SIZE - 1]) / 10) * 10;
const GRID_STEP = 2;
const xGrid = [];
for (let x = minScore; x <= maxScore; x += GRID_STEP) xGrid.push(x);

const goodCdf = buildEcdf(goodScores, xGrid);
const badCdf = buildEcdf(badScores, xGrid);

// K-S statistic: max vertical distance between the two ECDFs, and where it occurs.
let ksStatistic = 0;
let ksIndex = 0;
for (let i = 0; i < xGrid.length; i += 1) {
  const distance = Math.abs(goodCdf[i] - badCdf[i]);
  if (distance > ksStatistic) {
    ksStatistic = distance;
    ksIndex = i;
  }
}
const ksScore = xGrid[ksIndex];
const ksLow = Math.min(goodCdf[ksIndex], badCdf[ksIndex]);
const ksHigh = Math.max(goodCdf[ksIndex], badCdf[ksIndex]);

// Two-sample K-S asymptotic p-value (Kolmogorov distribution survival function).
const nEff = Math.sqrt((SAMPLE_SIZE * SAMPLE_SIZE) / (2 * SAMPLE_SIZE));
const lambda = (nEff + 0.12 + 0.11 / nEff) * ksStatistic;
let pValue = 0;
for (let k = 1; k <= 100; k += 1) {
  pValue += 2 * (-1) ** (k - 1) * Math.exp(-2 * k * k * lambda * lambda);
}
pValue = Math.min(1, Math.max(0, pValue));
const pValueLabel = pValue < 0.001 ? "p < 0.001" : `p = ${pValue.toFixed(3)}`;

const goodSeriesData = xGrid.map((x, i) => [x, goodCdf[i]]);
const badSeriesData = xGrid.map((x, i) => [x, badCdf[i]]);

// --- Chart -------------------------------------------------------------------
Highcharts.chart("container", {
  chart: {
    type: "line",
    backgroundColor: "transparent",
    animation: false,
    style: { fontFamily: "inherit" },
  },
  credits: { enabled: false },
  colors: t.palette,
  title: {
    text: "ks-test-comparison · javascript · highcharts · anyplot.ai",
    style: { color: t.ink, fontSize: "22px", fontWeight: "600" },
  },
  subtitle: {
    text: `D = ${ksStatistic.toFixed(3)} at score ${ksScore} · ${pValueLabel}`,
    style: { color: t.inkSoft, fontSize: "14px" },
  },
  xAxis: {
    title: { text: "Credit Score", style: { color: t.inkSoft, fontSize: "16px" } },
    lineColor: t.inkSoft,
    tickColor: t.inkSoft,
    gridLineWidth: 0,
    min: minScore,
    max: maxScore,
    labels: { style: { color: t.inkSoft, fontSize: "14px" } },
  },
  yAxis: {
    title: { text: "Cumulative Proportion", style: { color: t.inkSoft, fontSize: "16px" } },
    lineColor: t.inkSoft,
    tickColor: t.inkSoft,
    gridLineColor: t.grid,
    gridLineWidth: 1,
    min: 0,
    max: 1,
    tickInterval: 0.2,
    labels: { style: { color: t.inkSoft, fontSize: "14px" } },
  },
  legend: {
    align: "right",
    verticalAlign: "top",
    layout: "vertical",
    itemStyle: { color: t.inkSoft, fontSize: "14px" },
    itemHoverStyle: { color: t.ink },
    backgroundColor: t.elevatedBg,
    borderColor: t.grid,
    borderWidth: 1,
    borderRadius: 6,
  },
  tooltip: { enabled: false },
  plotOptions: {
    series: { animation: false, marker: { enabled: false } },
  },
  series: [
    {
      name: "Good Customers (ECDF)",
      data: goodSeriesData,
      color: t.palette[0],
      step: "left",
      lineWidth: 2.5,
    },
    {
      name: "Bad Customers (ECDF)",
      data: badSeriesData,
      color: t.palette[4],
      step: "left",
      lineWidth: 2.5,
      dashStyle: "ShortDash",
    },
    {
      name: `Max Divergence (D = ${ksStatistic.toFixed(3)})`,
      type: "line",
      data: [
        [ksScore, ksLow],
        [ksScore, ksHigh],
      ],
      color: t.ink,
      lineWidth: 3,
      dashStyle: "ShortDot",
      marker: {
        enabled: true,
        radius: 7,
        symbol: "circle",
        fillColor: t.ink,
        lineColor: t.pageBg,
        lineWidth: 2,
      },
      dataLabels: {
        enabled: true,
        formatter() {
          return this.point.index === 1 ? `Score ${ksScore}` : null;
        },
        y: -12,
        backgroundColor: t.elevatedBg,
        borderColor: t.ink,
        borderWidth: 1,
        borderRadius: 4,
        padding: 4,
        style: { color: t.ink, fontSize: "12px", fontWeight: "600", textOutline: "none" },
      },
      enableMouseTracking: false,
    },
  ],
});
Runnable source as JSON, for any HTTP client: https://api.anyplot.ai/specs/ks-test-comparison/highcharts/code. Any spec id and library id listed in llms-full.txt fit the same URL shape; every URL below is complete and callable.
{
  "spec_id": "ks-test-comparison",
  "language": "javascript",
  "library": "highcharts",
  "page": "https://anyplot.ai/ks-test-comparison/javascript/highcharts",
  "hub": "https://anyplot.ai/ks-test-comparison",
  "code_json": "https://api.anyplot.ai/specs/ks-test-comparison/highcharts/code",
  "spec_json": "https://api.anyplot.ai/specs/ks-test-comparison",
  "render_light_png": "https://storage.googleapis.com/anyplot-images/plots/ks-test-comparison/javascript/highcharts/plot-light.png",
  "render_dark_png": "https://storage.googleapis.com/anyplot-images/plots/ks-test-comparison/javascript/highcharts/plot-dark.png",
  "interactive_light_html": "https://storage.googleapis.com/anyplot-images/plots/ks-test-comparison/javascript/highcharts/plot-light.html",
  "interactive_dark_html": "https://storage.googleapis.com/anyplot-images/plots/ks-test-comparison/javascript/highcharts/plot-dark.html",
  "quality_score": 92.0,
  "license": "MIT",
  "guide": "https://anyplot.ai/llms.txt"
}
Part of Kolmogorov-Smirnov Plot for Distribution Comparison on anyplot.ai.