The same plot in 14 other libraries — JavaScript: Chart.js, Apache ECharts, Highcharts, MUI X Charts; Python: Altair, Bokeh, lets-plot, Matplotlib, Plotly, plotnine, Pygal, Seaborn; R: ggplot2; Julia: Makie.jl. Compare all 15 side by side: Kolmogorov-Smirnov Plot for Distribution Comparison in Python, R, Julia and JavaScript.
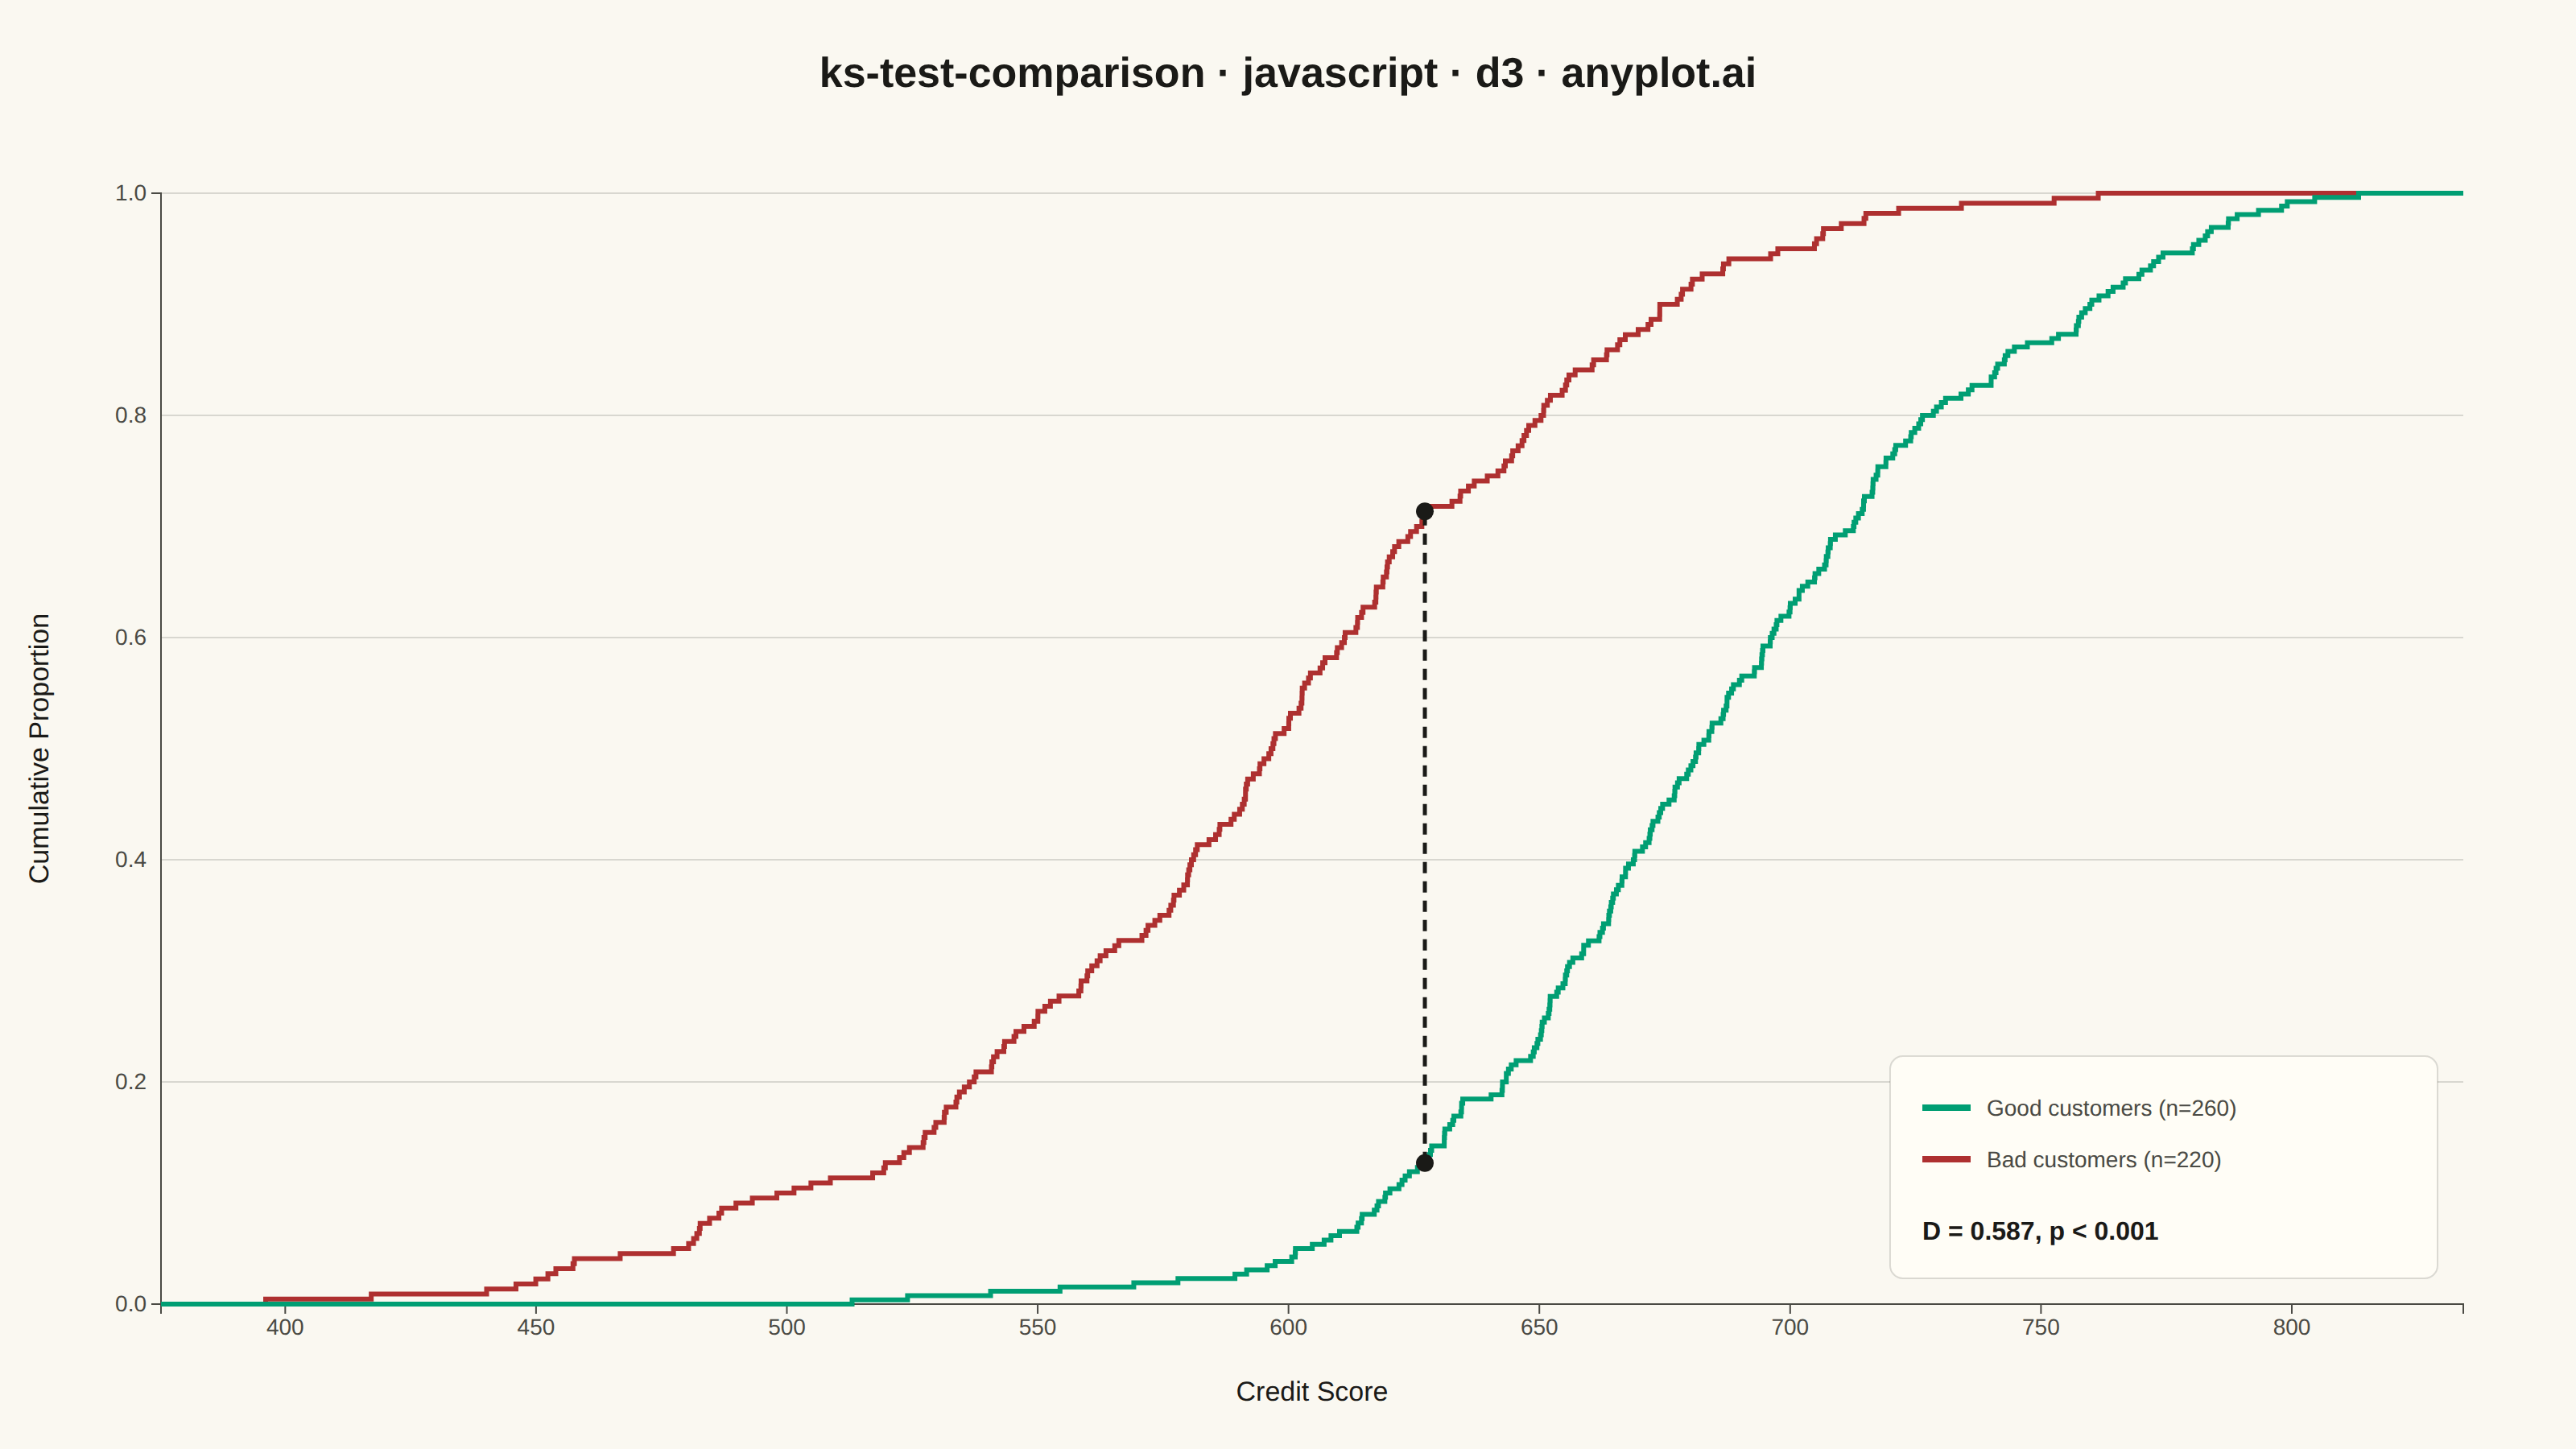
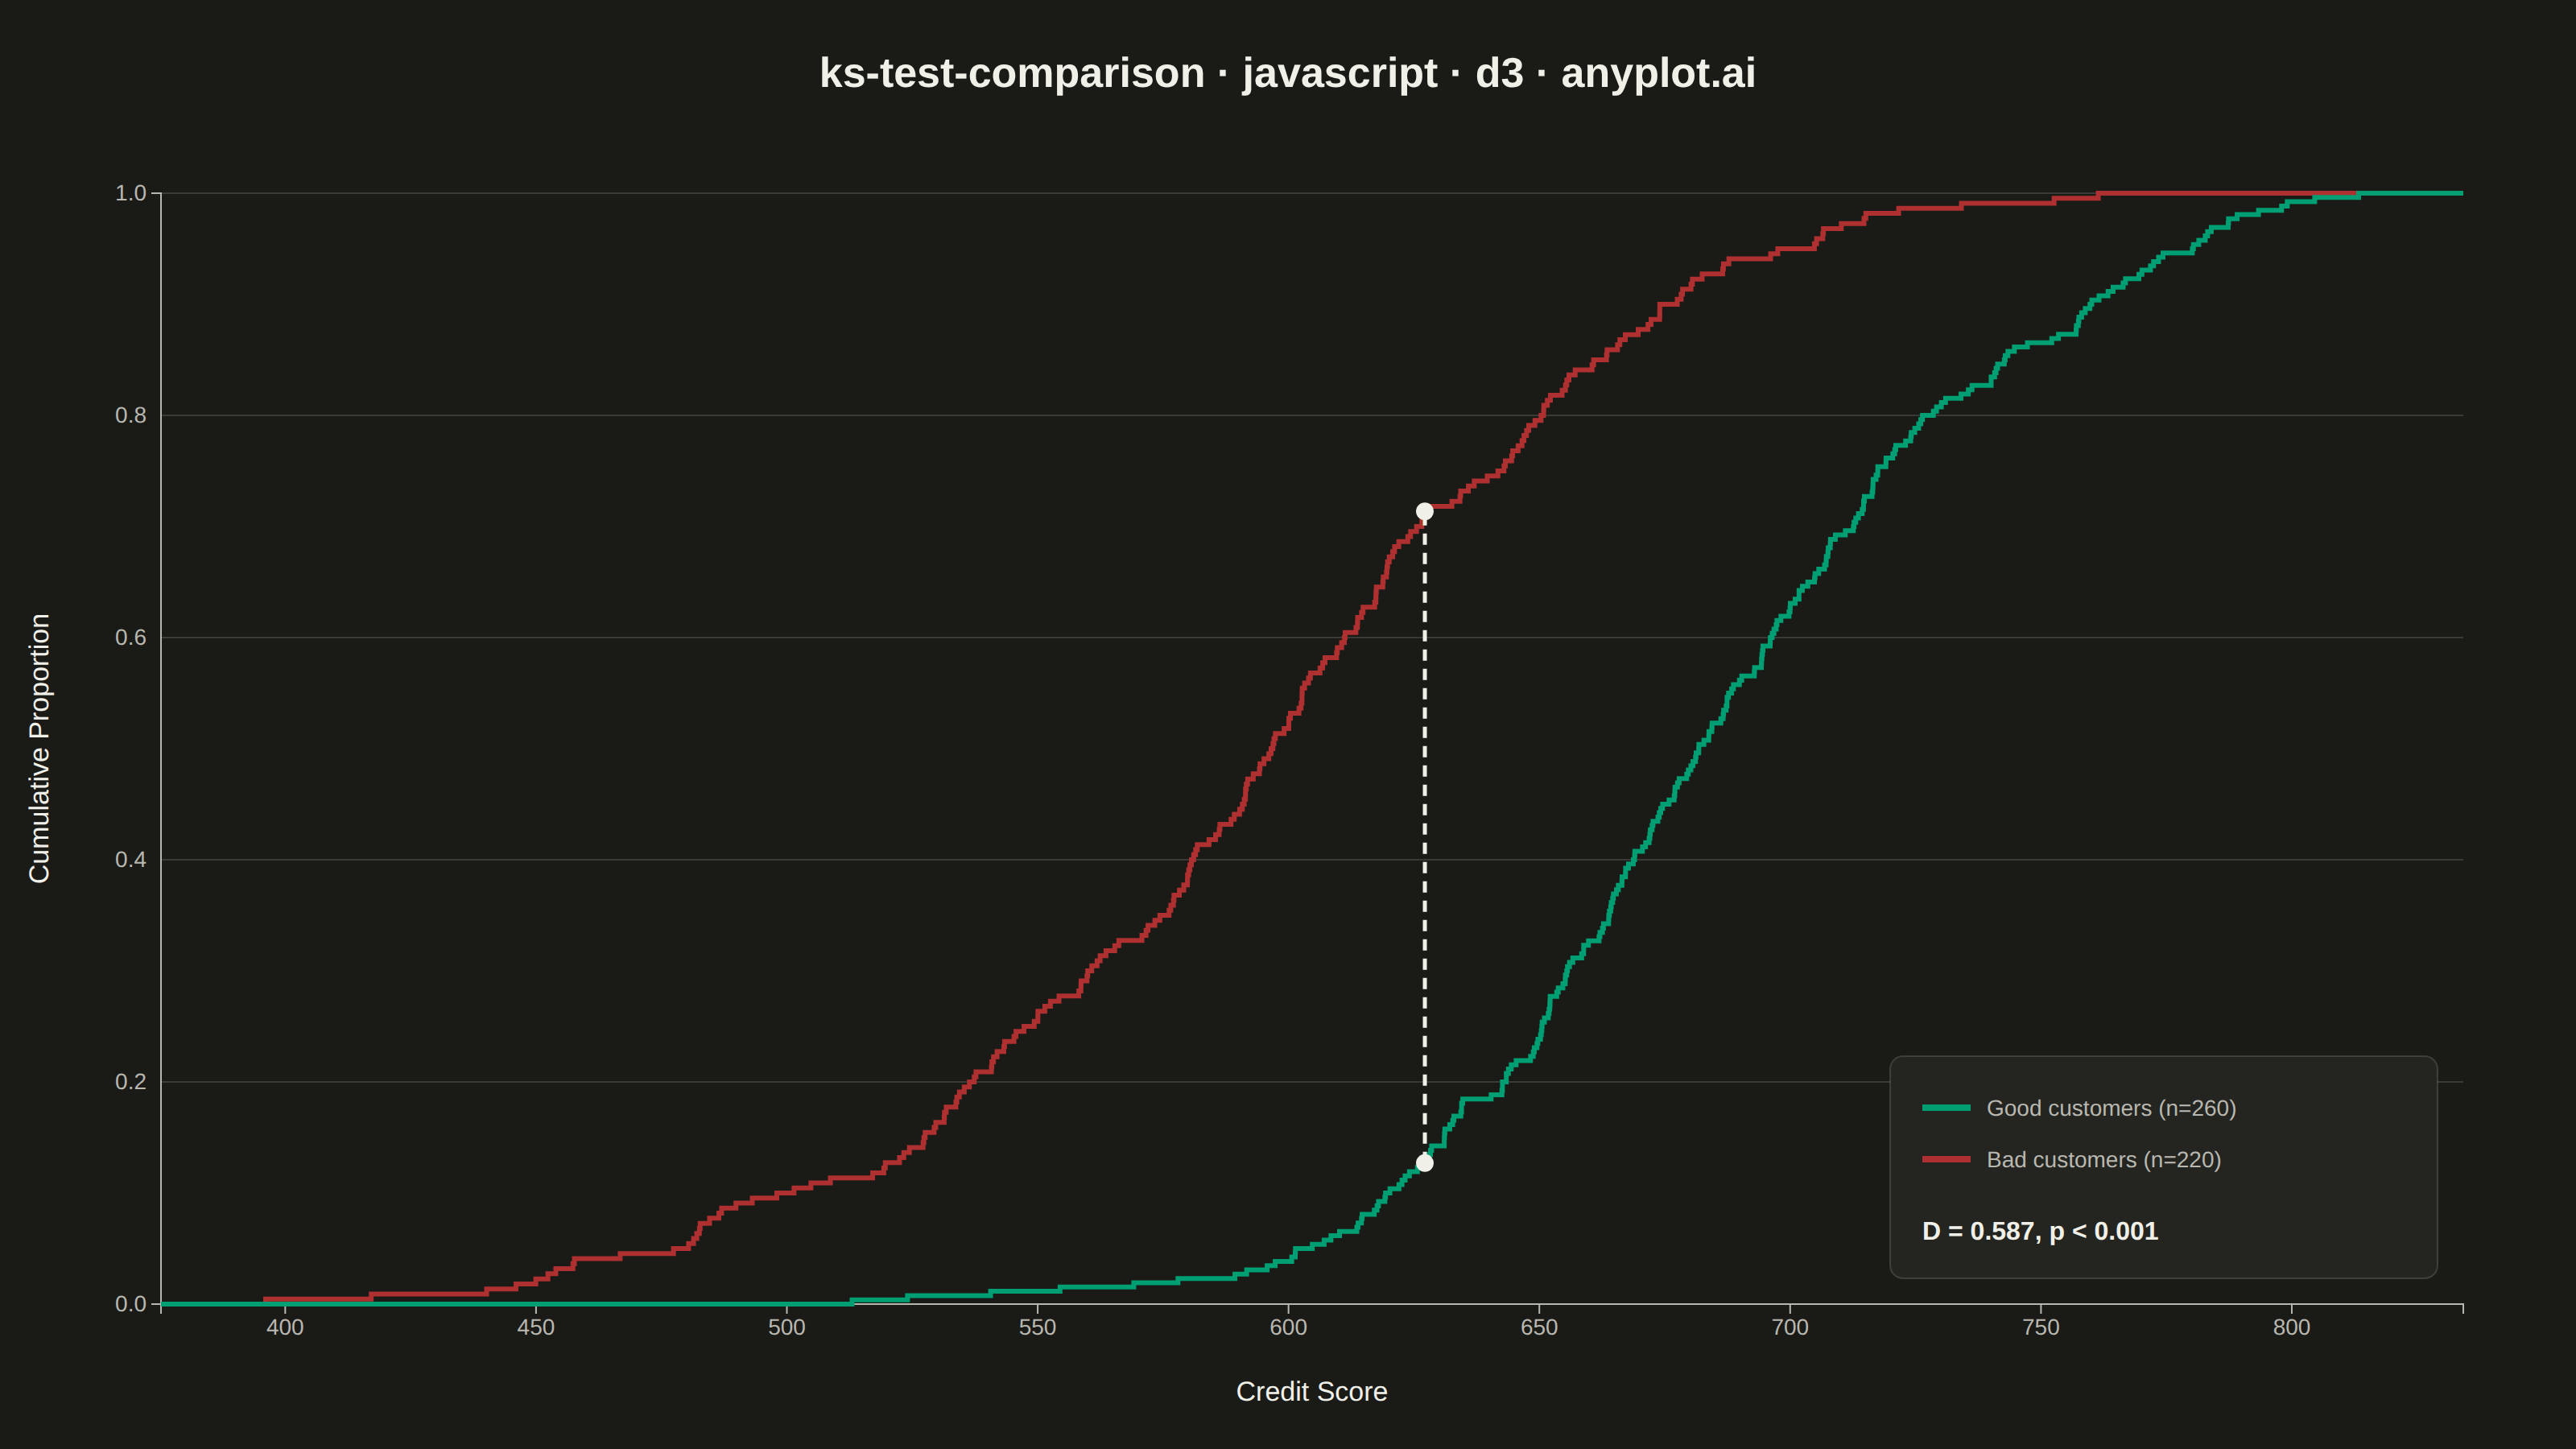
A Kolmogorov-Smirnov (K-S) plot compares two empirical cumulative distribution functions (ECDFs) and visualizes the K-S statistic, which is the maximum vertical distance between the two distributions. The plot displays both ECDFs as step functions, highlights the point of maximum divergence, and typically reports the K-S statistic value and p-value for hypothesis testing. This visualization is essential for determining whether two samples come from the same underlying distribution.
// anyplot.ai
// ks-test-comparison: Kolmogorov-Smirnov Plot for Distribution Comparison
// Library: d3 7.9.0 | JavaScript 22.23.2
// Quality: 92/100 | Created: 2026-08-26

const t = window.ANYPLOT_TOKENS;
const { width, height } = window.ANYPLOT_SIZE;
const margin = { top: 120, right: 70, bottom: 90, left: 100 };
const iw = width - margin.left - margin.right;
const ih = height - margin.top - margin.bottom;

// --- Deterministic PRNG (LCG) + Box-Muller normal sampler -------------------
let seed = 42;
function nextUniform() {
  seed = (seed * 1103515245 + 12345) % 2147483648;
  return seed / 2147483648;
}
function nextNormal(mean, std) {
  const u1 = Math.max(nextUniform(), 1e-9);
  const u2 = nextUniform();
  const z = Math.sqrt(-2 * Math.log(u1)) * Math.cos(2 * Math.PI * u2);
  return mean + z * std;
}

// --- Data: credit scores for Good vs Bad loan customers ---------------------
const n1 = 260;
const n2 = 220;
const goodScores = Array.from({ length: n1 }, () => nextNormal(680, 55));
const badScores = Array.from({ length: n2 }, () => nextNormal(590, 65));

const sorted1 = goodScores.slice().sort((a, b) => a - b);
const sorted2 = badScores.slice().sort((a, b) => a - b);

// --- Two-sample K-S statistic (merge sweep over both sorted samples) -------
let i = 0;
let j = 0;
let ksD = 0;
let ksX = sorted1[0];
let ksD1 = 0;
let ksD2 = 0;
while (i < n1 && j < n2) {
  const x = sorted1[i] <= sorted2[j] ? sorted1[i] : sorted2[j];
  if (sorted1[i] <= sorted2[j]) i += 1;
  else j += 1;
  const d1 = i / n1;
  const d2 = j / n2;
  const diff = Math.abs(d1 - d2);
  if (diff > ksD) {
    ksD = diff;
    ksX = x;
    ksD1 = d1;
    ksD2 = d2;
  }
}

// Asymptotic two-sample K-S p-value (Kolmogorov distribution series)
const nEff = (n1 * n2) / (n1 + n2);
const lambda = (Math.sqrt(nEff) + 0.12 + 0.11 / Math.sqrt(nEff)) * ksD;
let pValue = 0;
for (let k = 1; k <= 100; k += 1) {
  pValue += 2 * (-1) ** (k - 1) * Math.exp(-2 * k * k * lambda * lambda);
}
pValue = Math.min(Math.max(pValue, 0), 1);
const pLabel = pValue < 0.001 ? "p < 0.001" : `p = ${pValue.toFixed(3)}`;

// --- Scales -------------------------------------------------------------------
const allScores = sorted1.concat(sorted2);
const scoreMin = d3.min(allScores);
const scoreMax = d3.max(allScores);
const scorePad = (scoreMax - scoreMin) * 0.05;
const xDomain = [scoreMin - scorePad, scoreMax + scorePad];

const x = d3.scaleLinear().domain(xDomain).range([0, iw]);
const y = d3.scaleLinear().domain([0, 1]).range([ih, 0]);

// --- ECDF step-function point series -----------------------------------------
function ecdfPoints(sorted, n) {
  const pts = [[xDomain[0], 0]];
  sorted.forEach((value, idx) => pts.push([value, (idx + 1) / n]));
  pts.push([xDomain[1], 1]);
  return pts;
}
const goodEcdf = ecdfPoints(sorted1, n1);
const badEcdf = ecdfPoints(sorted2, n2);
const stepLine = d3
  .line()
  .x((d) => x(d[0]))
  .y((d) => y(d[1]))
  .curve(d3.curveStepAfter);

// --- SVG mount ----------------------------------------------------------------
const svg = d3.select("#container").append("svg").attr("width", width).attr("height", height);
const g = svg.append("g").attr("transform", `translate(${margin.left},${margin.top})`);

// --- Gridlines (y-axis only) ---------------------------------------------------
g.append("g")
  .selectAll("line")
  .data(y.ticks(5))
  .join("line")
  .attr("x1", 0)
  .attr("x2", iw)
  .attr("y1", (d) => y(d))
  .attr("y2", (d) => y(d))
  .attr("stroke", t.grid)
  .attr("stroke-width", 1);

// --- Axes -----------------------------------------------------------------------
const xAxis = g
  .append("g")
  .attr("transform", `translate(0,${ih})`)
  .call(d3.axisBottom(x).ticks(8).tickFormat(d3.format("d")));
const yAxis = g.append("g").call(d3.axisLeft(y).ticks(5).tickFormat(d3.format(".1f")));
for (const axisGroup of [xAxis, yAxis]) {
  axisGroup.selectAll("text").attr("fill", t.inkSoft).style("font-size", "14px");
  axisGroup.selectAll("line").attr("stroke", t.inkSoft);
  axisGroup.select(".domain").attr("stroke", t.inkSoft);
}
xAxis.selectAll("line").attr("stroke", t.inkSoft);
yAxis.selectAll("line").remove();

g.append("text")
  .attr("x", iw / 2)
  .attr("y", ih + 60)
  .attr("text-anchor", "middle")
  .attr("fill", t.ink)
  .style("font-size", "17px")
  .text("Credit Score");

g.append("text")
  .attr("transform", "rotate(-90)")
  .attr("x", -ih / 2)
  .attr("y", -70)
  .attr("text-anchor", "middle")
  .attr("fill", t.ink)
  .style("font-size", "17px")
  .text("Cumulative Proportion");

// --- ECDF step curves -----------------------------------------------------------
g.append("path").datum(badEcdf).attr("fill", "none").attr("stroke", t.palette[4]).attr("stroke-width", 3).attr("d", stepLine);
g.append("path").datum(goodEcdf).attr("fill", "none").attr("stroke", t.palette[0]).attr("stroke-width", 3).attr("d", stepLine);

// --- Maximum divergence marker ---------------------------------------------------
g.append("line")
  .attr("x1", x(ksX))
  .attr("x2", x(ksX))
  .attr("y1", y(ksD1))
  .attr("y2", y(ksD2))
  .attr("stroke", t.ink)
  .attr("stroke-width", 2.5)
  .attr("stroke-dasharray", "7,5");
g.append("circle").attr("cx", x(ksX)).attr("cy", y(ksD1)).attr("r", 5.5).attr("fill", t.ink);
g.append("circle").attr("cx", x(ksX)).attr("cy", y(ksD2)).attr("r", 5.5).attr("fill", t.ink);

// --- Info panel: legend + K-S statistic -----------------------------------------
const panelWidth = 340;
const panelHeight = 138;
const panelX = iw - panelWidth - 16;
const panelY = ih - panelHeight - 16;
const panel = g.append("g").attr("transform", `translate(${panelX},${panelY})`);
panel
  .append("rect")
  .attr("width", panelWidth)
  .attr("height", panelHeight)
  .attr("rx", 8)
  .attr("fill", t.elevatedBg)
  .attr("stroke", t.grid)
  .attr("stroke-width", 1);

const legendRows = [
  { label: `Good customers (n=${n1})`, color: t.palette[0] },
  { label: `Bad customers (n=${n2})`, color: t.palette[4] },
];
legendRows.forEach((row, idx) => {
  const rowY = 32 + idx * 32;
  panel.append("line").attr("x1", 20).attr("x2", 50).attr("y1", rowY).attr("y2", rowY).attr("stroke", row.color).attr("stroke-width", 4);
  panel
    .append("text")
    .attr("x", 60)
    .attr("y", rowY + 5)
    .attr("fill", t.inkSoft)
    .style("font-size", "14px")
    .text(row.label);
});

panel
  .append("text")
  .attr("x", 20)
  .attr("y", panelHeight - 24)
  .attr("fill", t.ink)
  .style("font-size", "16px")
  .style("font-weight", "600")
  .text(`D = ${ksD.toFixed(3)}, ${pLabel}`);

// --- Title -----------------------------------------------------------------------
svg
  .append("text")
  .attr("x", width / 2)
  .attr("y", 54)
  .attr("text-anchor", "middle")
  .attr("fill", t.ink)
  .style("font-size", "26px")
  .style("font-weight", "600")
  .text("ks-test-comparison · javascript · d3 · anyplot.ai");
Runnable source as JSON, for any HTTP client: https://api.anyplot.ai/specs/ks-test-comparison/d3/code. Any spec id and library id listed in llms-full.txt fit the same URL shape; every URL below is complete and callable.
{
  "spec_id": "ks-test-comparison",
  "language": "javascript",
  "library": "d3",
  "page": "https://anyplot.ai/ks-test-comparison/javascript/d3",
  "hub": "https://anyplot.ai/ks-test-comparison",
  "code_json": "https://api.anyplot.ai/specs/ks-test-comparison/d3/code",
  "spec_json": "https://api.anyplot.ai/specs/ks-test-comparison",
  "render_light_png": "https://storage.googleapis.com/anyplot-images/plots/ks-test-comparison/javascript/d3/plot-light.png",
  "render_dark_png": "https://storage.googleapis.com/anyplot-images/plots/ks-test-comparison/javascript/d3/plot-dark.png",
  "interactive_light_html": "https://storage.googleapis.com/anyplot-images/plots/ks-test-comparison/javascript/d3/plot-light.html",
  "interactive_dark_html": "https://storage.googleapis.com/anyplot-images/plots/ks-test-comparison/javascript/d3/plot-dark.html",
  "quality_score": 92.0,
  "license": "MIT",
  "guide": "https://anyplot.ai/llms.txt"
}
Part of Kolmogorov-Smirnov Plot for Distribution Comparison on anyplot.ai.