The same plot in 14 other libraries — JavaScript: D3.js, Apache ECharts, Highcharts, MUI X Charts; Python: Altair, Bokeh, lets-plot, Matplotlib, Plotly, plotnine, Pygal, Seaborn; R: ggplot2; Julia: Makie.jl. Compare all 15 side by side: Kolmogorov-Smirnov Plot for Distribution Comparison in Python, R, Julia and JavaScript.
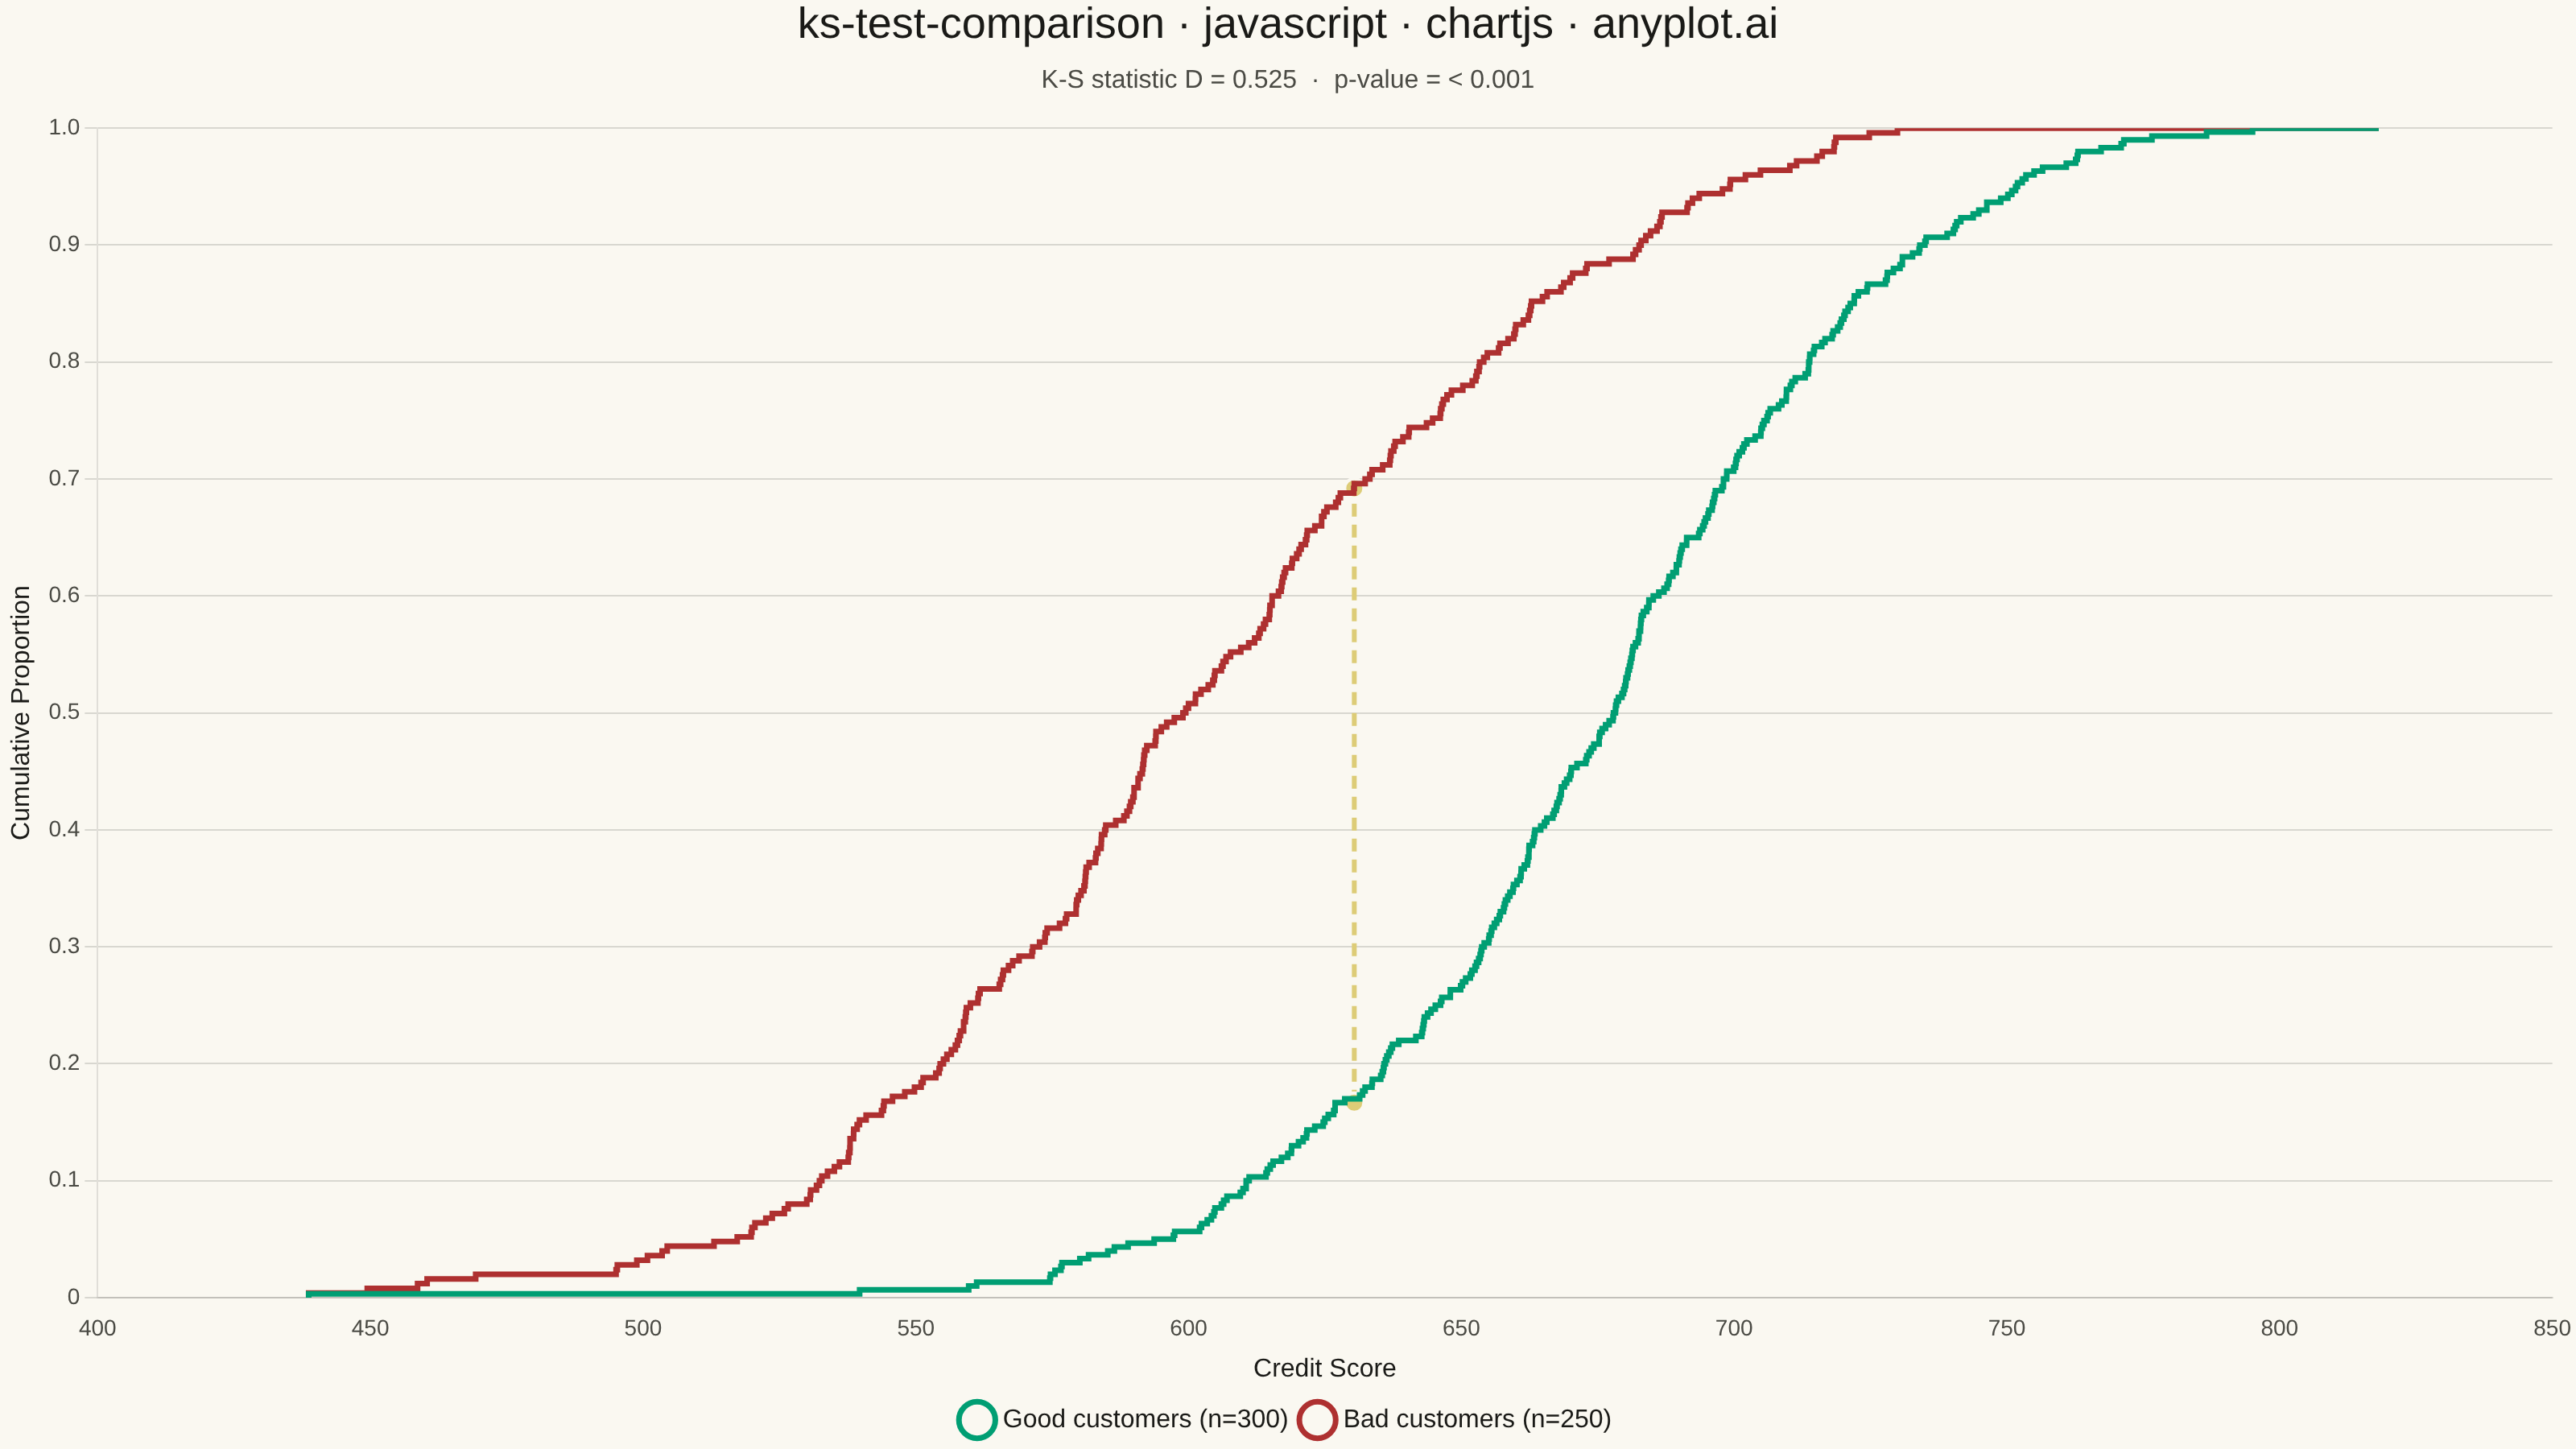
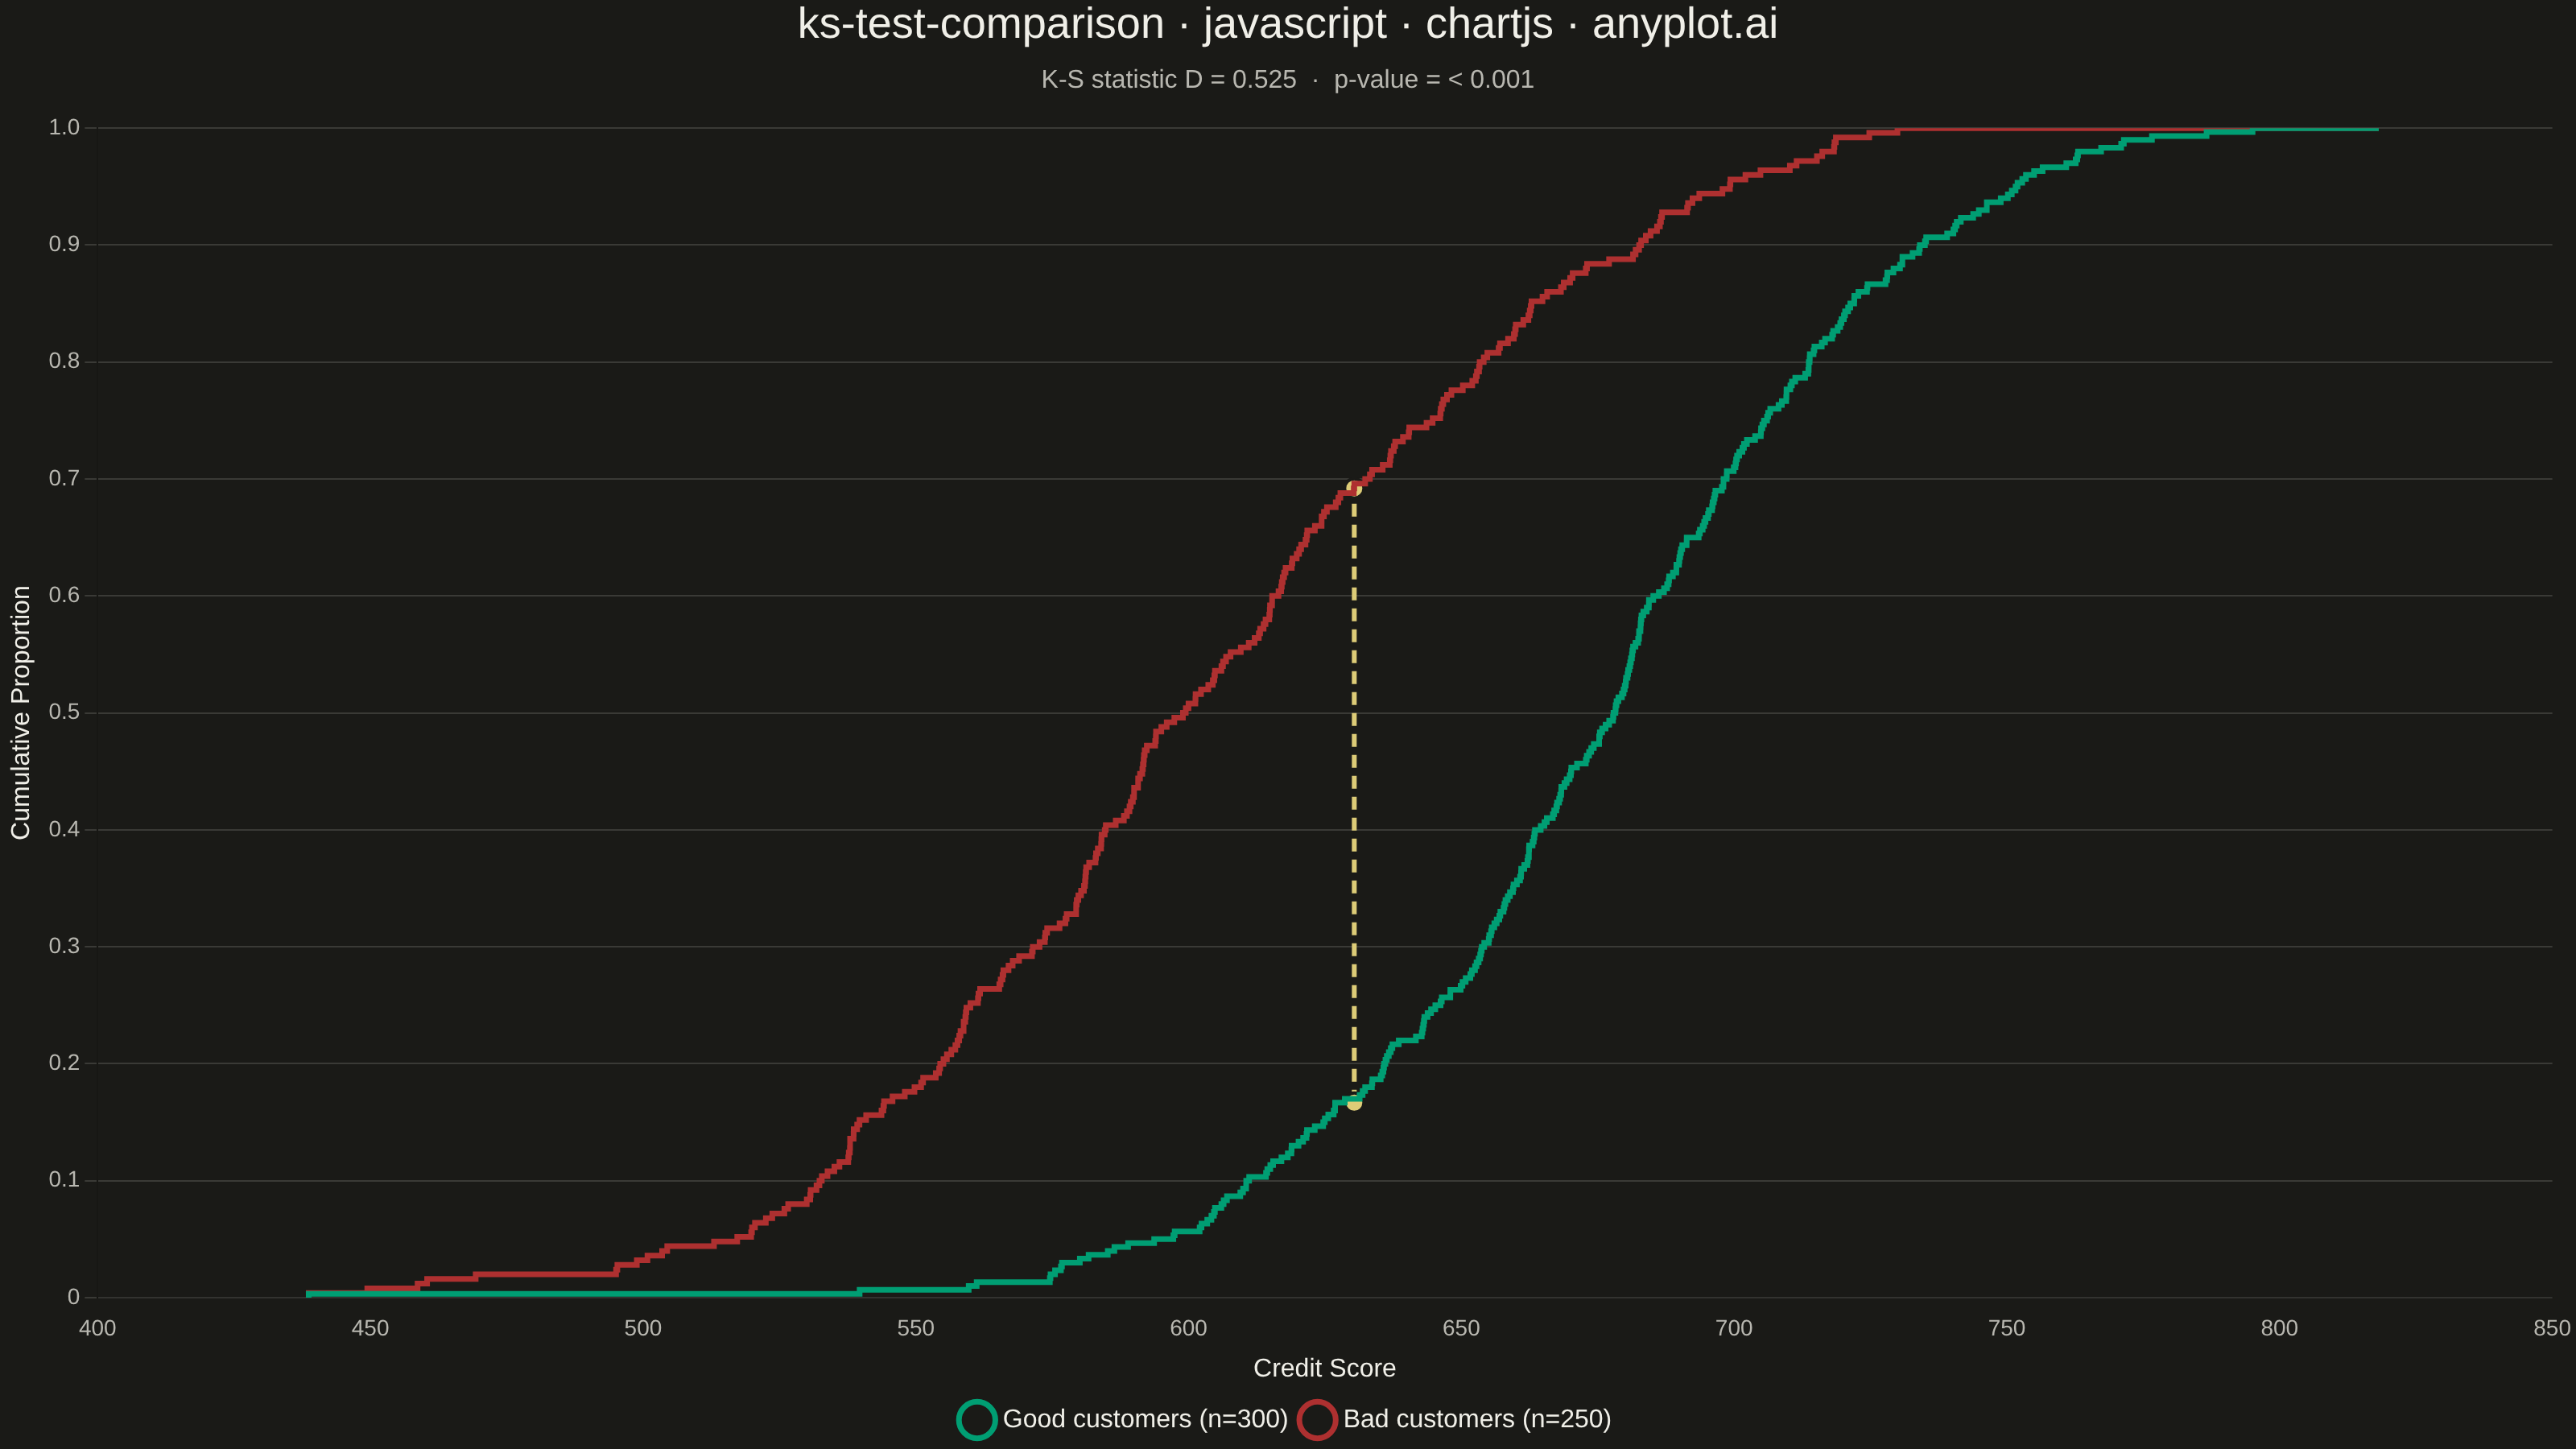
A Kolmogorov-Smirnov (K-S) plot compares two empirical cumulative distribution functions (ECDFs) and visualizes the K-S statistic, which is the maximum vertical distance between the two distributions. The plot displays both ECDFs as step functions, highlights the point of maximum divergence, and typically reports the K-S statistic value and p-value for hypothesis testing. This visualization is essential for determining whether two samples come from the same underlying distribution.
// anyplot.ai
// ks-test-comparison: Kolmogorov-Smirnov Plot for Distribution Comparison
// Library: chartjs 4.4.7 | JavaScript 22.23.2
// Quality: 89/100 | Created: 2026-08-26

const t = window.ANYPLOT_TOKENS;

// --- Data (in-memory, deterministic LCG + Box-Muller) -----------------------
function lcg(seed) {
  let state = seed >>> 0;
  return function () {
    state = (1103515245 * state + 12345) >>> 0;
    return state / 4294967296;
  };
}
const rand = lcg(42);
function randNormal() {
  const u1 = Math.max(rand(), 1e-12);
  const u2 = rand();
  return Math.sqrt(-2 * Math.log(u1)) * Math.cos(2 * Math.PI * u2);
}
function clamp(v, lo, hi) {
  return Math.min(Math.max(v, lo), hi);
}

const n1 = 300;
const n2 = 250;
const goodScores = Array.from({ length: n1 }, () => clamp(680 + 45 * randNormal(), 300, 850)).sort((a, b) => a - b);
const badScores = Array.from({ length: n2 }, () => clamp(610 + 55 * randNormal(), 300, 850)).sort((a, b) => a - b);

// --- ECDF step coordinates ---------------------------------------------------
const xMin = Math.min(goodScores[0], badScores[0]);
const xMax = Math.max(goodScores[n1 - 1], badScores[n2 - 1]);
const pad = (xMax - xMin) * 0.03;

function ecdfSteps(sorted) {
  const n = sorted.length;
  const pts = [{ x: xMin - pad, y: 0 }];
  sorted.forEach((v, i) => pts.push({ x: v, y: (i + 1) / n }));
  pts.push({ x: xMax + pad, y: 1 });
  return pts;
}

function ecdfAt(sorted, x) {
  let lo = 0;
  let hi = sorted.length;
  while (lo < hi) {
    const mid = (lo + hi) >> 1;
    if (sorted[mid] <= x) lo = mid + 1;
    else hi = mid;
  }
  return lo / sorted.length;
}

// --- K-S statistic: max |ECDF1 - ECDF2|, evaluated at every sample value ----
let ksD = 0;
let ksX = goodScores[0];
goodScores.concat(badScores).forEach((x) => {
  const diff = Math.abs(ecdfAt(goodScores, x) - ecdfAt(badScores, x));
  if (diff > ksD) {
    ksD = diff;
    ksX = x;
  }
});
const ksYGood = ecdfAt(goodScores, ksX);
const ksYBad = ecdfAt(badScores, ksX);

// Two-sample K-S asymptotic p-value (Kolmogorov distribution series)
function ksPValue(d, sizeA, sizeB) {
  const nEff = (sizeA * sizeB) / (sizeA + sizeB);
  const en = Math.sqrt(nEff);
  const lambda = (en + 0.12 + 0.11 / en) * d;
  let sum = 0;
  for (let k = 1; k <= 100; k++) {
    sum += (k % 2 === 0 ? -1 : 1) * Math.exp(-2 * k * k * lambda * lambda);
  }
  return clamp(2 * sum, 0, 1);
}
const pValue = ksPValue(ksD, n1, n2);
const pLabel = pValue < 0.001 ? "< 0.001" : pValue.toFixed(3);

// --- Mount --------------------------------------------------------------
const canvas = document.createElement("canvas");
document.getElementById("container").appendChild(canvas);

// --- Chart ----------------------------------------------------------------
new Chart(canvas, {
  type: "line",
  data: {
    datasets: [
      {
        label: `Good customers (n=${n1})`,
        data: ecdfSteps(goodScores),
        stepped: "after",
        borderColor: t.palette[0],
        backgroundColor: "transparent",
        borderWidth: 3.5,
        pointRadius: 0,
        fill: false,
      },
      {
        label: `Bad customers (n=${n2})`,
        data: ecdfSteps(badScores),
        stepped: "after",
        borderColor: t.palette[4],
        backgroundColor: "transparent",
        borderWidth: 3.5,
        pointRadius: 0,
        fill: false,
      },
      {
        label: `Max distance D = ${ksD.toFixed(3)}`,
        data: [
          { x: ksX, y: ksYGood },
          { x: ksX, y: ksYBad },
        ],
        borderColor: t.amber,
        backgroundColor: t.amber,
        borderWidth: 3,
        borderDash: [8, 5],
        pointRadius: 6,
        pointBackgroundColor: t.amber,
        pointBorderColor: t.pageBg,
        pointBorderWidth: 2,
        fill: false,
      },
    ],
  },
  options: {
    responsive: true,
    maintainAspectRatio: false,
    animation: false,
    plugins: {
      title: {
        display: true,
        text: "ks-test-comparison · javascript · chartjs · anyplot.ai",
        color: t.ink,
        font: { size: 27, weight: "500" },
        padding: { bottom: 8 },
      },
      subtitle: {
        display: true,
        text: `K-S statistic D = ${ksD.toFixed(3)}  ·  p-value = ${pLabel}`,
        color: t.inkSoft,
        font: { size: 16 },
        padding: { bottom: 20 },
      },
      legend: {
        position: "bottom",
        labels: {
          color: t.ink,
          font: { size: 16 },
          usePointStyle: true,
          filter: (item) => item.datasetIndex < 2,
        },
      },
      tooltip: {
        callbacks: {
          title: (items) => `Credit score ${Math.round(items[0].parsed.x)}`,
          label: (item) =>
            item.datasetIndex === 2
              ? `Max divergence: D = ${ksD.toFixed(3)}`
              : `${item.dataset.label.replace(/\s*\(n=\d+\)/, "")}: ${(item.parsed.y * 100).toFixed(1)}% cumulative`,
        },
      },
    },
    scales: {
      x: {
        type: "linear",
        title: { display: true, text: "Credit Score", color: t.ink, font: { size: 16 } },
        ticks: { color: t.inkSoft, font: { size: 14 } },
        grid: { display: false },
      },
      y: {
        min: 0,
        max: 1,
        title: { display: true, text: "Cumulative Proportion", color: t.ink, font: { size: 16 } },
        ticks: { color: t.inkSoft, font: { size: 14 } },
        grid: { color: t.grid },
      },
    },
  },
});
Runnable source as JSON, for any HTTP client: https://api.anyplot.ai/specs/ks-test-comparison/chartjs/code. Any spec id and library id listed in llms-full.txt fit the same URL shape; every URL below is complete and callable.
{
  "spec_id": "ks-test-comparison",
  "language": "javascript",
  "library": "chartjs",
  "page": "https://anyplot.ai/ks-test-comparison/javascript/chartjs",
  "hub": "https://anyplot.ai/ks-test-comparison",
  "code_json": "https://api.anyplot.ai/specs/ks-test-comparison/chartjs/code",
  "spec_json": "https://api.anyplot.ai/specs/ks-test-comparison",
  "render_light_png": "https://storage.googleapis.com/anyplot-images/plots/ks-test-comparison/javascript/chartjs/plot-light.png",
  "render_dark_png": "https://storage.googleapis.com/anyplot-images/plots/ks-test-comparison/javascript/chartjs/plot-dark.png",
  "interactive_light_html": "https://storage.googleapis.com/anyplot-images/plots/ks-test-comparison/javascript/chartjs/plot-light.html",
  "interactive_dark_html": "https://storage.googleapis.com/anyplot-images/plots/ks-test-comparison/javascript/chartjs/plot-dark.html",
  "quality_score": 89.0,
  "license": "MIT",
  "guide": "https://anyplot.ai/llms.txt"
}
Part of Kolmogorov-Smirnov Plot for Distribution Comparison on anyplot.ai.