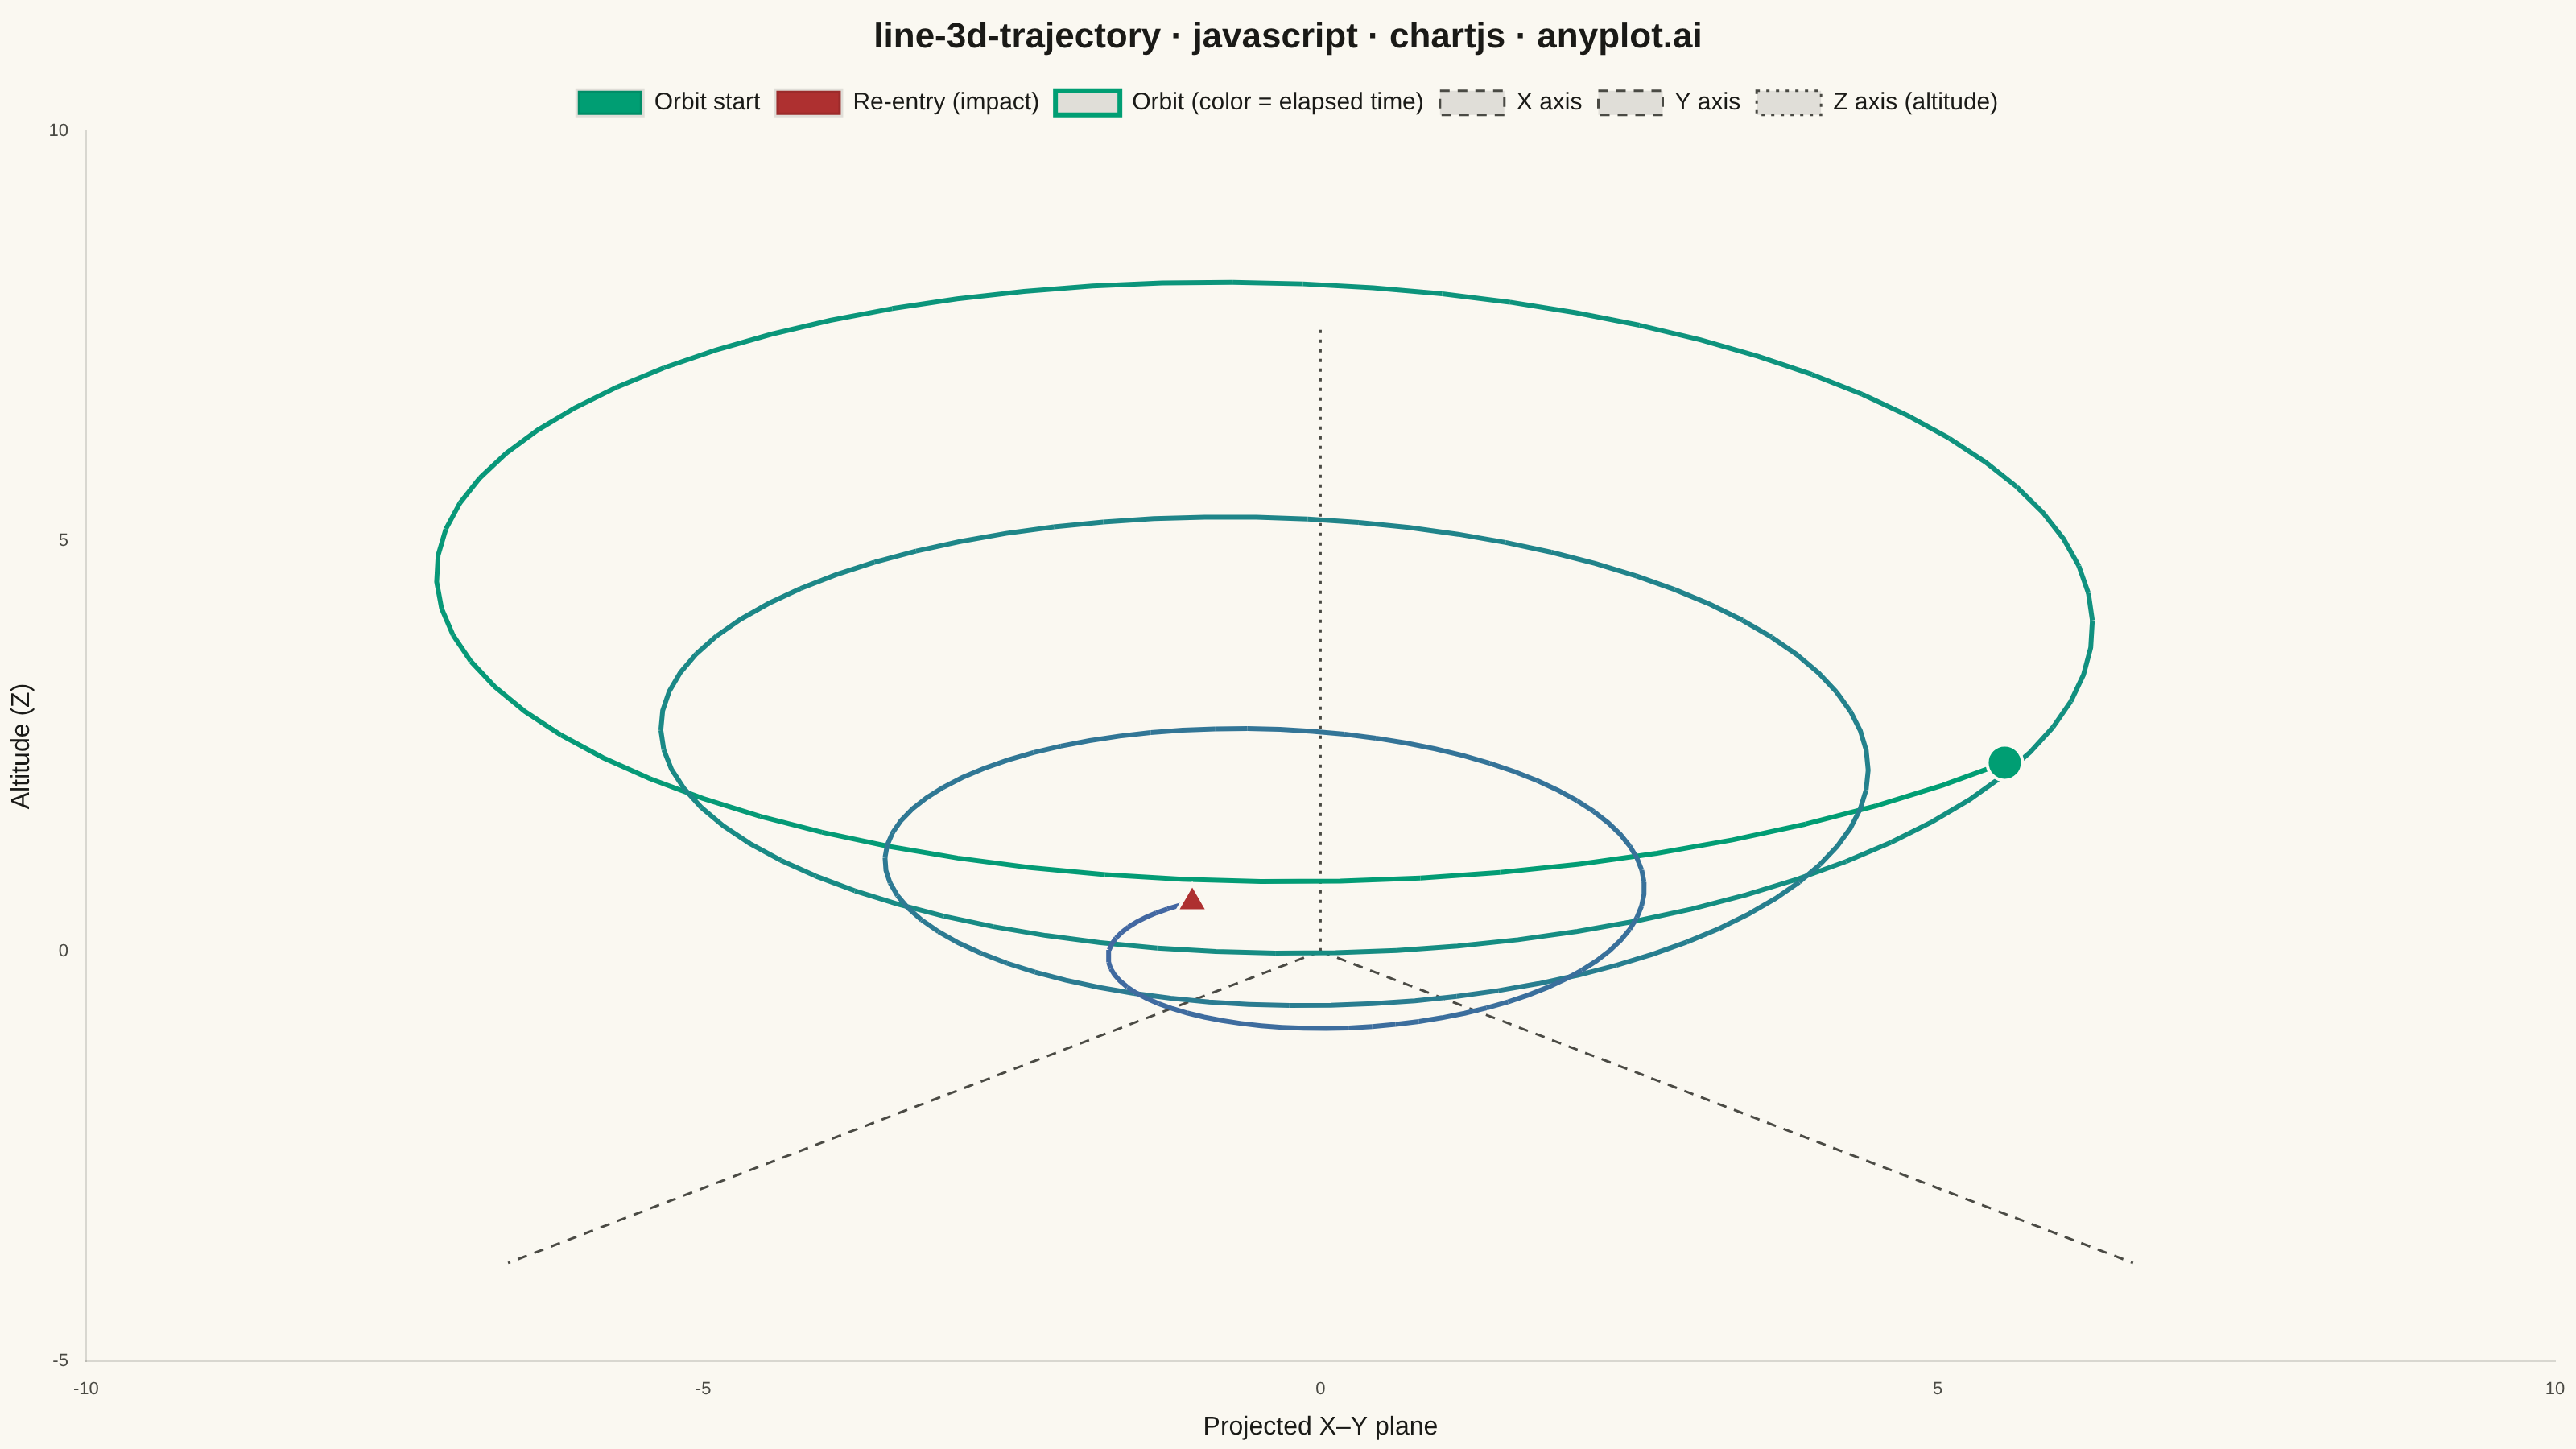
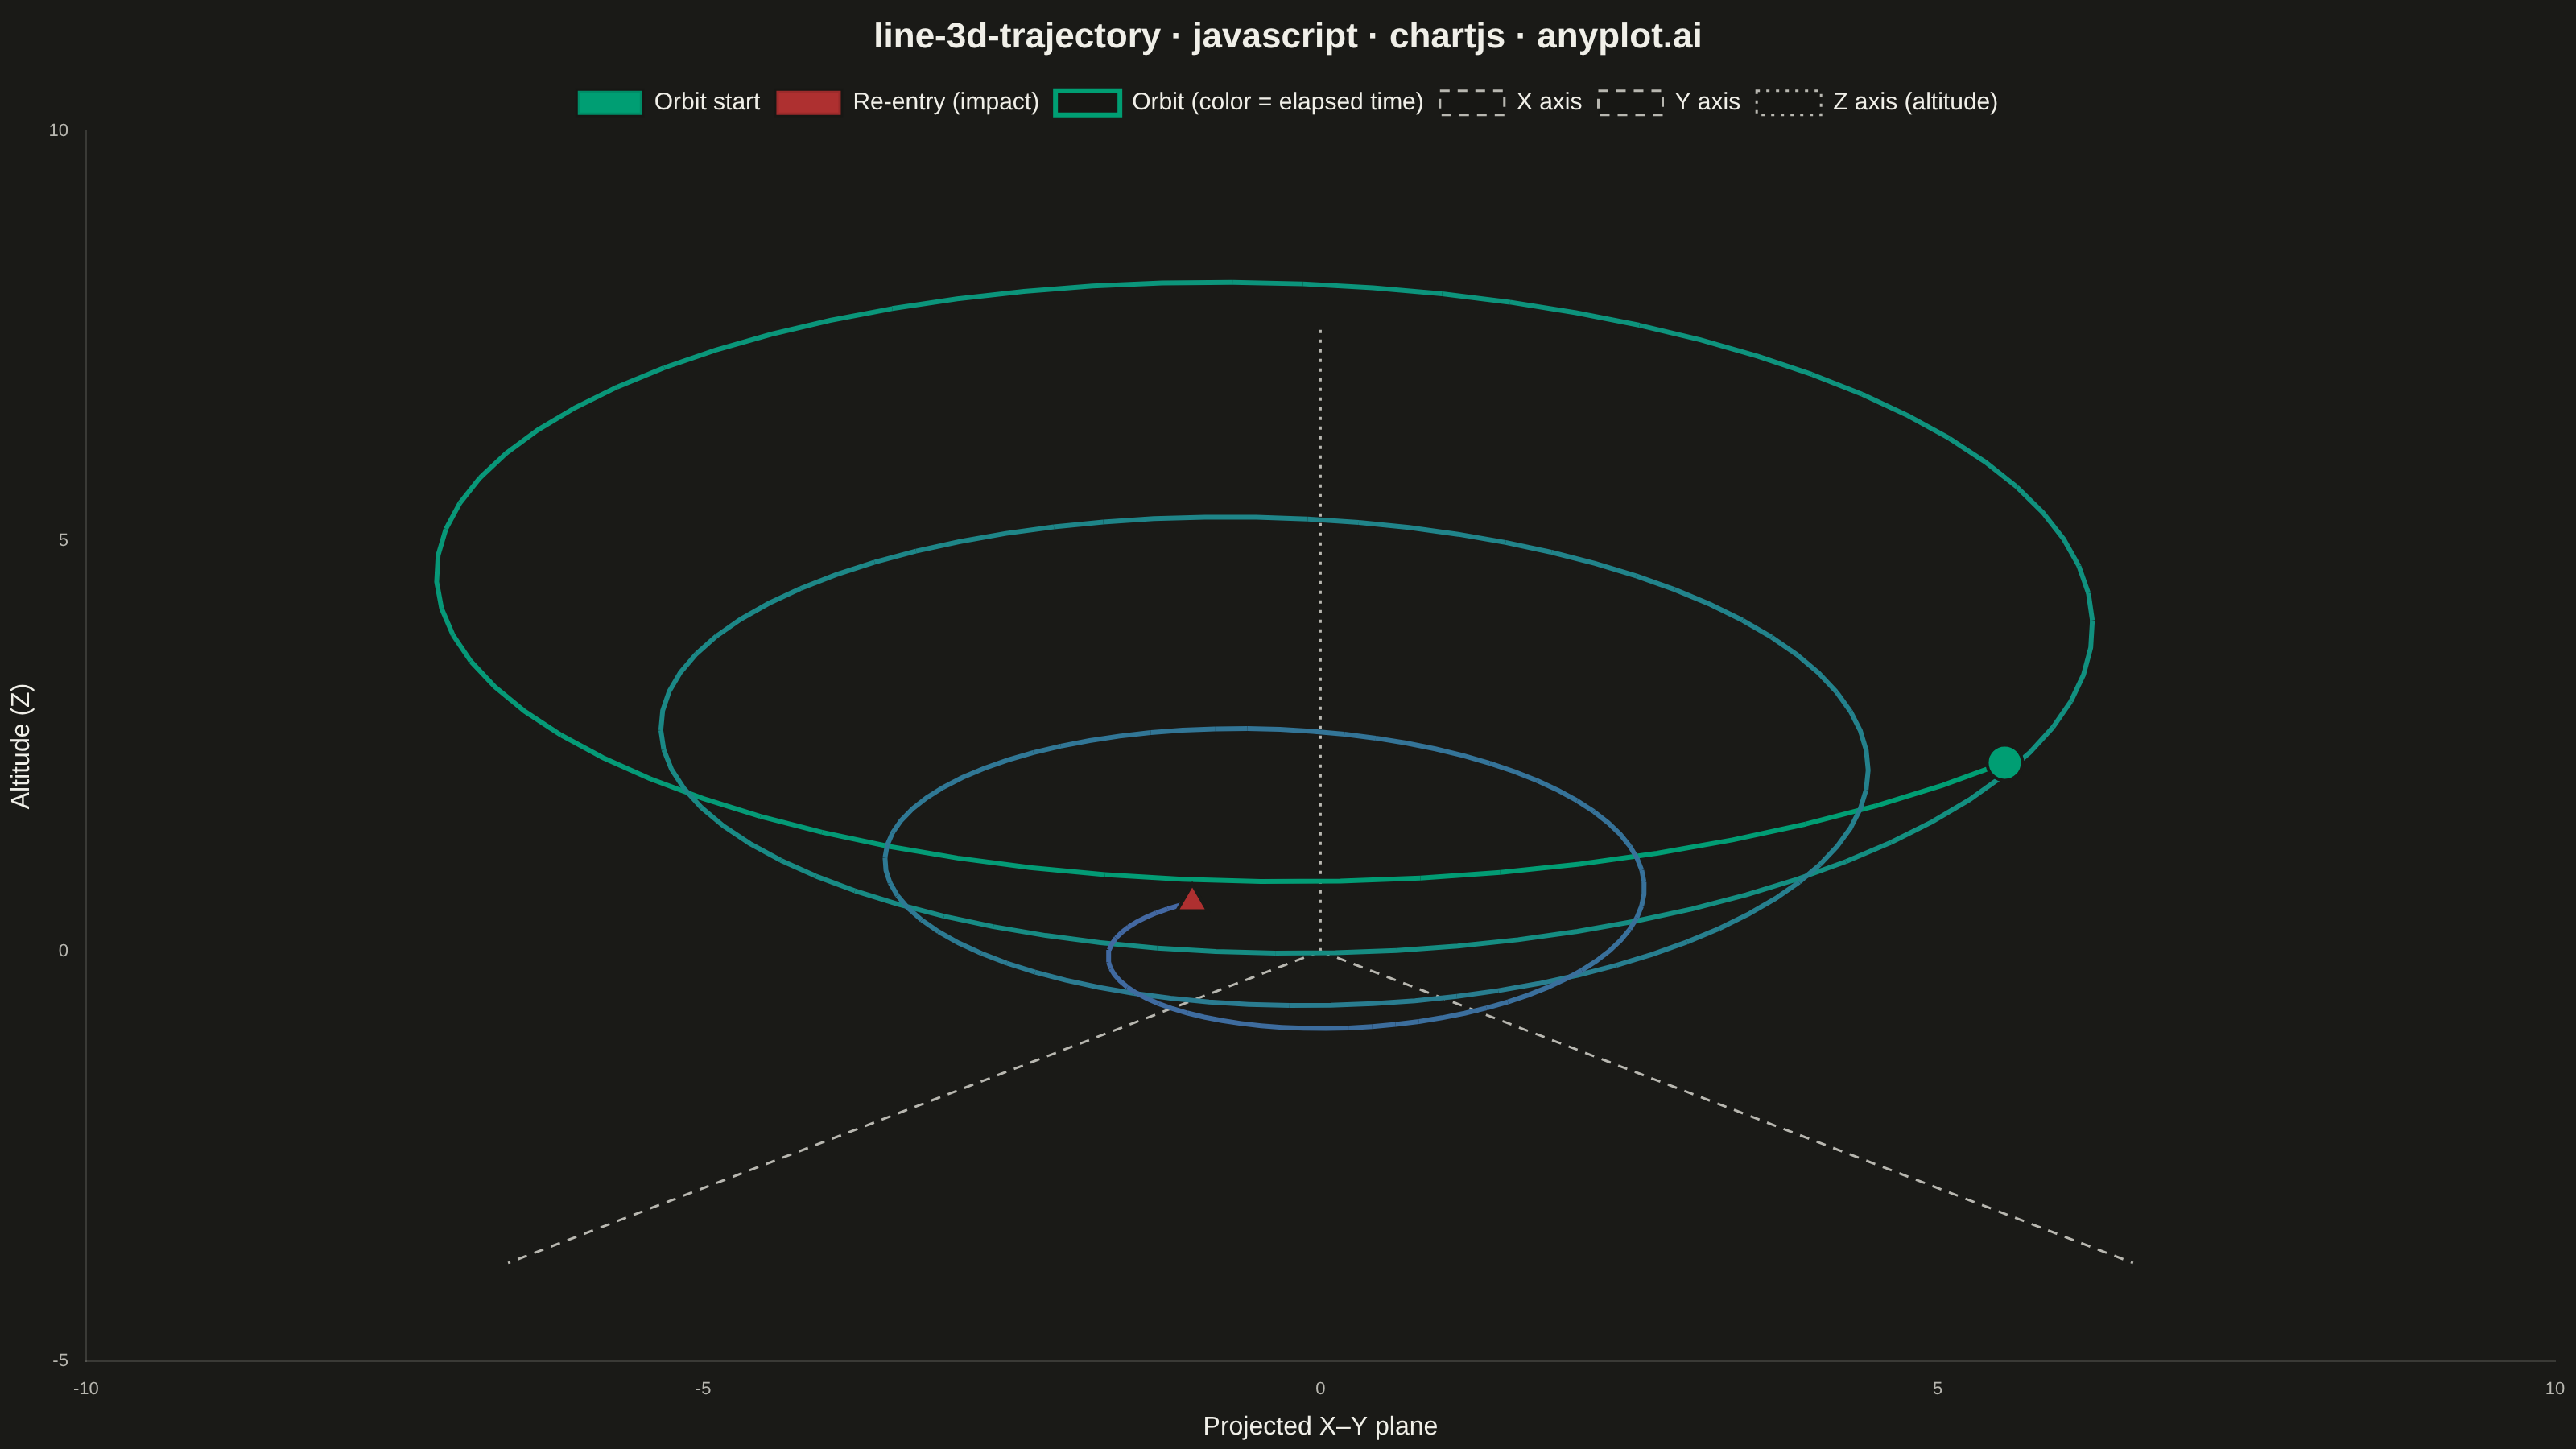
The same plot in 13 other libraries — JavaScript: D3.js, Apache ECharts, Highcharts, MUI X Charts; Python: Altair, Bokeh, lets-plot, Matplotlib, Plotly, Pygal, Seaborn; R: ggplot2; Julia: Makie.jl. Compare all 14 side by side: 3D Line Plot for Trajectory Visualization in Python, R, Julia and JavaScript.
A 3D line plot that displays paths, trajectories, or curves as connected lines in three-dimensional space. Unlike scatter plots that show discrete points, this visualization connects data points sequentially to reveal continuous paths, making it ideal for understanding motion, mathematical curves, and temporal evolution in 3D. Interactive rotation is essential for exploring the spatial structure of complex trajectories.
// anyplot.ai
// line-3d-trajectory: 3D Line Plot for Trajectory Visualization
// Library: chartjs 4.4.7 | JavaScript 22.23.2
// Quality: 87/100 | Created: 2026-09-10

//# anyplot-orientation: landscape
const t = window.ANYPLOT_TOKENS;

// --- Data: a decaying satellite orbit spiraling toward re-entry -----------
// Chart.js has no native 3D chart type, so the (x, y, z) trajectory is
// projected onto the 2D canvas with a fixed isometric transform before it is
// handed to a standard line dataset — the same approach a static 3D plot
// uses internally, just computed by hand instead of by a 3D engine.
const POINT_COUNT = 260;
const REVOLUTIONS = 3.5;
const RADIUS_START = 6.4;
const RADIUS_END = 1.2;
const ALTITUDE_START = 5.5;
const COS30 = Math.cos(Math.PI / 6);
const SIN30 = Math.sin(Math.PI / 6);

function project(x, y, z) {
  return { x: (x - y) * COS30, y: z - (x + y) * SIN30 };
}

const trajectory = [];
for (let i = 0; i < POINT_COUNT; i++) {
  const progress = i / (POINT_COUNT - 1);
  const angle = progress * REVOLUTIONS * 2 * Math.PI;
  const radius = RADIUS_START - (RADIUS_START - RADIUS_END) * progress;
  const origX = radius * Math.cos(angle);
  const origY = radius * Math.sin(angle);
  const origZ = ALTITUDE_START * Math.pow(1 - progress, 1.3);
  trajectory.push({
    ...project(origX, origY, origZ),
    origX,
    origY,
    origZ,
    progress,
  });
}

const origin = { ...project(0, 0, 0), origX: 0, origY: 0, origZ: 0 };
const axisLength = RADIUS_START + 1.2;
const xAxisEnd = {
  ...project(axisLength, 0, 0),
  origX: axisLength,
  origY: 0,
  origZ: 0,
};
const yAxisEnd = {
  ...project(0, axisLength, 0),
  origX: 0,
  origY: axisLength,
  origZ: 0,
};
const zAxisEnd = {
  ...project(0, 0, axisLength),
  origX: 0,
  origY: 0,
  origZ: axisLength,
};

// --- Color: elapsed time mapped through the Imprint sequential scale ------
function lerpChannel(a, b, ratio) {
  return Math.round(a + (b - a) * ratio);
}
function lerpColor(hexA, hexB, ratio) {
  const a = parseInt(hexA.slice(1), 16);
  const b = parseInt(hexB.slice(1), 16);
  const r = lerpChannel((a >> 16) & 255, (b >> 16) & 255, ratio);
  const g = lerpChannel((a >> 8) & 255, (b >> 8) & 255, ratio);
  const bl = lerpChannel(a & 255, b & 255, ratio);
  return `rgb(${r}, ${g}, ${bl})`;
}

// --- Mount ------------------------------------------------------------------
const canvas = document.createElement("canvas");
document.getElementById("container").appendChild(canvas);

// --- Chart -------------------------------------------------------------------
new Chart(canvas, {
  type: "line",
  data: {
    datasets: [
      {
        label: "X axis",
        data: [origin, xAxisEnd],
        borderColor: t.inkSoft,
        borderWidth: 1.5,
        borderDash: [6, 5],
        pointRadius: 0,
        order: 3,
      },
      {
        label: "Y axis",
        data: [origin, yAxisEnd],
        borderColor: t.inkSoft,
        borderWidth: 1.5,
        borderDash: [6, 5],
        pointRadius: 0,
        order: 3,
      },
      {
        label: "Z axis (altitude)",
        data: [origin, zAxisEnd],
        borderColor: t.inkSoft,
        borderWidth: 1.5,
        borderDash: [2, 4],
        pointRadius: 0,
        order: 3,
      },
      {
        label: "Orbit (color = elapsed time)",
        data: trajectory,
        borderColor: t.palette[0],
        borderWidth: 3,
        pointRadius: 0,
        tension: 0,
        segment: {
          borderColor: (ctx) => {
            const p0 = trajectory[ctx.p0DataIndex];
            const p1 = trajectory[ctx.p1DataIndex];
            const avgProgress = (p0.progress + p1.progress) / 2;
            return lerpColor(t.seq[0], t.seq[1], avgProgress);
          },
        },
        order: 2,
      },
      {
        label: "Orbit start",
        data: [trajectory[0]],
        showLine: false,
        pointRadius: 11,
        backgroundColor: t.palette[0],
        pointBackgroundColor: t.palette[0],
        pointBorderColor: t.pageBg,
        pointBorderWidth: 2,
        order: 1,
      },
      {
        label: "Re-entry (impact)",
        data: [trajectory[trajectory.length - 1]],
        showLine: false,
        pointRadius: 11,
        pointStyle: "triangle",
        backgroundColor: t.palette[4],
        pointBackgroundColor: t.palette[4],
        pointBorderColor: t.pageBg,
        pointBorderWidth: 2,
        order: 1,
      },
    ],
  },
  options: {
    responsive: true,
    maintainAspectRatio: false,
    animation: false,
    parsing: { xAxisKey: "x", yAxisKey: "y" },
    plugins: {
      title: {
        display: true,
        text: "line-3d-trajectory · javascript · chartjs · anyplot.ai",
        color: t.ink,
        font: { size: 22 },
      },
      legend: {
        labels: { color: t.ink, font: { size: 15 } },
      },
      tooltip: {
        callbacks: {
          label: (ctx) => {
            const p = ctx.raw;
            return `x=${p.origX.toFixed(2)}, y=${p.origY.toFixed(2)}, z=${p.origZ.toFixed(2)}`;
          },
        },
      },
    },
    scales: {
      x: {
        type: "linear",
        grid: { display: false },
        border: { color: t.grid },
        ticks: {
          display: true,
          color: t.inkSoft,
          font: { size: 11 },
          maxTicksLimit: 5,
        },
        title: {
          display: true,
          text: "Projected X–Y plane",
          color: t.ink,
          font: { size: 16 },
        },
      },
      y: {
        type: "linear",
        grid: { display: false },
        border: { color: t.grid },
        ticks: {
          display: true,
          color: t.inkSoft,
          font: { size: 11 },
          maxTicksLimit: 5,
        },
        title: {
          display: true,
          text: "Altitude (Z)",
          color: t.ink,
          font: { size: 16 },
        },
      },
    },
  },
});
Runnable source as JSON, for any HTTP client: https://api.anyplot.ai/specs/line-3d-trajectory/chartjs/code. Any spec id and library id listed in llms-full.txt fit the same URL shape; every URL below is complete and callable.
{
  "spec_id": "line-3d-trajectory",
  "language": "javascript",
  "library": "chartjs",
  "page": "https://anyplot.ai/line-3d-trajectory/javascript/chartjs",
  "hub": "https://anyplot.ai/line-3d-trajectory",
  "code_json": "https://api.anyplot.ai/specs/line-3d-trajectory/chartjs/code",
  "spec_json": "https://api.anyplot.ai/specs/line-3d-trajectory",
  "render_light_png": "https://storage.googleapis.com/anyplot-images/plots/line-3d-trajectory/javascript/chartjs/plot-light.png",
  "render_dark_png": "https://storage.googleapis.com/anyplot-images/plots/line-3d-trajectory/javascript/chartjs/plot-dark.png",
  "interactive_light_html": "https://storage.googleapis.com/anyplot-images/plots/line-3d-trajectory/javascript/chartjs/plot-light.html",
  "interactive_dark_html": "https://storage.googleapis.com/anyplot-images/plots/line-3d-trajectory/javascript/chartjs/plot-dark.html",
  "quality_score": 87.0,
  "license": "MIT",
  "guide": "https://anyplot.ai/llms.txt"
}
Part of 3D Line Plot for Trajectory Visualization on anyplot.ai.