The same plot in 13 other libraries — JavaScript: Chart.js, D3.js, Highcharts, MUI X Charts; Python: Altair, Bokeh, lets-plot, Matplotlib, Plotly, Pygal, Seaborn; R: ggplot2; Julia: Makie.jl. Compare all 14 side by side: 3D Line Plot for Trajectory Visualization in Python, R, Julia and JavaScript.
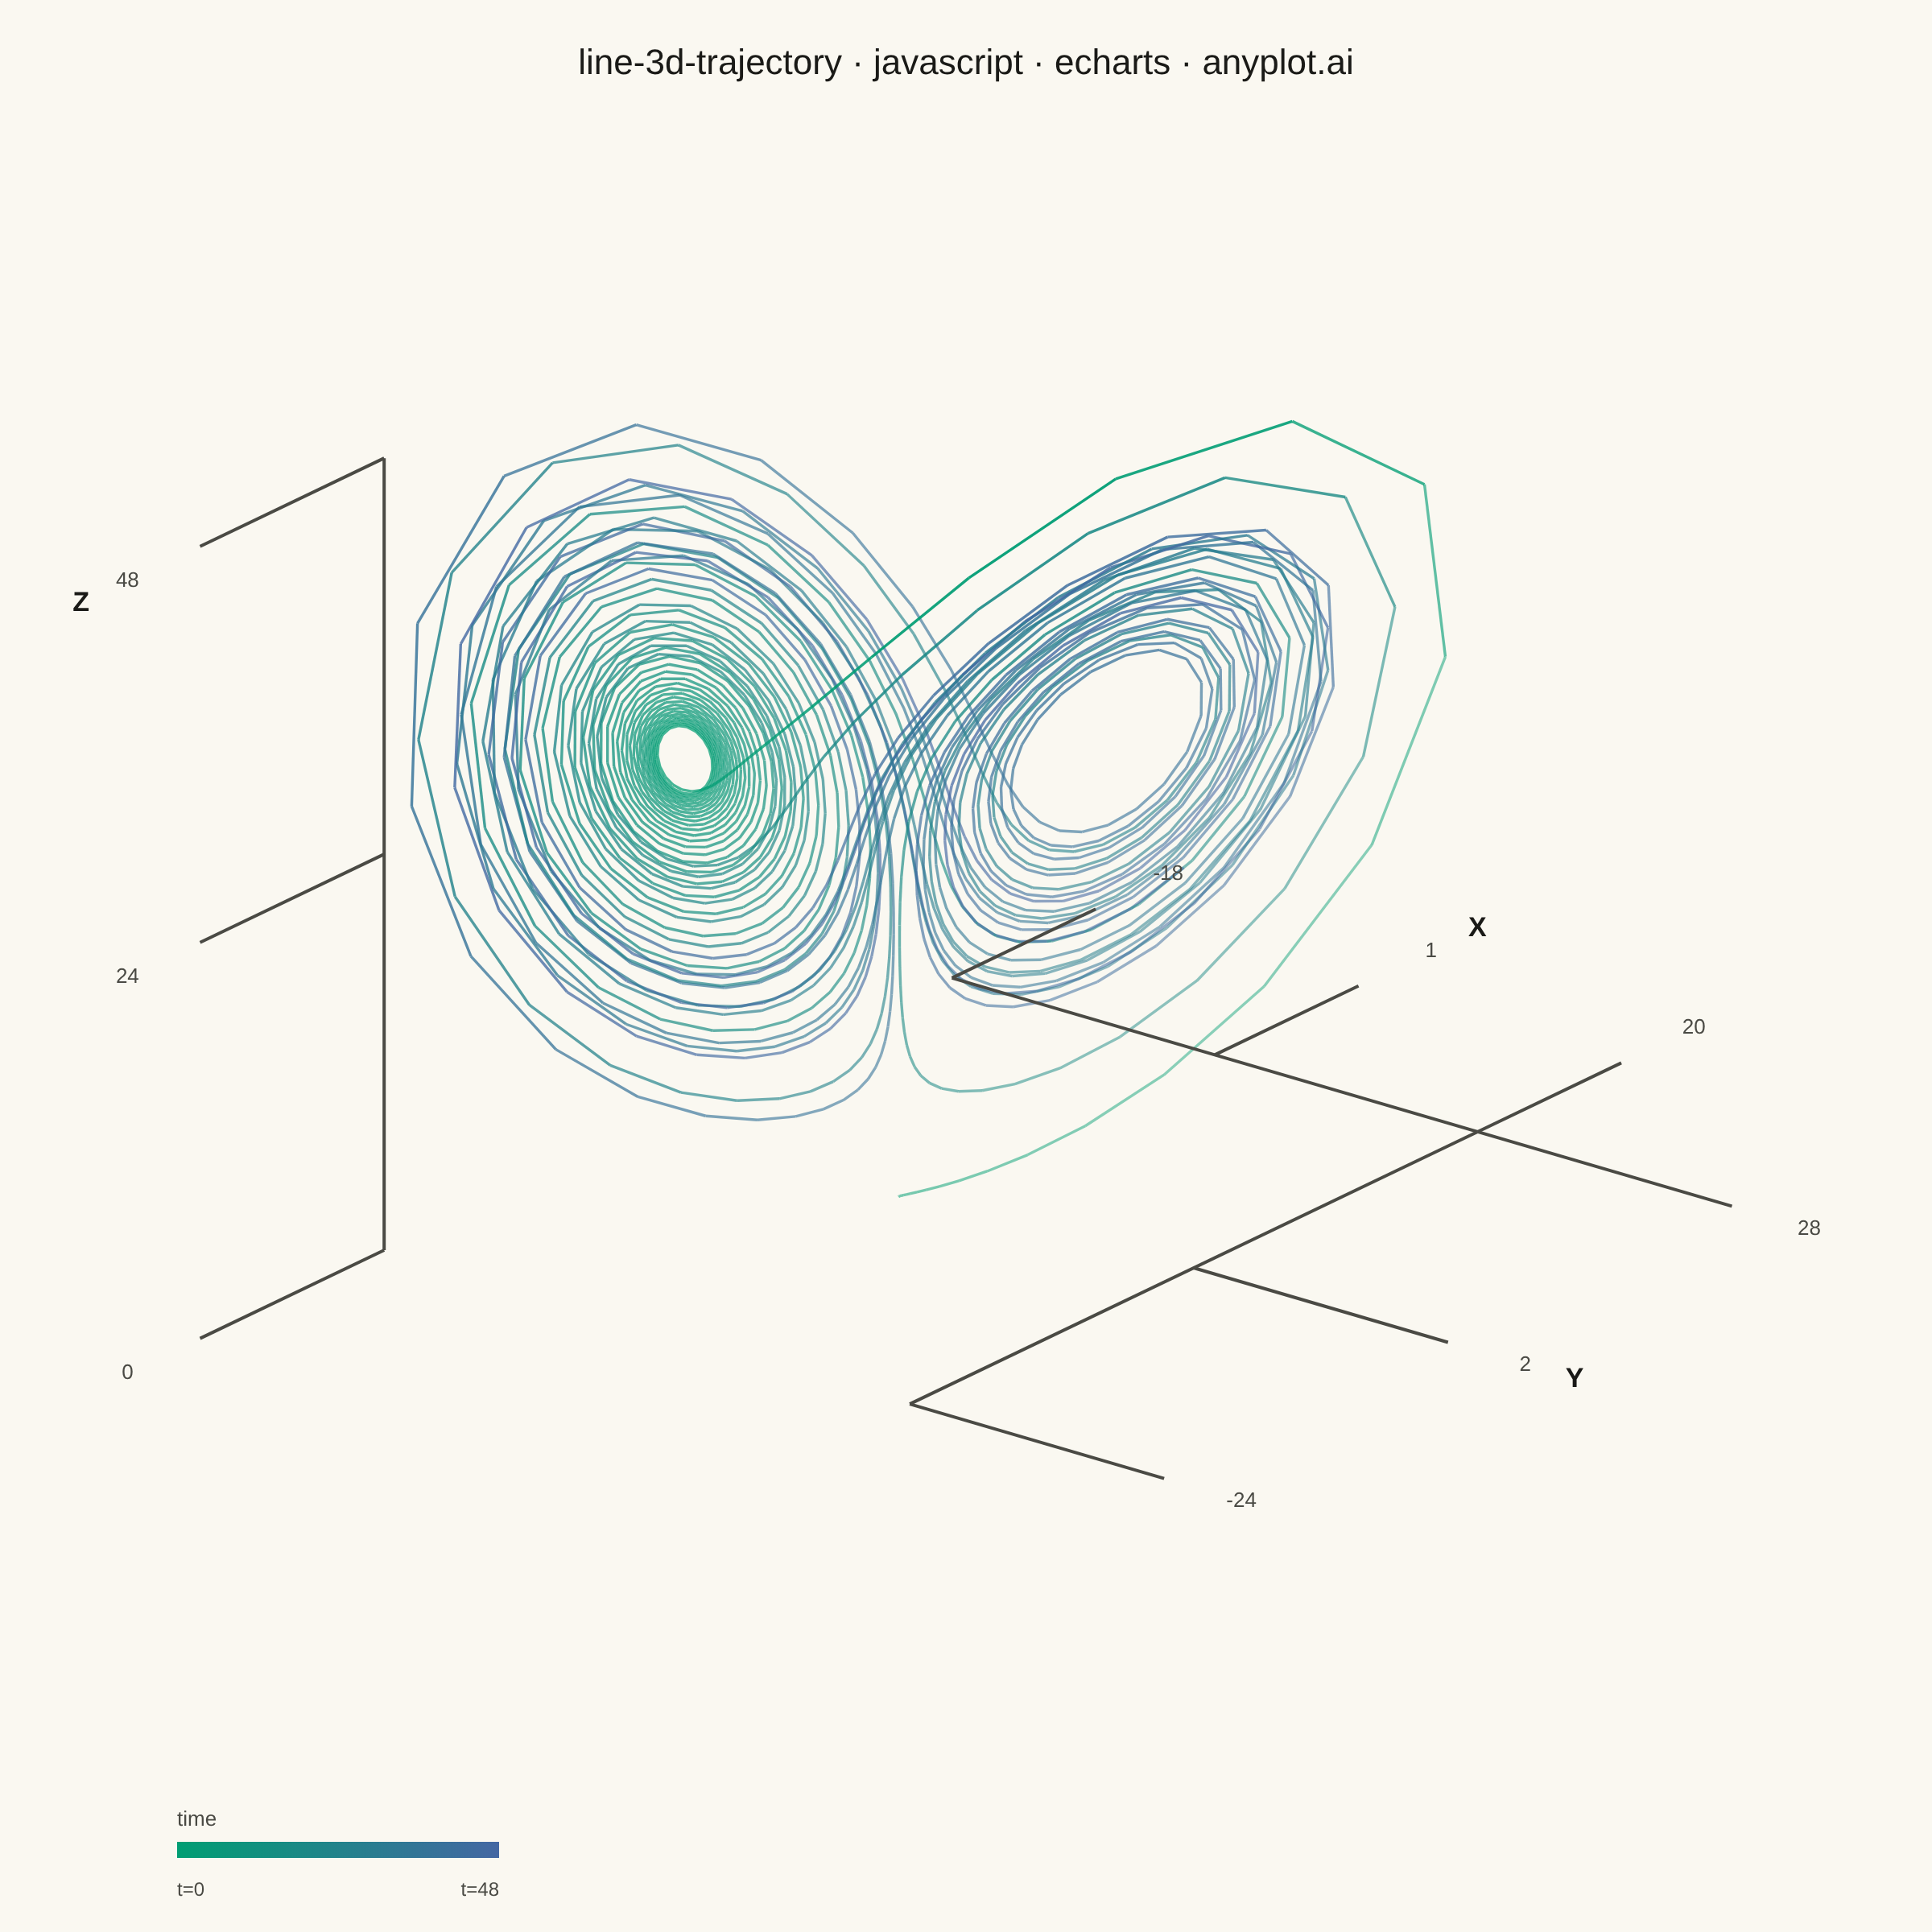
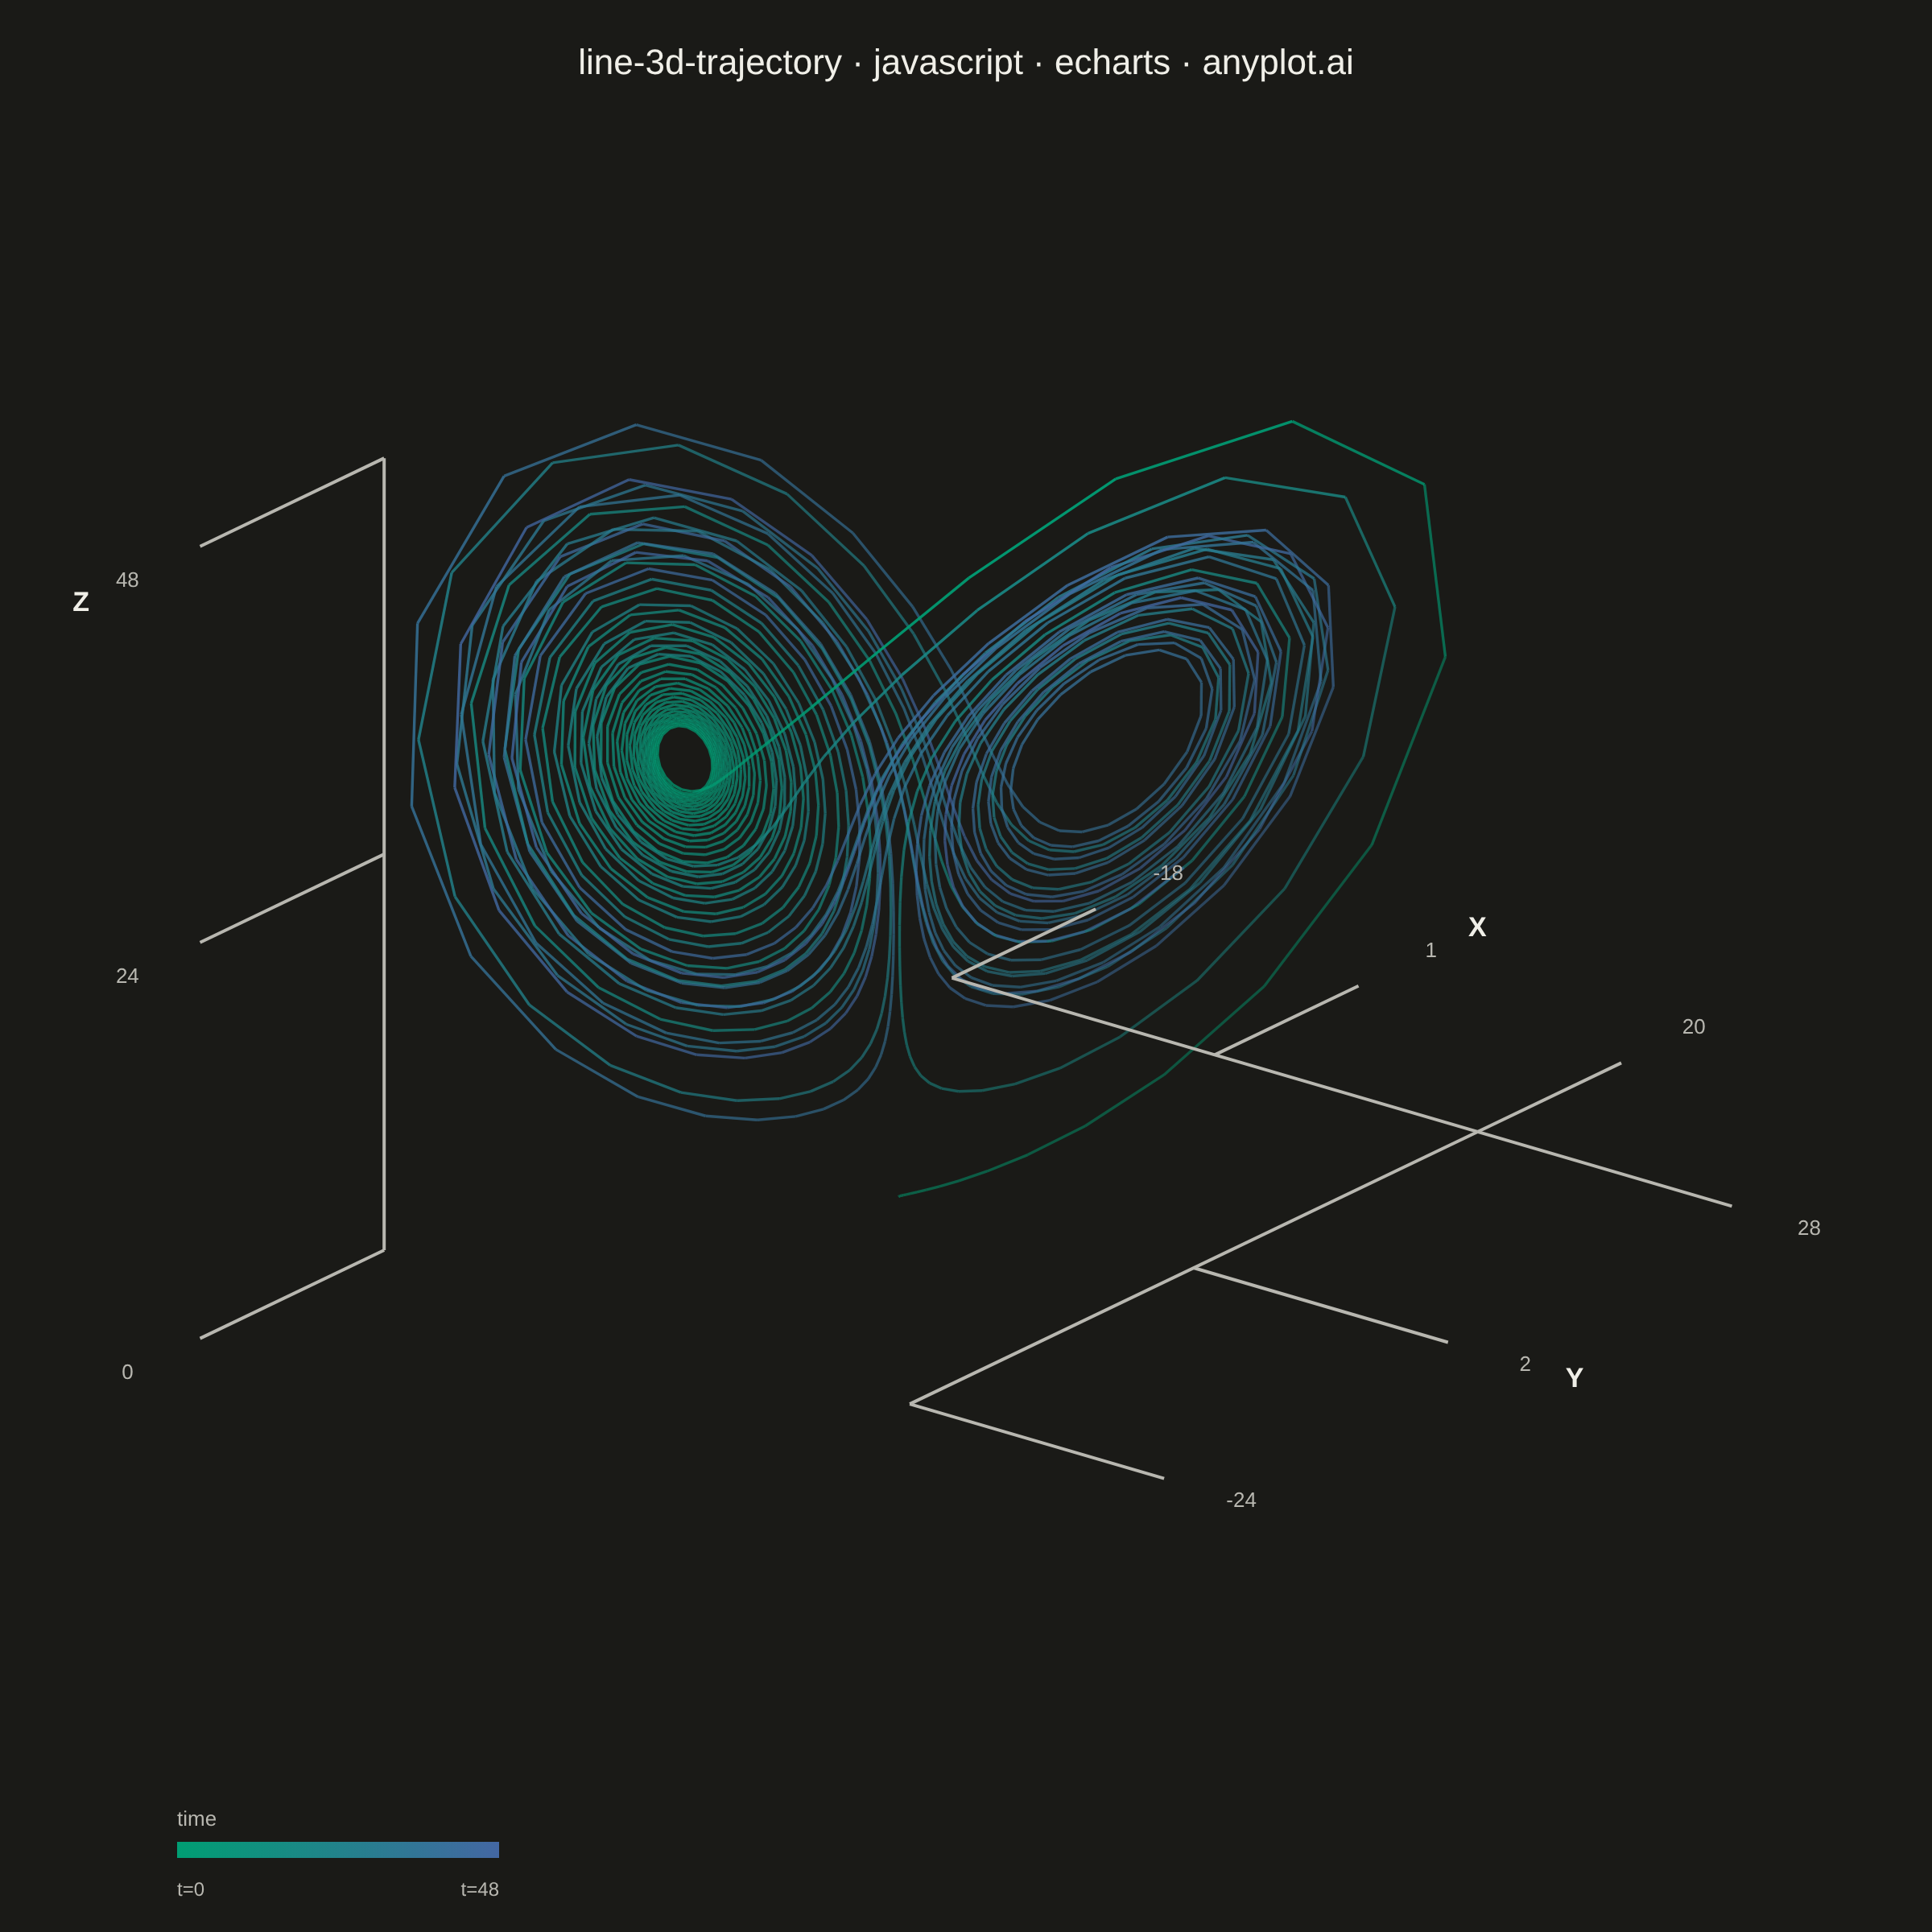
A 3D line plot that displays paths, trajectories, or curves as connected lines in three-dimensional space. Unlike scatter plots that show discrete points, this visualization connects data points sequentially to reveal continuous paths, making it ideal for understanding motion, mathematical curves, and temporal evolution in 3D. Interactive rotation is essential for exploring the spatial structure of complex trajectories.
// anyplot.ai
// line-3d-trajectory: 3D Line Plot for Trajectory Visualization
// Library: echarts 6.1.0 | JavaScript 22.23.2
// Quality: 88/100 | Created: 2026-09-10

//# anyplot-orientation: square
const t = window.ANYPLOT_TOKENS;
const size = window.ANYPLOT_SIZE;

// --- Data: Lorenz attractor, integrated with RK4 ----------------------------
// Classic chaotic system (sigma, rho, beta) — a canonical example of a 3D
// trajectory whose spatial structure (the two "wings") only reads correctly
// with real depth cues, which is exactly what interactive rotation gives a
// viewer and a flat projection has to approximate.
const SIGMA = 10;
const RHO = 28;
const BETA = 8 / 3;
const DT = 0.008;
const STEPS = 6000;

function lorenzDerivative(x, y, z) {
  return [SIGMA * (y - x), x * (RHO - z) - y, x * y - BETA * z];
}

function rk4Step(x, y, z) {
  const [k1x, k1y, k1z] = lorenzDerivative(x, y, z);
  const [k2x, k2y, k2z] = lorenzDerivative(
    x + (DT / 2) * k1x,
    y + (DT / 2) * k1y,
    z + (DT / 2) * k1z
  );
  const [k3x, k3y, k3z] = lorenzDerivative(
    x + (DT / 2) * k2x,
    y + (DT / 2) * k2y,
    z + (DT / 2) * k2z
  );
  const [k4x, k4y, k4z] = lorenzDerivative(x + DT * k3x, y + DT * k3y, z + DT * k3z);
  return [
    x + (DT / 6) * (k1x + 2 * k2x + 2 * k3x + k4x),
    y + (DT / 6) * (k1y + 2 * k2y + 2 * k3y + k4y),
    z + (DT / 6) * (k1z + 2 * k2z + 2 * k3z + k4z),
  ];
}

const rawPoints = [[0.1, 0, 0]];
for (let i = 1; i < STEPS; i += 1) {
  const [px, py, pz] = rawPoints[i - 1];
  rawPoints.push(rk4Step(px, py, pz));
}
// Downsample to a smooth-but-lighter point count (spec calls for 100-2000).
const DOWNSAMPLE = 4;
const points = rawPoints.filter((_, i) => i % DOWNSAMPLE === 0);
const N = points.length;

// --- Camera: orthographic axonometric projection (elevation + azimuth) -----
// -52/22 keeps the X/Y axis frame corner (xMin, CORNER_X) clear of the
// trajectory's own coils — steeper azimuths (tried up to -75) square the
// projected bounding box slightly better but swing that corner into the
// data. Combined with fitting only to the tick tips (not the old, far larger
// label-anchor points — see below), this angle already yields a
// near-square box (~1.11 aspect), filling the canvas well under one
// isotropic scale without risking a tick landing inside the data.
const INITIAL_AZIMUTH = (-52 * Math.PI) / 180;
const INITIAL_ELEVATION = (22 * Math.PI) / 180;

// Data extents and normalization are camera-independent — computed once.
const xs = points.map((p) => p[0]);
const ys = points.map((p) => p[1]);
const zs = points.map((p) => p[2]);
const xMin = Math.min(...xs);
const xMax = Math.max(...xs);
const yMin = Math.min(...ys);
const yMax = Math.max(...ys);
const zMin = Math.min(...zs);
const zMax = Math.max(...zs);
const xCenter = (xMin + xMax) / 2;
const yCenter = (yMin + yMax) / 2;
const zCenter = (zMin + zMax) / 2;
const maxHalfRange = Math.max((xMax - xMin) / 2, (yMax - yMin) / 2, (zMax - zMin) / 2);

// X/Y axis frame corner (data-only, camera-independent): X and Y axes meet
// at the box edge farthest from the origin on the screen so their ticks stay
// clear of the trajectory.
const CORNER_X = yMax;

// Axis tick spacing (data-only, camera-independent).
const xTick = (xMax - xMin) * 0.35;
const yTick = (yMax - yMin) * 0.35;
const zTick = (zMax - zMin) * 0.35;

// --- Trajectory color: continuous time takes the Imprint sequential ramp ---
function lerpColor(hexA, hexB, frac) {
  const a = [1, 3, 5].map((i) => parseInt(hexA.slice(i, i + 2), 16));
  const b = [1, 3, 5].map((i) => parseInt(hexB.slice(i, i + 2), 16));
  const c = a.map((v, i) => Math.round(v + (b[i] - v) * frac));
  return `rgb(${c[0]}, ${c[1]}, ${c[2]})`;
}
const segmentColors = [];
for (let i = 0; i < N - 1; i += 1) {
  segmentColors.push(lerpColor(t.seq[0], t.seq[1], i / (N - 2)));
}

// --- Time-progression color key (imprint_seq: t=0 -> t=STEPS*DT) -----------
// Bottom-left, clear of the X/Y/Z axis frame which sits toward the right.
// Pixel-space only, so it is identical for every camera angle.
// Margins only need to cover the small fixed-pixel tick-label/axis-title
// offsets beyond the fitted trajectory+frame box (see TICK_LABEL_OFFSET_PX
// below) plus glyph size — not a large data-space allowance — so the box
// itself can fill most of the canvas.
const TOP_MARGIN = 110;
const SIDE_MARGIN = 110;
const BOTTOM_MARGIN = 130;
const KEY_X = SIDE_MARGIN;
const KEY_Y = size.height - 56;
const KEY_W = 200;
const legendElements = [
  {
    type: "text",
    style: { text: "time", x: KEY_X, y: KEY_Y - 20, fill: t.inkSoft, fontSize: 13, align: "left" },
    silent: true,
  },
  {
    type: "rect",
    shape: { x: KEY_X, y: KEY_Y, width: KEY_W, height: 10 },
    style: {
      fill: {
        type: "linear",
        x: 0,
        y: 0,
        x2: 1,
        y2: 0,
        colorStops: [
          { offset: 0, color: t.seq[0] },
          { offset: 1, color: t.seq[1] },
        ],
      },
    },
    silent: true,
  },
  {
    type: "text",
    style: { text: "t=0", x: KEY_X, y: KEY_Y + 24, fill: t.inkSoft, fontSize: 12, align: "left" },
    silent: true,
  },
  {
    type: "text",
    style: {
      text: `t=${(STEPS * DT).toFixed(0)}`,
      x: KEY_X + KEY_W,
      y: KEY_Y + 24,
      fill: t.inkSoft,
      fontSize: 12,
      align: "right",
    },
    silent: true,
  },
];

// --- Build the full scene (trajectory + axis frame) for a given camera -----
// Rebuilt on every drag-rotate frame, not just once, so the fit and the
// Z-axis tick placement both stay correct as the viewer rotates the scene.
function buildOption(azimuth, elevation) {
  const sinAz = Math.sin(azimuth);
  const cosAz = Math.cos(azimuth);
  const sinEl = Math.sin(elevation);
  const cosEl = Math.cos(elevation);

  function projectRaw(x, y, z) {
    const xn = (x - xCenter) / maxHalfRange;
    const yn = (y - yCenter) / maxHalfRange;
    const zn = (z - zCenter) / maxHalfRange;
    const screenX = -xn * sinAz + yn * cosAz;
    const screenY = -xn * cosAz * sinEl - yn * sinAz * sinEl + zn * cosEl;
    const depth = xn * cosEl * cosAz + yn * cosEl * sinAz + zn * sinEl;
    return { screenX, screenY, depth };
  }

  // Pick the Z-axis screen corner dynamically: of the 3 candidate (x, y)
  // corners not already occupied by the X/Y axis frame (which meets at
  // (xMax, CORNER_X)), use whichever projects farthest from the trajectory's
  // own projected screen centroid, so its ticks/labels never land inside the
  // data. A fixed corner assumption doesn't hold across all camera angles.
  let centroidX = 0;
  let centroidY = 0;
  for (let i = 0; i < N; i += 1) {
    const s = projectRaw(points[i][0], points[i][1], points[i][2]);
    centroidX += s.screenX;
    centroidY += s.screenY;
  }
  centroidX /= N;
  centroidY /= N;
  const zCornerCandidates = [
    [xMin, yMin],
    [xMin, yMax],
    [xMax, yMin],
  ];
  let Z_CORNER_X = zCornerCandidates[0][0];
  let Z_CORNER_Y = zCornerCandidates[0][1];
  let bestDist = -Infinity;
  zCornerCandidates.forEach(([cx, cy]) => {
    const s = projectRaw(cx, cy, zMin);
    const dist = Math.hypot(s.screenX - centroidX, s.screenY - centroidY);
    if (dist > bestDist) {
      bestDist = dist;
      Z_CORNER_X = cx;
      Z_CORNER_Y = cy;
    }
  });
  // Ticks/labels step outward from the chosen corner, away from the box
  // center, along whichever of +/-y clears the data (mirrors the fixed
  // yMin-corner convention, generalized to whichever corner won above).
  const zOutY = Z_CORNER_Y >= yCenter ? 1 : -1;

  const frameCorners = [
    [xMin, CORNER_X, zMin],
    [xMax, CORNER_X, zMin],
    [xMax, yMin, zMin],
    [xMax, yMax, zMin],
    [Z_CORNER_X, Z_CORNER_Y, zMin],
    [Z_CORNER_X, Z_CORNER_Y, zMax],
  ];

  // Fit to the union of the trajectory's own footprint, the axis frame, and
  // the tick marks' own outer tips (the *drawn* tick length, `xTick`/`yTick`/
  // `zTick`) — NOT the tick-label text, which is placed afterwards as a
  // small fixed-pixel offset (see TICK_LABEL_OFFSET_PX) rather than folded
  // into the fit. Baking the label's text position into the fit extent made
  // the fit (and therefore the whole scene) shrink to accommodate wherever
  // that text projects, which for some camera angles is very far from the
  // tick it labels — under-filling the canvas and detaching the label
  // visually from its tick. A fixed pixel offset, applied after the fit, is
  // camera-angle independent and keeps labels visually anchored to their tick.
  const tickTipPoints = [
    [xMin, CORNER_X + xTick, zMin],
    [(xMin + xMax) / 2, CORNER_X + xTick, zMin],
    [xMax, CORNER_X + xTick, zMin],
    [xMax + yTick, yMin, zMin],
    [xMax + yTick, (yMin + yMax) / 2, zMin],
    [xMax + yTick, yMax, zMin],
    [Z_CORNER_X, Z_CORNER_Y + zOutY * zTick, zMin],
    [Z_CORNER_X, Z_CORNER_Y + zOutY * zTick, (zMin + zMax) / 2],
    [Z_CORNER_X, Z_CORNER_Y + zOutY * zTick, zMax],
  ];
  const extentPoints = points.concat(frameCorners, tickTipPoints);
  const extentProjected = extentPoints.map((p) => projectRaw(p[0], p[1], p[2]));
  const sxs = extentProjected.map((c) => c.screenX);
  const sys = extentProjected.map((c) => c.screenY);
  const boxW = Math.max(...sxs) - Math.min(...sxs);
  const boxH = Math.max(...sys) - Math.min(...sys);
  const boxCx = (Math.max(...sxs) + Math.min(...sxs)) / 2;
  const boxCy = (Math.max(...sys) + Math.min(...sys)) / 2;

  const drawW = size.width - 2 * SIDE_MARGIN;
  const drawH = size.height - TOP_MARGIN - BOTTOM_MARGIN;
  const PAD = 1.03; // small headroom beyond the tick tips for glyph half-width
  // A single shared scale (not independent X/Y factors) keeps every axis'
  // true proportions intact; INITIAL_AZIMUTH/INITIAL_ELEVATION above are
  // chosen so the projected box is already close to square, so this one
  // scale fills both canvas dimensions without needing to stretch either.
  const scale = Math.min(drawW / (boxW * PAD), drawH / (boxH * PAD));
  const originX = size.width / 2 - boxCx * scale;
  const originY = TOP_MARGIN + drawH / 2 + boxCy * scale;
  const TICK_LABEL_OFFSET_PX = 50;
  const AXIS_TITLE_OFFSET_PX = 82;

  function toPixel(x, y, z) {
    const { screenX, screenY, depth } = projectRaw(x, y, z);
    return { px: originX + screenX * scale, py: originY - screenY * scale, depth };
  }

  // Places text a small, fixed pixel distance beyond a tick's own tip,
  // continuing in the SAME screen-space direction the tick stub itself
  // points (base -> tip). That direction is always "away from the axis
  // line," regardless of camera angle — unlike offsetting from the box's
  // overall center, which for some corners points back toward the data.
  function outwardPixel(basePos, tipPos, offsetPx) {
    const a = toPixel(...basePos);
    const b = toPixel(...tipPos);
    const dx = b.px - a.px;
    const dy = b.py - a.py;
    const len = Math.hypot(dx, dy) || 1;
    return { x: b.px + (dx / len) * offsetPx, y: b.py + (dy / len) * offsetPx };
  }

  // --- Trajectory: one segment per consecutive pair, colored by elapsed time
  const screenPoints = points.map((p) => toPixel(p[0], p[1], p[2]));
  const segments = [];
  for (let i = 0; i < N - 1; i += 1) {
    const a = screenPoints[i];
    const b = screenPoints[i + 1];
    segments.push({
      x1: a.px,
      y1: a.py,
      x2: b.px,
      y2: b.py,
      depth: (a.depth + b.depth) / 2,
      color: segmentColors[i],
    });
  }
  // High point density (N ~ 1500) with heavy self-overlap on a chaotic curve:
  // thin strokes + depth-faded alpha keep the wings readable instead of a
  // solid smear. Back-to-front draw order approximates hidden-line depth.
  segments.sort((s1, s2) => s1.depth - s2.depth);
  const dMin = Math.min(...segments.map((s) => s.depth));
  const dMax = Math.max(...segments.map((s) => s.depth));
  const trajectoryElements = segments.map((s) => {
    const tDepth = dMax > dMin ? (s.depth - dMin) / (dMax - dMin) : 1;
    return {
      type: "line",
      shape: { x1: s.x1, y1: s.y1, x2: s.x2, y2: s.y2 },
      style: { stroke: s.color, lineWidth: 1.7, opacity: 0.45 + 0.5 * tDepth },
      silent: true,
    };
  });

  // --- Axis frame: three edges of the bounding box, ticks + labels ---------
  const AXIS_COLOR = t.inkSoft;
  const axisElements = [];

  function axisLine(p1, p2) {
    const a = toPixel(...p1);
    const b = toPixel(...p2);
    axisElements.push({
      type: "line",
      shape: { x1: a.px, y1: a.py, x2: b.px, y2: b.py },
      style: { stroke: AXIS_COLOR, lineWidth: 2 },
      silent: true,
    });
  }

  function tickMark(base, outward) {
    const a = toPixel(...base);
    const b = toPixel(...outward);
    axisElements.push({
      type: "line",
      shape: { x1: a.px, y1: a.py, x2: b.px, y2: b.py },
      style: { stroke: AXIS_COLOR, lineWidth: 2 },
      silent: true,
    });
  }

  function tickLabel(base, tip, text) {
    const p = outwardPixel(base, tip, TICK_LABEL_OFFSET_PX);
    axisElements.push({
      type: "text",
      style: { text, x: p.x, y: p.y, fill: t.inkSoft, fontSize: 13, align: "center", verticalAlign: "middle" },
      silent: true,
    });
  }

  function axisTitle(base, tip, text) {
    const p = outwardPixel(base, tip, AXIS_TITLE_OFFSET_PX);
    axisElements.push({
      type: "text",
      style: {
        text,
        x: p.x,
        y: p.y,
        fill: t.ink,
        fontSize: 17,
        fontWeight: "bold",
        align: "center",
        verticalAlign: "middle",
      },
      silent: true,
    });
  }

  axisLine([xMin, CORNER_X, zMin], [xMax, CORNER_X, zMin]);
  [xMin, (xMin + xMax) / 2, xMax].forEach((v) => {
    const base = [v, CORNER_X, zMin];
    const tip = [v, CORNER_X + xTick, zMin];
    tickMark(base, tip);
    tickLabel(base, tip, v.toFixed(0));
  });
  axisTitle(
    [(xMin + xMax) / 2, CORNER_X, zMin],
    [(xMin + xMax) / 2, CORNER_X + xTick, zMin],
    "X"
  );

  axisLine([xMax, yMin, zMin], [xMax, yMax, zMin]);
  [yMin, (yMin + yMax) / 2, yMax].forEach((v) => {
    const base = [xMax, v, zMin];
    const tip = [xMax + yTick, v, zMin];
    tickMark(base, tip);
    tickLabel(base, tip, v.toFixed(0));
  });
  axisTitle([xMax, (yMin + yMax) / 2, zMin], [xMax + yTick, (yMin + yMax) / 2, zMin], "Y");

  axisLine([Z_CORNER_X, Z_CORNER_Y, zMin], [Z_CORNER_X, Z_CORNER_Y, zMax]);
  [zMin, (zMin + zMax) / 2, zMax].forEach((v) => {
    const base = [Z_CORNER_X, Z_CORNER_Y, v];
    const tip = [Z_CORNER_X, Z_CORNER_Y + zOutY * zTick, v];
    tickMark(base, tip);
    tickLabel(base, tip, v.toFixed(0));
  });
  axisTitle(
    [Z_CORNER_X, Z_CORNER_Y, zMax],
    [Z_CORNER_X, Z_CORNER_Y + zOutY * zTick, zMax],
    "Z"
  );

  return {
    animation: false,
    backgroundColor: "transparent",
    title: {
      text: "line-3d-trajectory · javascript · echarts · anyplot.ai",
      left: "center",
      top: 24,
      textStyle: { color: t.ink, fontSize: 22, fontWeight: 500 },
    },
    graphic: { elements: [...trajectoryElements, ...axisElements, ...legendElements] },
  };
}

// --- Init + option -----------------------------------------------------------
const chart = echarts.init(document.getElementById("container"));
chart.setOption(buildOption(INITIAL_AZIMUTH, INITIAL_ELEVATION));
chart.on("finished", () => {
  window.__anyplotReady = true;
});

// --- Interactive drag-to-rotate ---------------------------------------------
// echarts-gl is unavailable, so genuine rotation is implemented by hand: drag
// deltas update azimuth/elevation and the whole projection is rebuilt and
// re-rendered. Only affects the HTML output — the harness screenshots before
// any mouse event fires, so the static PNG is unaffected.
const container = document.getElementById("container");
let azimuth = INITIAL_AZIMUTH;
let elevation = INITIAL_ELEVATION;
let dragging = false;
let lastX = 0;
let lastY = 0;
let rafPending = false;
container.style.cursor = "grab";

function scheduleRender() {
  if (rafPending) return;
  rafPending = true;
  requestAnimationFrame(() => {
    rafPending = false;
    chart.setOption(buildOption(azimuth, elevation), { notMerge: true });
  });
}

container.addEventListener("mousedown", (e) => {
  dragging = true;
  lastX = e.clientX;
  lastY = e.clientY;
  container.style.cursor = "grabbing";
});
window.addEventListener("mousemove", (e) => {
  if (!dragging) return;
  const dx = e.clientX - lastX;
  const dy = e.clientY - lastY;
  lastX = e.clientX;
  lastY = e.clientY;
  azimuth += dx * 0.006;
  elevation = Math.max(-1.45, Math.min(1.45, elevation - dy * 0.006));
  scheduleRender();
});
window.addEventListener("mouseup", () => {
  if (!dragging) return;
  dragging = false;
  container.style.cursor = "grab";
});
Runnable source as JSON, for any HTTP client: https://api.anyplot.ai/specs/line-3d-trajectory/echarts/code. Any spec id and library id listed in llms-full.txt fit the same URL shape; every URL below is complete and callable.
{
  "spec_id": "line-3d-trajectory",
  "language": "javascript",
  "library": "echarts",
  "page": "https://anyplot.ai/line-3d-trajectory/javascript/echarts",
  "hub": "https://anyplot.ai/line-3d-trajectory",
  "code_json": "https://api.anyplot.ai/specs/line-3d-trajectory/echarts/code",
  "spec_json": "https://api.anyplot.ai/specs/line-3d-trajectory",
  "render_light_png": "https://storage.googleapis.com/anyplot-images/plots/line-3d-trajectory/javascript/echarts/plot-light.png",
  "render_dark_png": "https://storage.googleapis.com/anyplot-images/plots/line-3d-trajectory/javascript/echarts/plot-dark.png",
  "interactive_light_html": "https://storage.googleapis.com/anyplot-images/plots/line-3d-trajectory/javascript/echarts/plot-light.html",
  "interactive_dark_html": "https://storage.googleapis.com/anyplot-images/plots/line-3d-trajectory/javascript/echarts/plot-dark.html",
  "quality_score": 88.0,
  "license": "MIT",
  "guide": "https://anyplot.ai/llms.txt"
}
Part of 3D Line Plot for Trajectory Visualization on anyplot.ai.