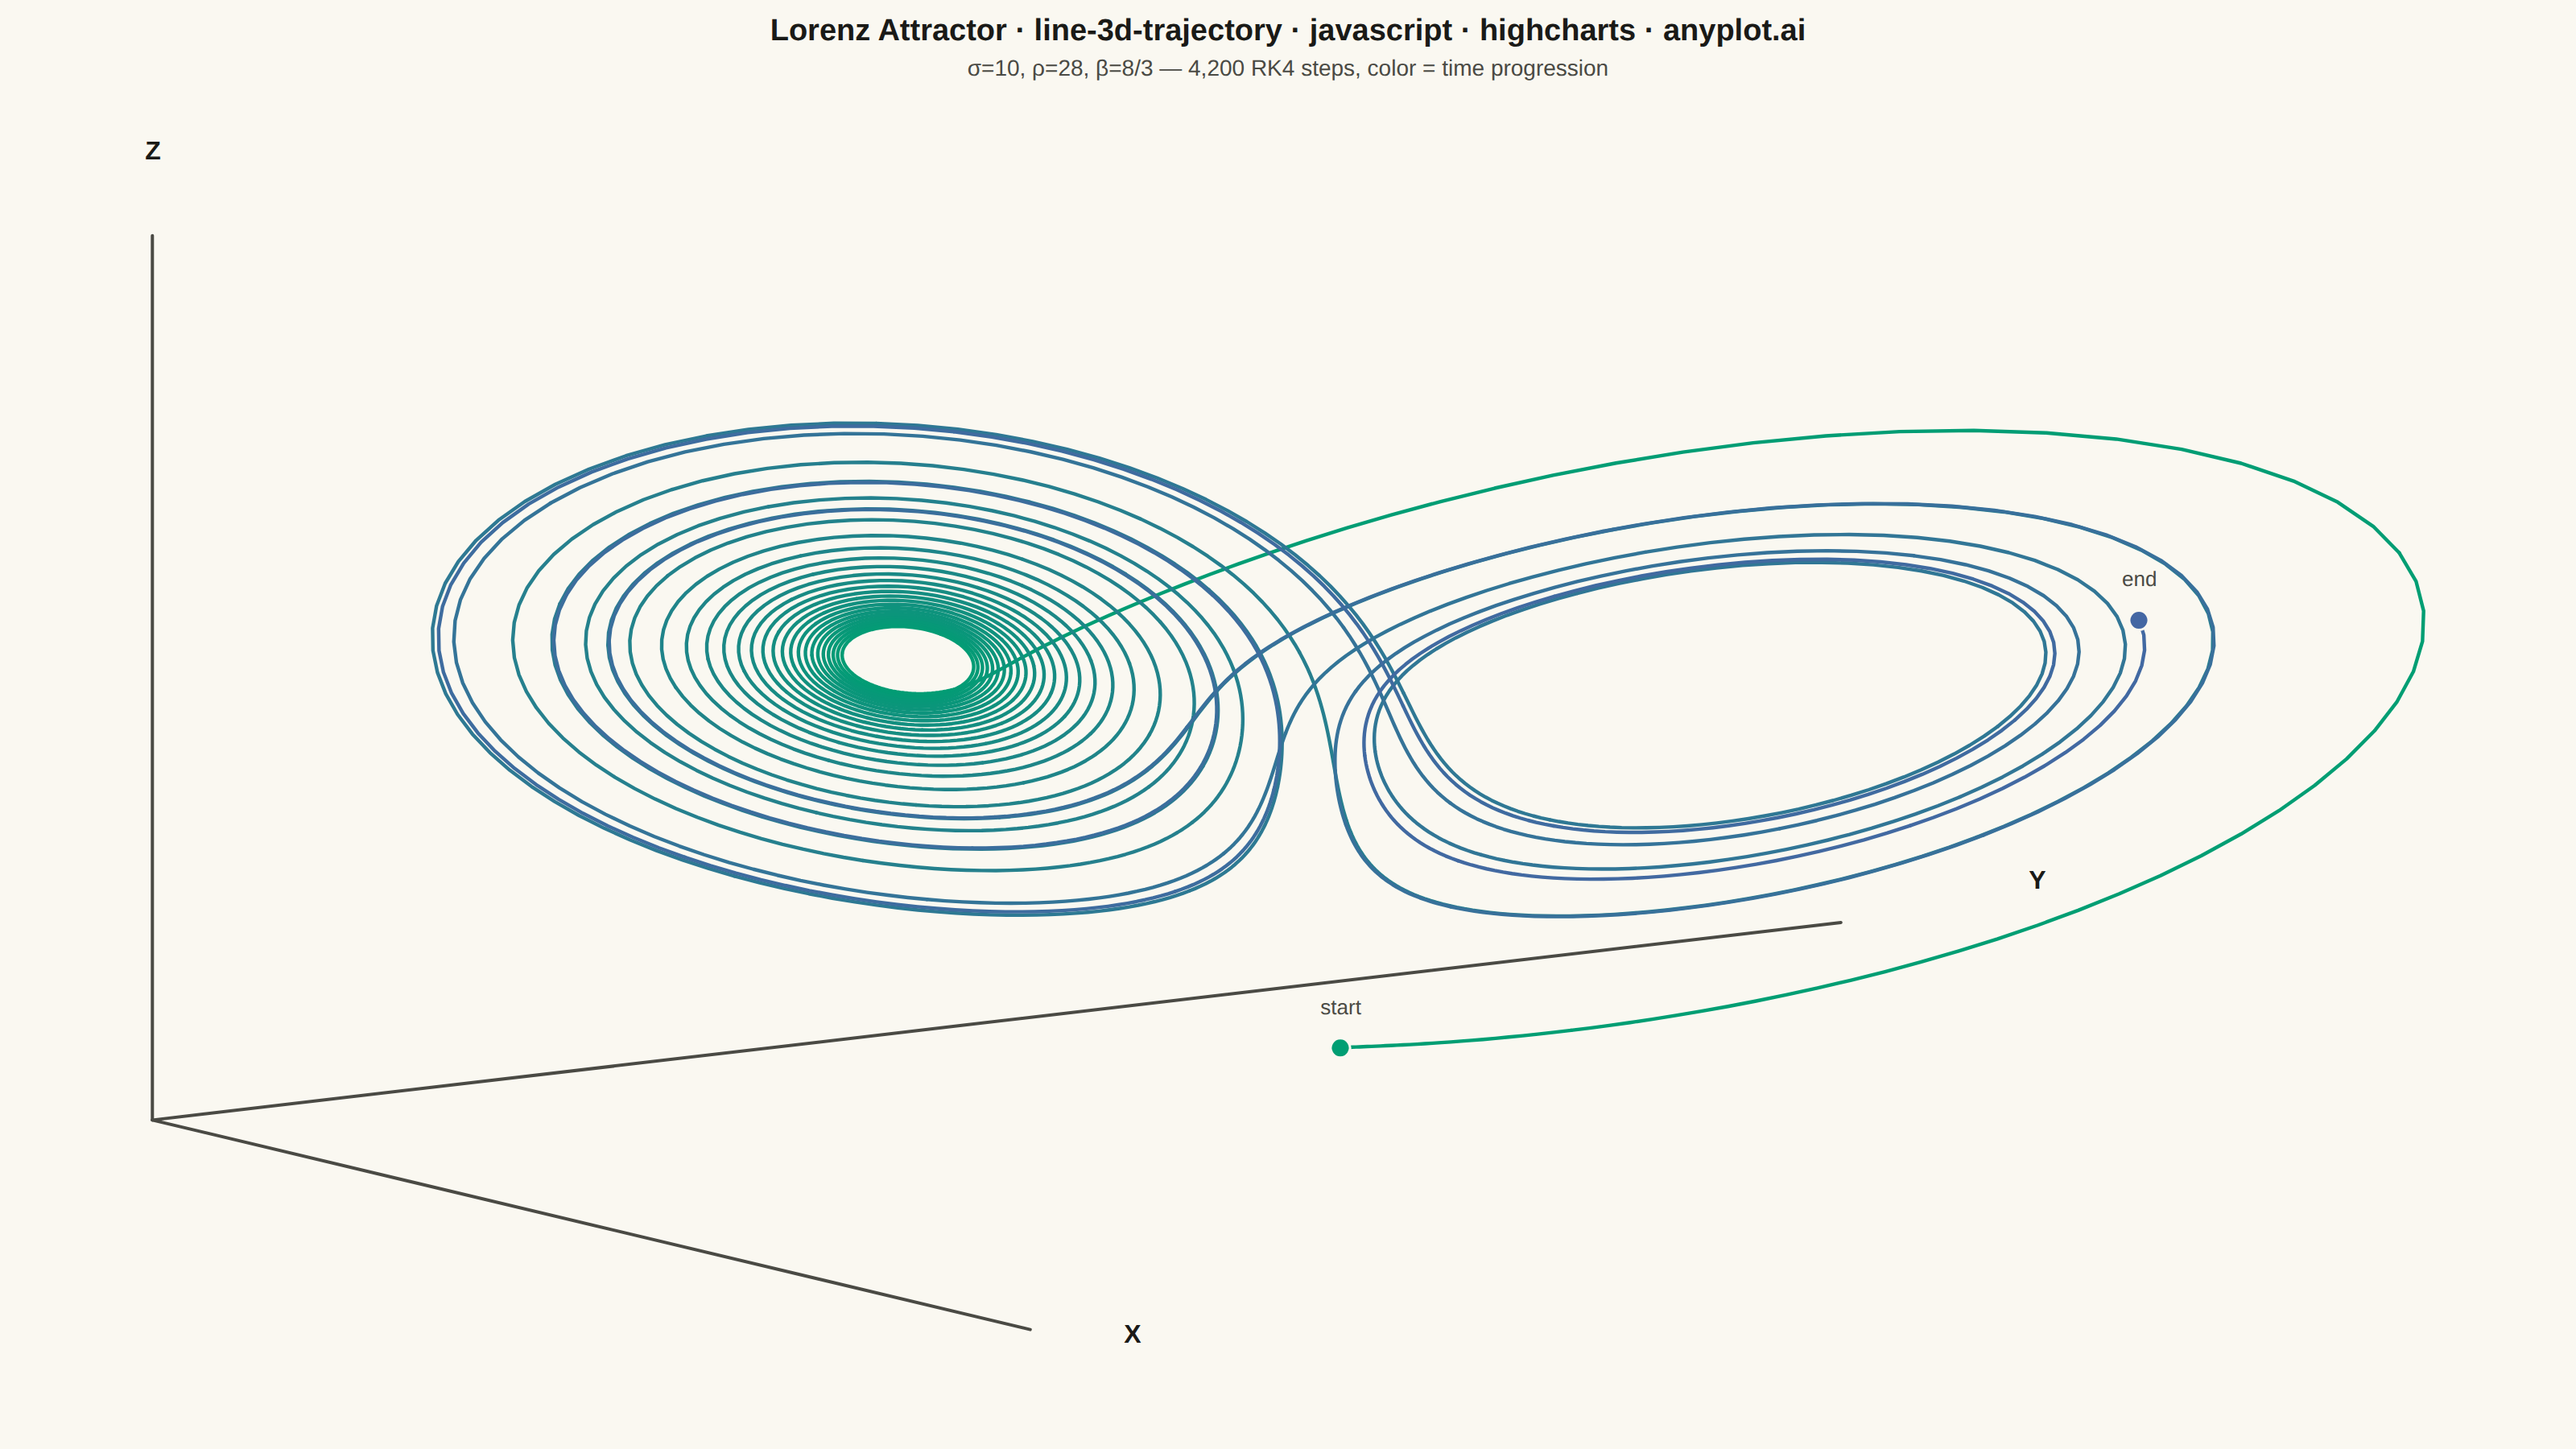
The same plot in 13 other libraries — JavaScript: Chart.js, D3.js, Apache ECharts, MUI X Charts; Python: Altair, Bokeh, lets-plot, Matplotlib, Plotly, Pygal, Seaborn; R: ggplot2; Julia: Makie.jl. Compare all 14 side by side: 3D Line Plot for Trajectory Visualization in Python, R, Julia and JavaScript.
A 3D line plot that displays paths, trajectories, or curves as connected lines in three-dimensional space. Unlike scatter plots that show discrete points, this visualization connects data points sequentially to reveal continuous paths, making it ideal for understanding motion, mathematical curves, and temporal evolution in 3D. Interactive rotation is essential for exploring the spatial structure of complex trajectories.
// anyplot.ai
// line-3d-trajectory: 3D Line Plot for Trajectory Visualization
// Library: highcharts 12.6.0 | JavaScript 22.23.2
// Quality: 92/100 | Created: 2026-09-10

const t = window.ANYPLOT_TOKENS;

// --- Data: Lorenz attractor, integrated with a fixed-step RK4 --------------
const SIGMA = 10;
const RHO = 28;
const BETA = 8 / 3;
const DT = 0.006;
const STEPS = 4200;

const derivative = (x, y, z) => [
  SIGMA * (y - x),
  x * (RHO - z) - y,
  x * y - BETA * z,
];

let [x, y, z] = [0.6, 0.6, 0.6];
const path = [[x, y, z]];
for (let i = 0; i < STEPS; i += 1) {
  const [k1x, k1y, k1z] = derivative(x, y, z);
  const [k2x, k2y, k2z] = derivative(x + (k1x * DT) / 2, y + (k1y * DT) / 2, z + (k1z * DT) / 2);
  const [k3x, k3y, k3z] = derivative(x + (k2x * DT) / 2, y + (k2y * DT) / 2, z + (k2z * DT) / 2);
  const [k4x, k4y, k4z] = derivative(x + k3x * DT, y + k3y * DT, z + k3z * DT);
  x += (DT / 6) * (k1x + 2 * k2x + 2 * k3x + k4x);
  y += (DT / 6) * (k1y + 2 * k2y + 2 * k3y + k4y);
  z += (DT / 6) * (k1z + 2 * k2z + 2 * k3z + k4z);
  path.push([x, y, z]);
}

const xs = path.map((p) => p[0]);
const ys = path.map((p) => p[1]);
const zs = path.map((p) => p[2]);
const [xMin, xMax] = [Math.min(...xs), Math.max(...xs)];
const [yMin, yMax] = [Math.min(...ys), Math.max(...ys)];
const [zMin, zMax] = [Math.min(...zs), Math.max(...zs)];

// --- 3D -> 2D orthographic projection (elevation 22°, azimuth 55°) ---------
// Highcharts core has no chart3d/highcharts-3d module (see prompts/library/
// highcharts.md "Forbidden patterns"), so the trajectory is projected by hand
// into plain (x, y) screen coordinates and drawn as ordinary `line` series —
// the same math a native 3D engine applies before rasterizing, computed here
// instead of in an unavailable add-on.
const ELEV = (22 * Math.PI) / 180;
const AZIM = (55 * Math.PI) / 180;
const cosAz = Math.cos(AZIM);
const sinAz = Math.sin(AZIM);
const cosEl = Math.cos(ELEV);
const sinEl = Math.sin(ELEV);

const project = (px, py, pz) => {
  const xr = px * cosAz + py * sinAz;
  const yr = -px * sinAz + py * cosAz;
  const zScreen = yr * sinEl + pz * cosEl;
  return [xr, zScreen];
};

// Each projected point carries its pre-projection coordinates and time
// fraction under `custom` so the tooltip can surface them on hover.
const projectedPoints = path.map(([px, py, pz], i) => {
  const [sx, sy] = project(px, py, pz);
  return { x: sx, y: sy, custom: { ox: px, oy: py, oz: pz, frac: i / (path.length - 1) } };
});

// --- Color: time progression along the imprint_seq colormap ----------------
const hexToRgb = (hex) => {
  const n = parseInt(hex.slice(1), 16);
  return [(n >> 16) & 255, (n >> 8) & 255, n & 255];
};
const seqLo = hexToRgb(t.seq[0]);
const seqHi = hexToRgb(t.seq[1]);
const timeColor = (frac) => {
  const r = Math.round(seqLo[0] + (seqHi[0] - seqLo[0]) * frac);
  const g = Math.round(seqLo[1] + (seqHi[1] - seqLo[1]) * frac);
  const b = Math.round(seqLo[2] + (seqHi[2] - seqLo[2]) * frac);
  return `rgb(${r}, ${g}, ${b})`;
};

// The path is drawn as many short overlapping segments, each its own color —
// Highcharts core has no per-point line-color gradient, so a fine segment
// chain is how a single line reads as a smooth time gradient.
const SEGMENTS = 140;
const pointsPerSegment = Math.ceil(projectedPoints.length / SEGMENTS);
const trajectorySeries = [];
for (let s = 0; s < SEGMENTS; s += 1) {
  const start = Math.max(0, s * pointsPerSegment - 1);
  const end = Math.min(projectedPoints.length, (s + 1) * pointsPerSegment);
  if (end - start < 2) continue;
  trajectorySeries.push({
    type: "line",
    data: projectedPoints.slice(start, end),
    color: timeColor(s / (SEGMENTS - 1)),
    lineWidth: 2.2,
    marker: { enabled: false, states: { hover: { enabled: true, radius: 4, lineWidth: 1 } } },
    enableMouseTracking: true,
    stickyTracking: false,
    showInLegend: false,
  });
}

// --- Axis frame: an L-shaped X/Y/Z reference below the attractor -----------
const padFrac = 0.12;
const xPad = (xMax - xMin) * padFrac;
const yPad = (yMax - yMin) * padFrac;
const zPad = (zMax - zMin) * padFrac;
const floorZ = zMin - zPad;
const topZ = zMax + zPad * 1.6;
const corner = project(xMin - xPad, yMin - yPad, floorZ);
const xEnd = project(xMax + xPad, yMin - yPad, floorZ);
const yEnd = project(xMin - xPad, yMax + yPad, floorZ);
const zEnd = project(xMin - xPad, yMin - yPad, topZ);

const axisFrameSeries = [
  { type: "line", data: [corner, xEnd], color: t.inkSoft, lineWidth: 2, marker: { enabled: false }, enableMouseTracking: false, showInLegend: false },
  { type: "line", data: [corner, yEnd], color: t.inkSoft, lineWidth: 2, marker: { enabled: false }, enableMouseTracking: false, showInLegend: false },
  { type: "line", data: [corner, zEnd], color: t.inkSoft, lineWidth: 2, marker: { enabled: false }, enableMouseTracking: false, showInLegend: false },
];

const [xTitleX, xTitleY] = project(xMax + xPad * 2.2, yMin - yPad, floorZ);
const [yTitleX, yTitleY] = project(xMin - xPad, yMax + yPad * 2.2, floorZ);
const [zTitleX, zTitleY] = project(xMin - xPad, yMin - yPad, topZ * 1.08);
const startP = projectedPoints[0];
const endP = projectedPoints[projectedPoints.length - 1];

const labelSeries = [
  {
    type: "scatter",
    data: [
      { x: xTitleX, y: xTitleY, name: "X" },
      { x: yTitleX, y: yTitleY, name: "Y" },
      { x: zTitleX, y: zTitleY, name: "Z" },
    ],
    marker: { enabled: false },
    enableMouseTracking: false,
    showInLegend: false,
    dataLabels: {
      enabled: true,
      format: "{point.name}",
      allowOverlap: true,
      style: { color: t.ink, fontSize: "16px", fontWeight: "600", textOutline: "none" },
    },
  },
  {
    type: "scatter",
    data: [
      { x: startP.x, y: startP.y, name: "start", marker: { enabled: true, radius: 6, fillColor: timeColor(0), lineColor: t.pageBg, lineWidth: 1.5 } },
      { x: endP.x, y: endP.y, name: "end", marker: { enabled: true, radius: 6, fillColor: timeColor(1), lineColor: t.pageBg, lineWidth: 1.5 } },
    ],
    enableMouseTracking: false,
    showInLegend: false,
    dataLabels: {
      enabled: true,
      format: "{point.name}",
      y: -14,
      allowOverlap: true,
      style: { color: t.inkSoft, fontSize: "13px", fontWeight: "500", textOutline: "none" },
    },
  },
];

// --- Axis bounds: fit every projected coordinate with padding --------------
const allPoints = [
  ...projectedPoints.map((p) => [p.x, p.y]),
  corner,
  xEnd,
  yEnd,
  zEnd,
  [xTitleX, xTitleY],
  [yTitleX, yTitleY],
  [zTitleX, zTitleY],
];
const allX = allPoints.map((p) => p[0]);
const allY = allPoints.map((p) => p[1]);
const boundsPadX = (Math.max(...allX) - Math.min(...allX)) * 0.06;
const boundsPadY = (Math.max(...allY) - Math.min(...allY)) * 0.06;

// --- Chart -------------------------------------------------------------
Highcharts.chart("container", {
  chart: {
    type: "line",
    backgroundColor: "transparent",
    animation: false,
    style: { fontFamily: "inherit" },
  },
  credits: { enabled: false },
  title: {
    // Title is 76 chars (> 67-char baseline), so fontsize scales down from the
    // ~22px CSS default: round(22 * 67 / 76) = 19px — see prompts/plot-generator.md
    // "Title fontsize must scale with title length".
    text: "Lorenz Attractor · line-3d-trajectory · javascript · highcharts · anyplot.ai",
    style: { color: t.ink, fontSize: "19px", fontWeight: "600" },
  },
  subtitle: {
    text: "σ=10, ρ=28, β=8/3 — 4,200 RK4 steps, color = time progression",
    style: { color: t.inkSoft, fontSize: "14px" },
  },
  xAxis: {
    visible: false,
    min: Math.min(...allX) - boundsPadX,
    max: Math.max(...allX) + boundsPadX,
    startOnTick: false,
    endOnTick: false,
  },
  yAxis: {
    visible: false,
    min: Math.min(...allY) - boundsPadY,
    max: Math.max(...allY) + boundsPadY,
    startOnTick: false,
    endOnTick: false,
    title: { text: null },
  },
  legend: { enabled: false },
  tooltip: {
    enabled: true,
    backgroundColor: t.elevatedBg,
    borderColor: t.inkSoft,
    borderRadius: 4,
    style: { color: t.ink, fontSize: "12px" },
    formatter() {
      const c = this.point.custom;
      return `<b>t = ${(c.frac * 100).toFixed(0)}%</b><br/>x: ${c.ox.toFixed(2)}<br/>y: ${c.oy.toFixed(2)}<br/>z: ${c.oz.toFixed(2)}`;
    },
  },
  plotOptions: { series: { animation: false } },
  series: [...trajectorySeries, ...axisFrameSeries, ...labelSeries],
});
Runnable source as JSON, for any HTTP client: https://api.anyplot.ai/specs/line-3d-trajectory/highcharts/code. Any spec id and library id listed in llms-full.txt fit the same URL shape; every URL below is complete and callable.
{
  "spec_id": "line-3d-trajectory",
  "language": "javascript",
  "library": "highcharts",
  "page": "https://anyplot.ai/line-3d-trajectory/javascript/highcharts",
  "hub": "https://anyplot.ai/line-3d-trajectory",
  "code_json": "https://api.anyplot.ai/specs/line-3d-trajectory/highcharts/code",
  "spec_json": "https://api.anyplot.ai/specs/line-3d-trajectory",
  "render_light_png": "https://storage.googleapis.com/anyplot-images/plots/line-3d-trajectory/javascript/highcharts/plot-light.png",
  "render_dark_png": "https://storage.googleapis.com/anyplot-images/plots/line-3d-trajectory/javascript/highcharts/plot-dark.png",
  "interactive_light_html": "https://storage.googleapis.com/anyplot-images/plots/line-3d-trajectory/javascript/highcharts/plot-light.html",
  "interactive_dark_html": "https://storage.googleapis.com/anyplot-images/plots/line-3d-trajectory/javascript/highcharts/plot-dark.html",
  "quality_score": 92.0,
  "license": "MIT",
  "guide": "https://anyplot.ai/llms.txt"
}
Part of 3D Line Plot for Trajectory Visualization on anyplot.ai.