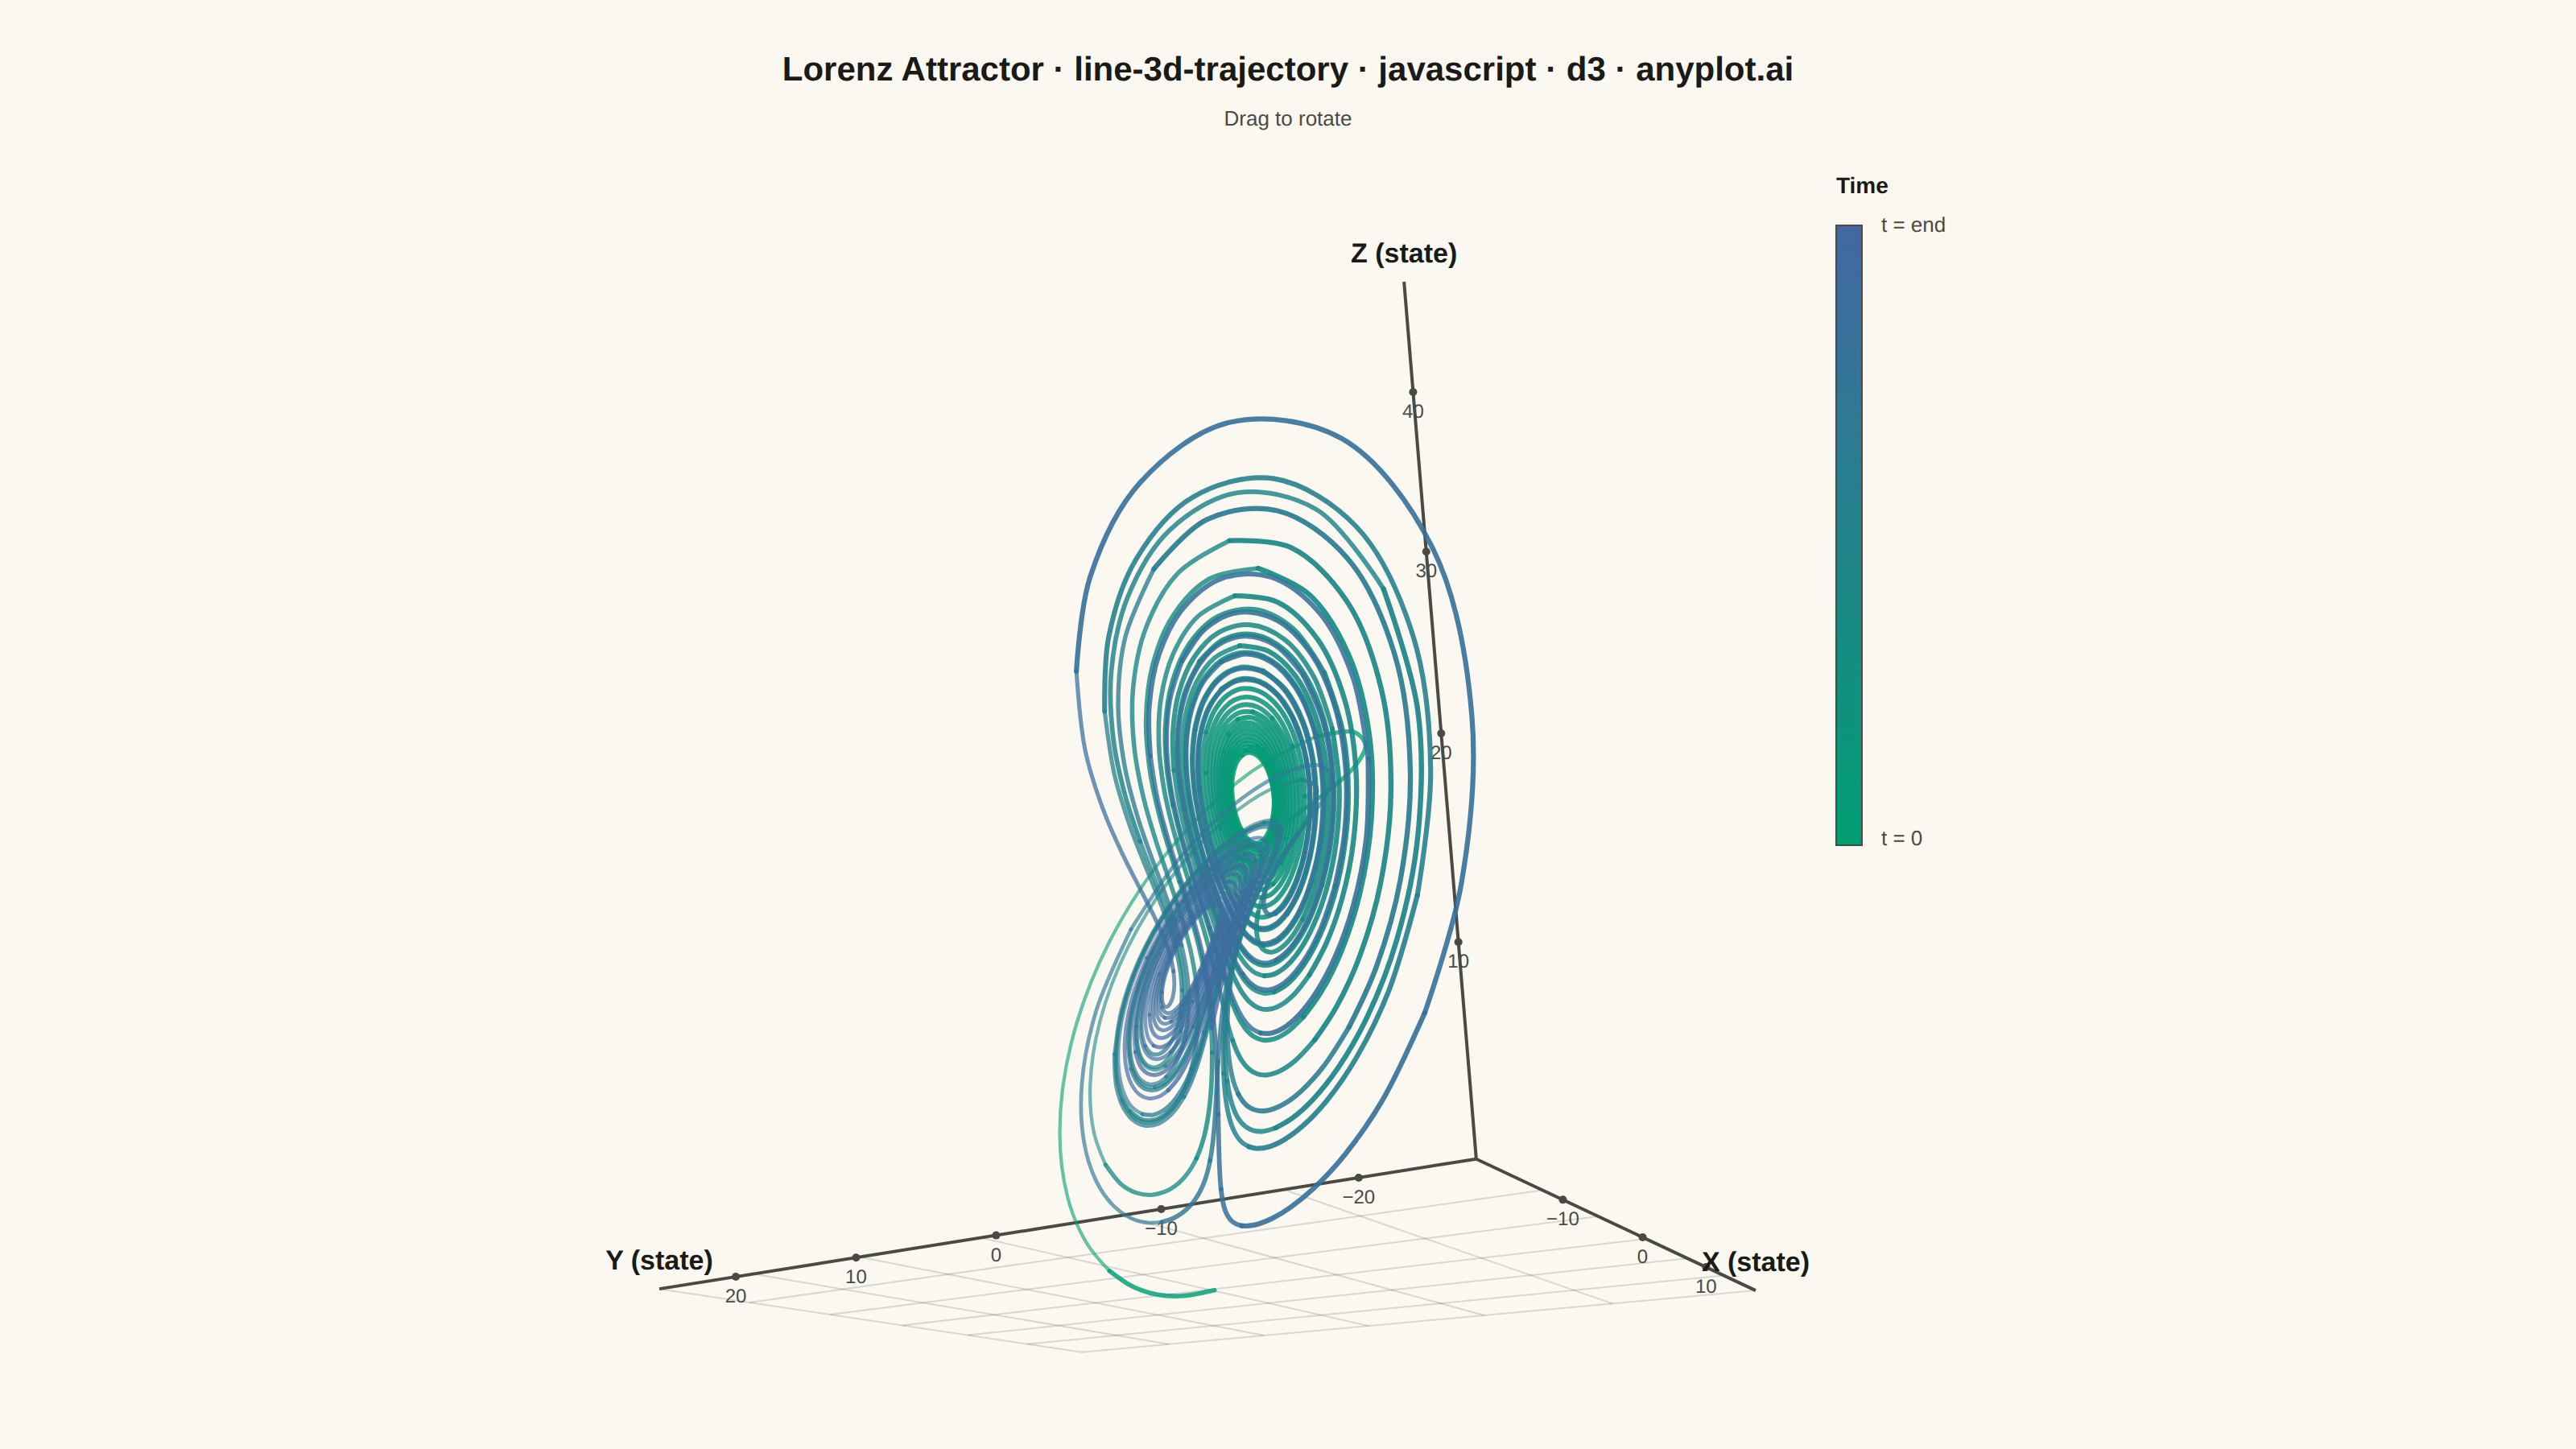
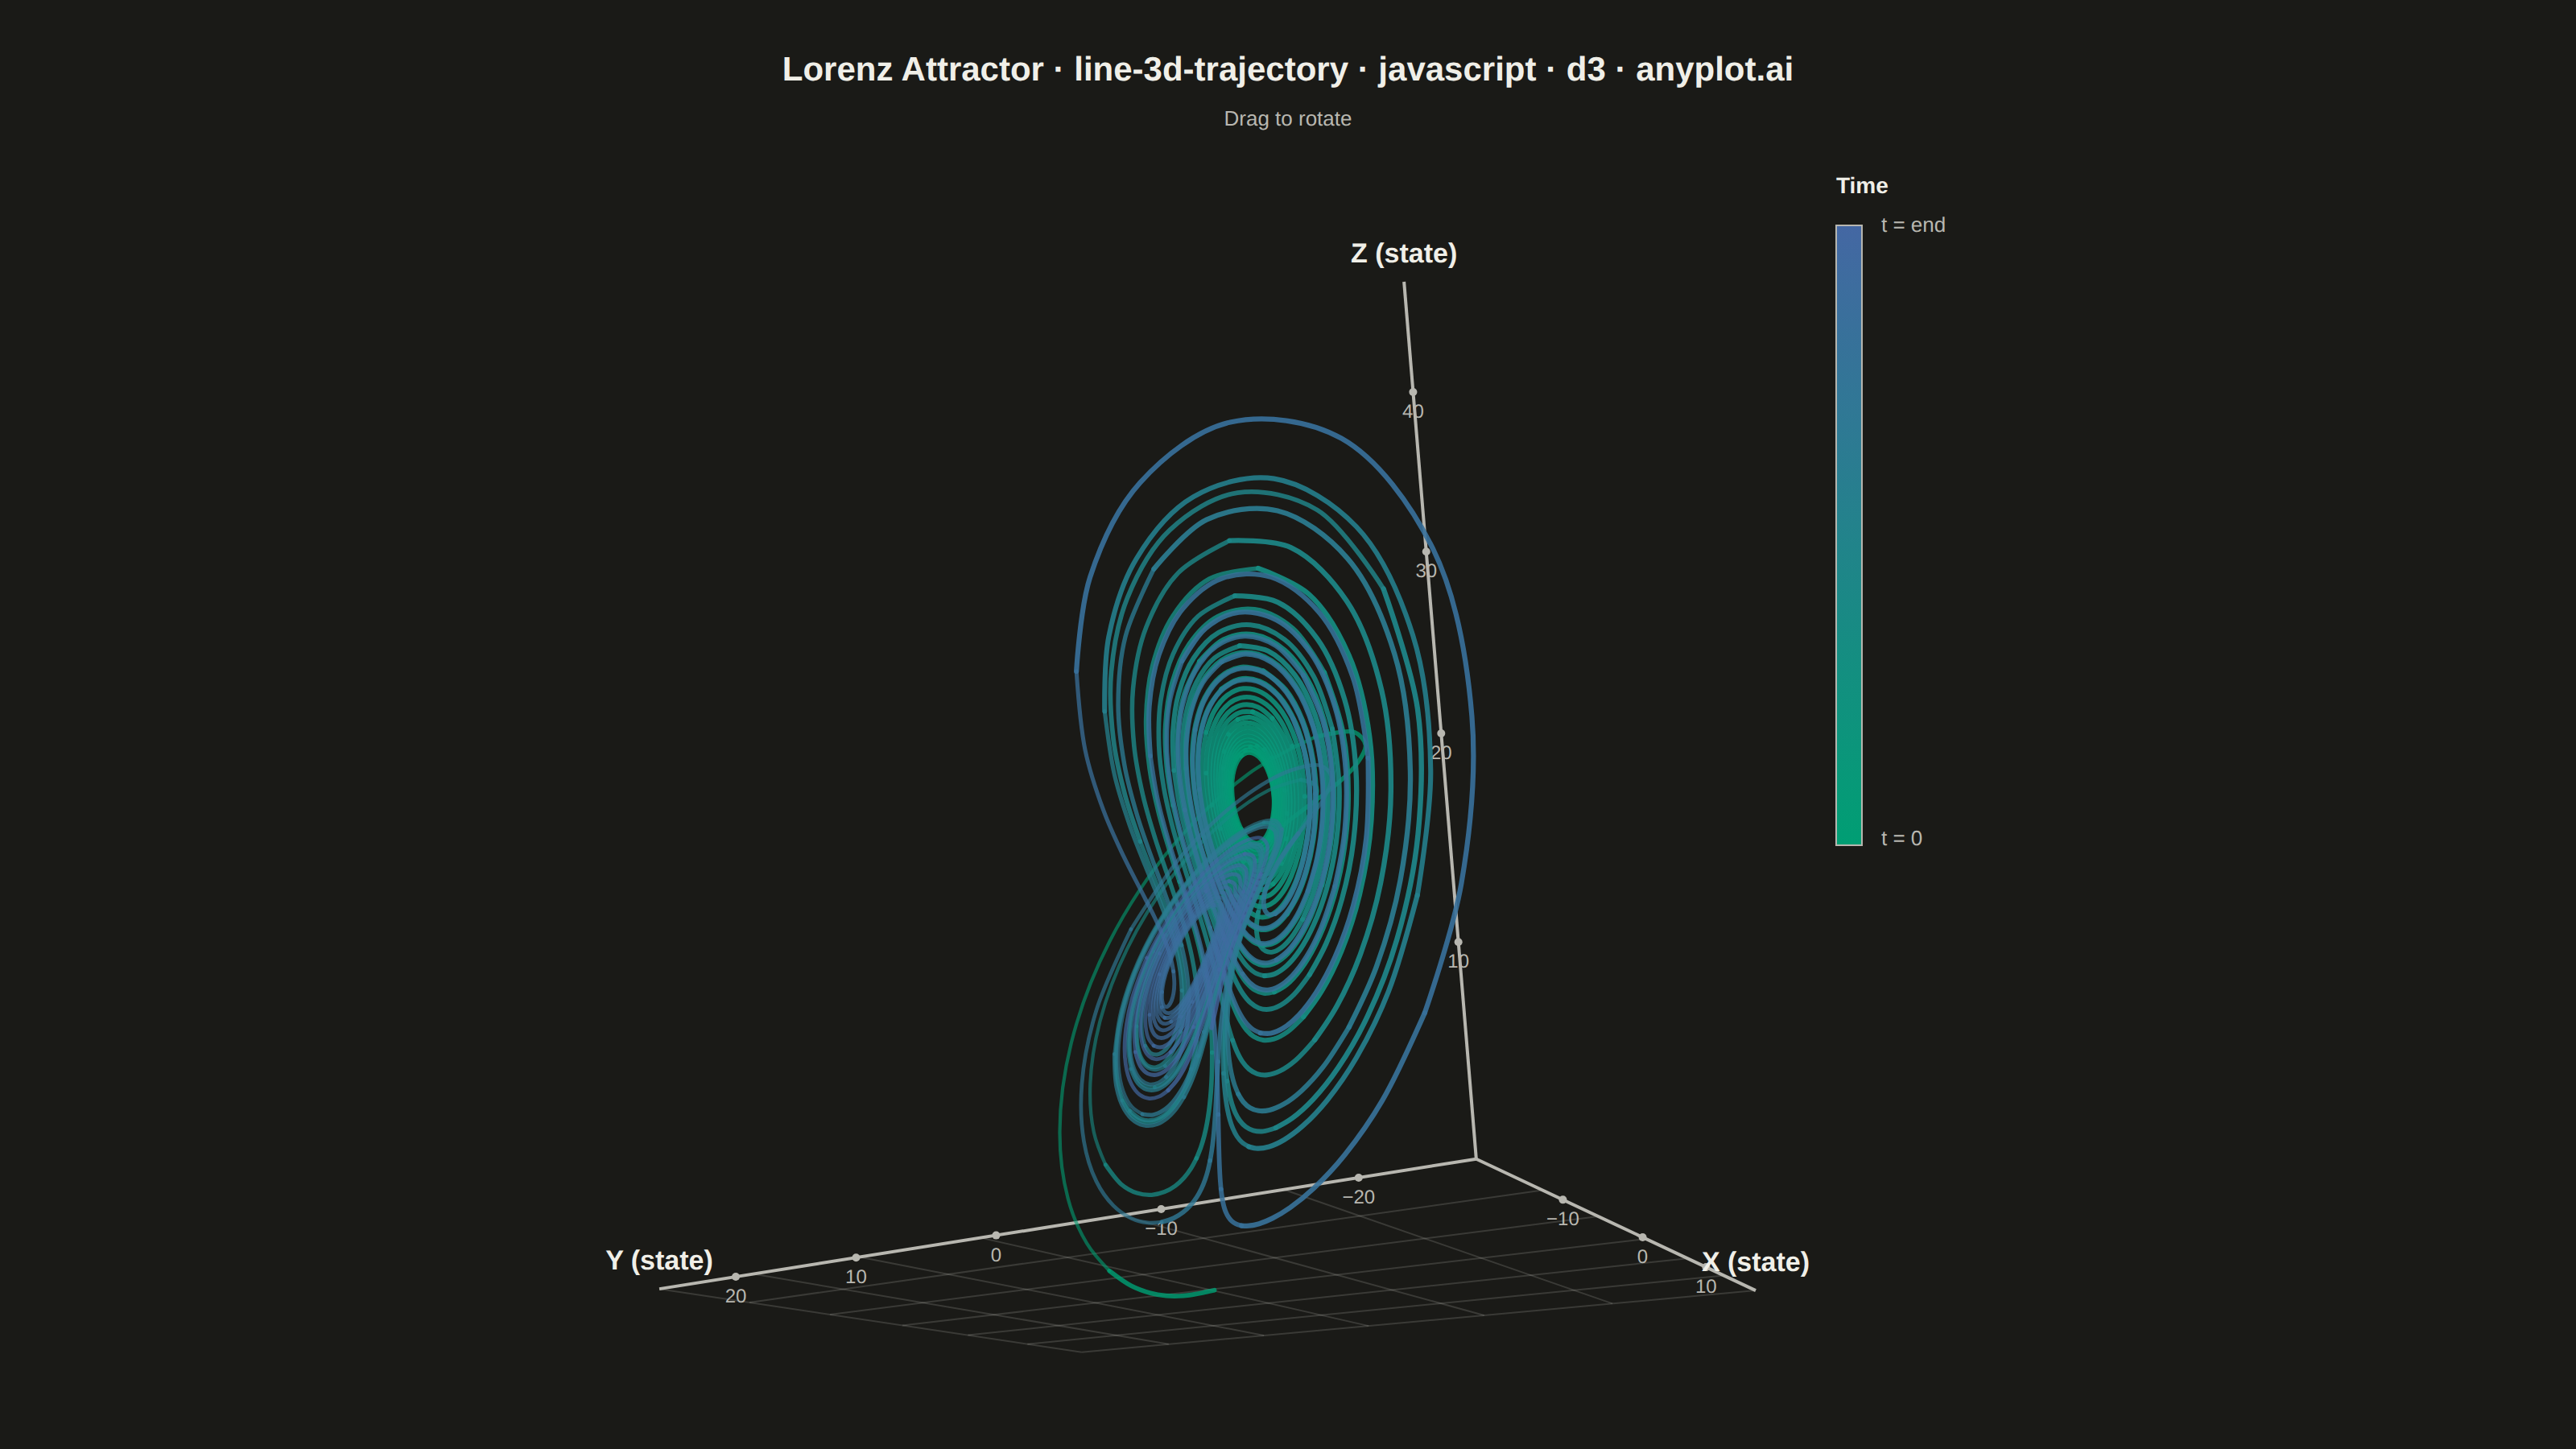
The same plot in 13 other libraries — JavaScript: Chart.js, Apache ECharts, Highcharts, MUI X Charts; Python: Altair, Bokeh, lets-plot, Matplotlib, Plotly, Pygal, Seaborn; R: ggplot2; Julia: Makie.jl. Compare all 14 side by side: 3D Line Plot for Trajectory Visualization in Python, R, Julia and JavaScript.
A 3D line plot that displays paths, trajectories, or curves as connected lines in three-dimensional space. Unlike scatter plots that show discrete points, this visualization connects data points sequentially to reveal continuous paths, making it ideal for understanding motion, mathematical curves, and temporal evolution in 3D. Interactive rotation is essential for exploring the spatial structure of complex trajectories.
// anyplot.ai
// line-3d-trajectory: 3D Line Plot for Trajectory Visualization
// Library: d3 7.9.0 | JavaScript 22.23.2
// Quality: 86/100 | Created: 2026-09-10

const t = window.ANYPLOT_TOKENS;
const { width, height } = window.ANYPLOT_SIZE;
const margin = { top: 140, right: 170, bottom: 60, left: 70 };
const iw = width - margin.left - margin.right;
const ih = height - margin.top - margin.bottom;
const cx0 = margin.left + iw / 2;
const cy0 = margin.top + ih / 2;

// --- Data: Lorenz attractor, integrated with RK4 (in-memory, deterministic) -
const SIGMA = 10;
const RHO = 28;
const BETA = 8 / 3;
const SIM_DT = 0.005;
const SIM_STEPS = 8000; // t = 0..40 — long enough to switch between both wings
const DOWNSAMPLE = 5; // 1601 plotted points — within the spec's 100-2000 range

function lorenzDeriv(p) {
  return {
    dx: SIGMA * (p.y - p.x),
    dy: p.x * (RHO - p.z) - p.y,
    dz: p.x * p.y - BETA * p.z,
  };
}

function rk4Step(p, dt) {
  const k1 = lorenzDeriv(p);
  const p2 = { x: p.x + (k1.dx * dt) / 2, y: p.y + (k1.dy * dt) / 2, z: p.z + (k1.dz * dt) / 2 };
  const k2 = lorenzDeriv(p2);
  const p3 = { x: p.x + (k2.dx * dt) / 2, y: p.y + (k2.dy * dt) / 2, z: p.z + (k2.dz * dt) / 2 };
  const k3 = lorenzDeriv(p3);
  const p4 = { x: p.x + k3.dx * dt, y: p.y + k3.dy * dt, z: p.z + k3.dz * dt };
  const k4 = lorenzDeriv(p4);
  return {
    x: p.x + (dt / 6) * (k1.dx + 2 * k2.dx + 2 * k3.dx + k4.dx),
    y: p.y + (dt / 6) * (k1.dy + 2 * k2.dy + 2 * k3.dy + k4.dy),
    z: p.z + (dt / 6) * (k1.dz + 2 * k2.dz + 2 * k3.dz + k4.dz),
  };
}

const simulated = [{ x: 1, y: 1, z: 1 }];
for (let i = 1; i <= SIM_STEPS; i++) simulated.push(rk4Step(simulated[i - 1], SIM_DT));
const points = simulated.filter((_, i) => i % DOWNSAMPLE === 0);

// --- 3D -> 2D projection: normalize, rotate (interactively, via drag), then
// perspective-divide. "up" on screen is data z (classic Lorenz convention),
// "right" is data x, "depth" is data y.
const xExtent = d3.extent(points, (p) => p.x);
const yExtent = d3.extent(points, (p) => p.y);
const zExtent = d3.extent(points, (p) => p.z);
const xMid = (xExtent[0] + xExtent[1]) / 2;
const yMid = (yExtent[0] + yExtent[1]) / 2;
const zMid = (zExtent[0] + zExtent[1]) / 2;
const maxRange =
  Math.max(xExtent[1] - xExtent[0], yExtent[1] - yExtent[0], zExtent[1] - zExtent[0]) / 2;

const toUVW = (p) => ({
  u: (p.x - xMid) / maxRange,
  v: (p.z - zMid) / maxRange,
  w: (p.y - yMid) / maxRange,
});

let YAW = -0.95; // rotation around the vertical (v) axis — mutable, drag-controlled
let PITCH = 0.42; // rotation around the horizontal (u) axis — mutable, drag-controlled
const CAM_DIST = 3.4; // perspective camera distance, in normalized units

function toCamera(p, yaw, pitch) {
  const cosY = Math.cos(yaw);
  const sinY = Math.sin(yaw);
  const u1 = p.u * cosY + p.w * sinY;
  const w1 = -p.u * sinY + p.w * cosY;
  const cosP = Math.cos(pitch);
  const sinP = Math.sin(pitch);
  const v2 = p.v * cosP - w1 * sinP;
  const w2 = p.v * sinP + w1 * cosP;
  return { cx: u1, cy: v2, cz: w2 };
}

function toRawScreen(c) {
  const k = CAM_DIST / (CAM_DIST + c.cz);
  return { sx: c.cx * k, sy: -c.cy * k, depth: c.cz };
}

// Reference-frame corner extents (padded slightly beyond the data)
const PAD = 1.0;
const uLo = ((xExtent[0] - xMid) / maxRange) * PAD;
const uHi = ((xExtent[1] - xMid) / maxRange) * PAD;
const vLo = ((zExtent[0] - zMid) / maxRange) * PAD;
const vHi = ((zExtent[1] - zMid) / maxRange) * PAD;
const wLo = ((yExtent[0] - yMid) / maxRange) * PAD;
const wHi = ((yExtent[1] - yMid) / maxRange) * PAD;
const origin = { u: uLo, v: vLo, w: wLo };
const FRAME_CORNERS = [
  { u: uLo, v: vLo, w: wLo },
  { u: uHi, v: vLo, w: wLo },
  { u: uLo, v: vHi, w: wLo },
  { u: uLo, v: vLo, w: wHi },
];
const axisSpecs = [
  { end: { u: uHi, v: vLo, w: wLo }, extent: xExtent, mid: xMid, axis: "u", label: "X (state)" },
  { end: { u: uLo, v: vLo, w: wHi }, extent: yExtent, mid: yMid, axis: "w", label: "Y (state)" },
  { end: { u: uLo, v: vHi, w: wLo }, extent: zExtent, mid: zMid, axis: "v", label: "Z (state)" },
];

// Fit the scale to the trajectory + the axis-frame endpoints together (for the
// CURRENT yaw/pitch), so the reference frame never overflows the plot area
// while the curve still fills most of it. Recomputed on every rotation so the
// scene stays framed as the user drags.
function computeFit(yaw, pitch) {
  const cam = (p) => toRawScreen(toCamera(p, yaw, pitch));
  const trajectoryRaw = points.map((p) => cam(toUVW(p)));
  const frameRaw = FRAME_CORNERS.map(cam);
  const allRaw = trajectoryRaw.concat(frameRaw);
  const sxExtent = d3.extent(allRaw, (p) => p.sx);
  const syExtent = d3.extent(allRaw, (p) => p.sy);
  const scale = 0.9 * Math.min(iw / (sxExtent[1] - sxExtent[0]), ih / (syExtent[1] - syExtent[0]));
  const sxMid = (sxExtent[0] + sxExtent[1]) / 2;
  const syMid = (syExtent[0] + syExtent[1]) / 2;
  const toPixel = (s) => ({ x: cx0 + (s.sx - sxMid) * scale, y: cy0 + (s.sy - syMid) * scale, depth: s.depth });
  return {
    projectUVW: (p) => toPixel(cam(p)),
    trajectoryPixels: trajectoryRaw.map(toPixel),
  };
}

// --- SVG mount ----------------------------------------------------------
const svg = d3.select("#container").append("svg").attr("width", width).attr("height", height);
const floor = svg.append("g");
const axes = svg.append("g");
const trajectory = svg.append("g").attr("fill", "none");

const seqColor = d3.scaleSequential(d3.interpolateRgbBasis(t.seq)).domain([0, points.length - 1]);
const line = d3
  .line()
  .x((p) => p.x)
  .y((p) => p.y)
  .curve(d3.curveCatmullRom.alpha(0.5));
const CHUNK = 8;
const GRID_LINES = 6;

function redraw() {
  const { projectUVW, trajectoryPixels } = computeFit(YAW, PITCH);

  // Floor grid (reference plane at the base of the attractor)
  const floorSegments = [];
  for (let i = 0; i <= GRID_LINES; i++) {
    const u = uLo + ((uHi - uLo) * i) / GRID_LINES;
    floorSegments.push([projectUVW({ u, v: vLo, w: wLo }), projectUVW({ u, v: vLo, w: wHi })]);
  }
  for (let i = 0; i <= GRID_LINES; i++) {
    const w = wLo + ((wHi - wLo) * i) / GRID_LINES;
    floorSegments.push([projectUVW({ u: uLo, v: vLo, w }), projectUVW({ u: uHi, v: vLo, w })]);
  }
  floor
    .selectAll("line")
    .data(floorSegments)
    .join("line")
    .attr("x1", (d) => d[0].x)
    .attr("y1", (d) => d[0].y)
    .attr("x2", (d) => d[1].x)
    .attr("y2", (d) => d[1].y)
    .attr("stroke", t.grid)
    .attr("stroke-width", 1);

  // Axis frame (corner-anchored X / Y / Z reference lines + ticks)
  axes.selectAll("*").remove();
  for (const spec of axisSpecs) {
    const p0 = projectUVW(origin);
    const p1 = projectUVW(spec.end);
    axes
      .append("line")
      .attr("x1", p0.x)
      .attr("y1", p0.y)
      .attr("x2", p1.x)
      .attr("y2", p1.y)
      .attr("stroke", t.inkSoft)
      .attr("stroke-width", 2);

    const ticks = d3.scaleLinear().domain(spec.extent).ticks(4);
    for (const tickVal of ticks) {
      const n = (tickVal - spec.mid) / maxRange;
      const tickPoint = { ...origin, [spec.axis]: n };
      const tp = projectUVW(tickPoint);
      axes.append("circle").attr("cx", tp.x).attr("cy", tp.y).attr("r", 2.5).attr("fill", t.inkSoft);
      axes
        .append("text")
        .attr("x", tp.x)
        .attr("y", tp.y + 16)
        .attr("text-anchor", "middle")
        .attr("fill", t.inkSoft)
        .style("font-size", "12px")
        .text(d3.format(".0f")(tickVal));
    }

    axes
      .append("text")
      .attr("x", p1.x)
      .attr("y", p1.y - 12)
      .attr("text-anchor", "middle")
      .attr("fill", t.ink)
      .style("font-size", "17px")
      .style("font-weight", "600")
      .text(spec.label);
  }

  // Trajectory: chunked, time-colored, depth-shaded segments
  const depthExtent = d3.extent(trajectoryPixels, (p) => p.depth);
  const opacityScale = d3.scaleLinear().domain(depthExtent).range([1, 0.5]);
  const widthScale = d3.scaleLinear().domain(depthExtent).range([3.4, 1.8]);
  const chunks = [];
  for (let start = 0; start < trajectoryPixels.length - 1; start += CHUNK) {
    const end = Math.min(start + CHUNK, trajectoryPixels.length - 1);
    const chunkPoints = trajectoryPixels.slice(start, end + 1);
    const mid = Math.floor((start + end) / 2);
    const avgDepth = d3.mean(chunkPoints, (p) => p.depth);
    chunks.push({
      d: line(chunkPoints),
      color: seqColor(mid),
      opacity: opacityScale(avgDepth),
      width: widthScale(avgDepth),
    });
  }
  trajectory
    .selectAll("path")
    .data(chunks)
    .join("path")
    .attr("d", (c) => c.d)
    .attr("stroke", (c) => c.color)
    .attr("stroke-opacity", (c) => c.opacity)
    .attr("stroke-width", (c) => c.width)
    .attr("stroke-linecap", "round")
    .attr("stroke-linejoin", "round");

  return { projectUVW, trajectoryPixels };
}

// --- Interactive rotation (genuine, drag-driven re-projection) ----------
const drag = d3
  .drag()
  .on("start", () => svg.style("cursor", "grabbing"))
  .on("drag", (event) => {
    YAW += event.dx * 0.006;
    PITCH = Math.max(-1.4, Math.min(1.4, PITCH - event.dy * 0.006));
    redraw();
  })
  .on("end", () => svg.style("cursor", "grab"));
svg.style("cursor", "grab").call(drag);

const initialFit = redraw();

// --- Colorbar legend (time progression along the trajectory) ------------
// Anchored to the actual right edge of the projected scene (not a fixed
// offset), so it sits close to the plot instead of floating in empty space.
const sceneRightEdge = d3.max(
  initialFit.trajectoryPixels.concat(FRAME_CORNERS.map(initialFit.projectUVW)),
  (p) => p.x,
);
const legendX = Math.min(sceneRightEdge + 50, width - 110);
const legend = svg.append("g").attr("transform", `translate(${legendX},${margin.top})`);
const barHeight = ih * 0.55;
const barWidth = 16;
const gradientId = "time-gradient";
const stops = d3.range(0, 1.001, 0.1);
const defs = svg.append("defs");
defs
  .append("linearGradient")
  .attr("id", gradientId)
  .attr("x1", "0")
  .attr("x2", "0")
  .attr("y1", "1")
  .attr("y2", "0")
  .selectAll("stop")
  .data(stops)
  .join("stop")
  .attr("offset", (d) => `${d * 100}%`)
  .attr("stop-color", (d) => d3.interpolateRgbBasis(t.seq)(d));

legend
  .append("rect")
  .attr("width", barWidth)
  .attr("height", barHeight)
  .attr("fill", `url(#${gradientId})`)
  .attr("stroke", t.inkSoft)
  .attr("stroke-width", 1);

legend
  .append("text")
  .attr("x", barWidth + 12)
  .attr("y", 4)
  .attr("fill", t.inkSoft)
  .style("font-size", "13px")
  .text("t = end");

legend
  .append("text")
  .attr("x", barWidth + 12)
  .attr("y", barHeight)
  .attr("fill", t.inkSoft)
  .style("font-size", "13px")
  .text("t = 0");

legend
  .append("text")
  .attr("x", 0)
  .attr("y", -20)
  .attr("fill", t.ink)
  .style("font-size", "14px")
  .style("font-weight", "600")
  .text("Time");

// --- Title ----------------------------------------------------------------
svg
  .append("text")
  .attr("x", width / 2)
  .attr("y", 50)
  .attr("text-anchor", "middle")
  .attr("fill", t.ink)
  .style("font-size", "21px")
  .style("font-weight", "600")
  .text("Lorenz Attractor · line-3d-trajectory · javascript · d3 · anyplot.ai");

svg
  .append("text")
  .attr("x", width / 2)
  .attr("y", 78)
  .attr("text-anchor", "middle")
  .attr("fill", t.inkSoft)
  .style("font-size", "13px")
  .text("Drag to rotate");
Runnable source as JSON, for any HTTP client: https://api.anyplot.ai/specs/line-3d-trajectory/d3/code. Any spec id and library id listed in llms-full.txt fit the same URL shape; every URL below is complete and callable.
{
  "spec_id": "line-3d-trajectory",
  "language": "javascript",
  "library": "d3",
  "page": "https://anyplot.ai/line-3d-trajectory/javascript/d3",
  "hub": "https://anyplot.ai/line-3d-trajectory",
  "code_json": "https://api.anyplot.ai/specs/line-3d-trajectory/d3/code",
  "spec_json": "https://api.anyplot.ai/specs/line-3d-trajectory",
  "render_light_png": "https://storage.googleapis.com/anyplot-images/plots/line-3d-trajectory/javascript/d3/plot-light.png",
  "render_dark_png": "https://storage.googleapis.com/anyplot-images/plots/line-3d-trajectory/javascript/d3/plot-dark.png",
  "interactive_light_html": "https://storage.googleapis.com/anyplot-images/plots/line-3d-trajectory/javascript/d3/plot-light.html",
  "interactive_dark_html": "https://storage.googleapis.com/anyplot-images/plots/line-3d-trajectory/javascript/d3/plot-dark.html",
  "quality_score": 86.0,
  "license": "MIT",
  "guide": "https://anyplot.ai/llms.txt"
}
Part of 3D Line Plot for Trajectory Visualization on anyplot.ai.