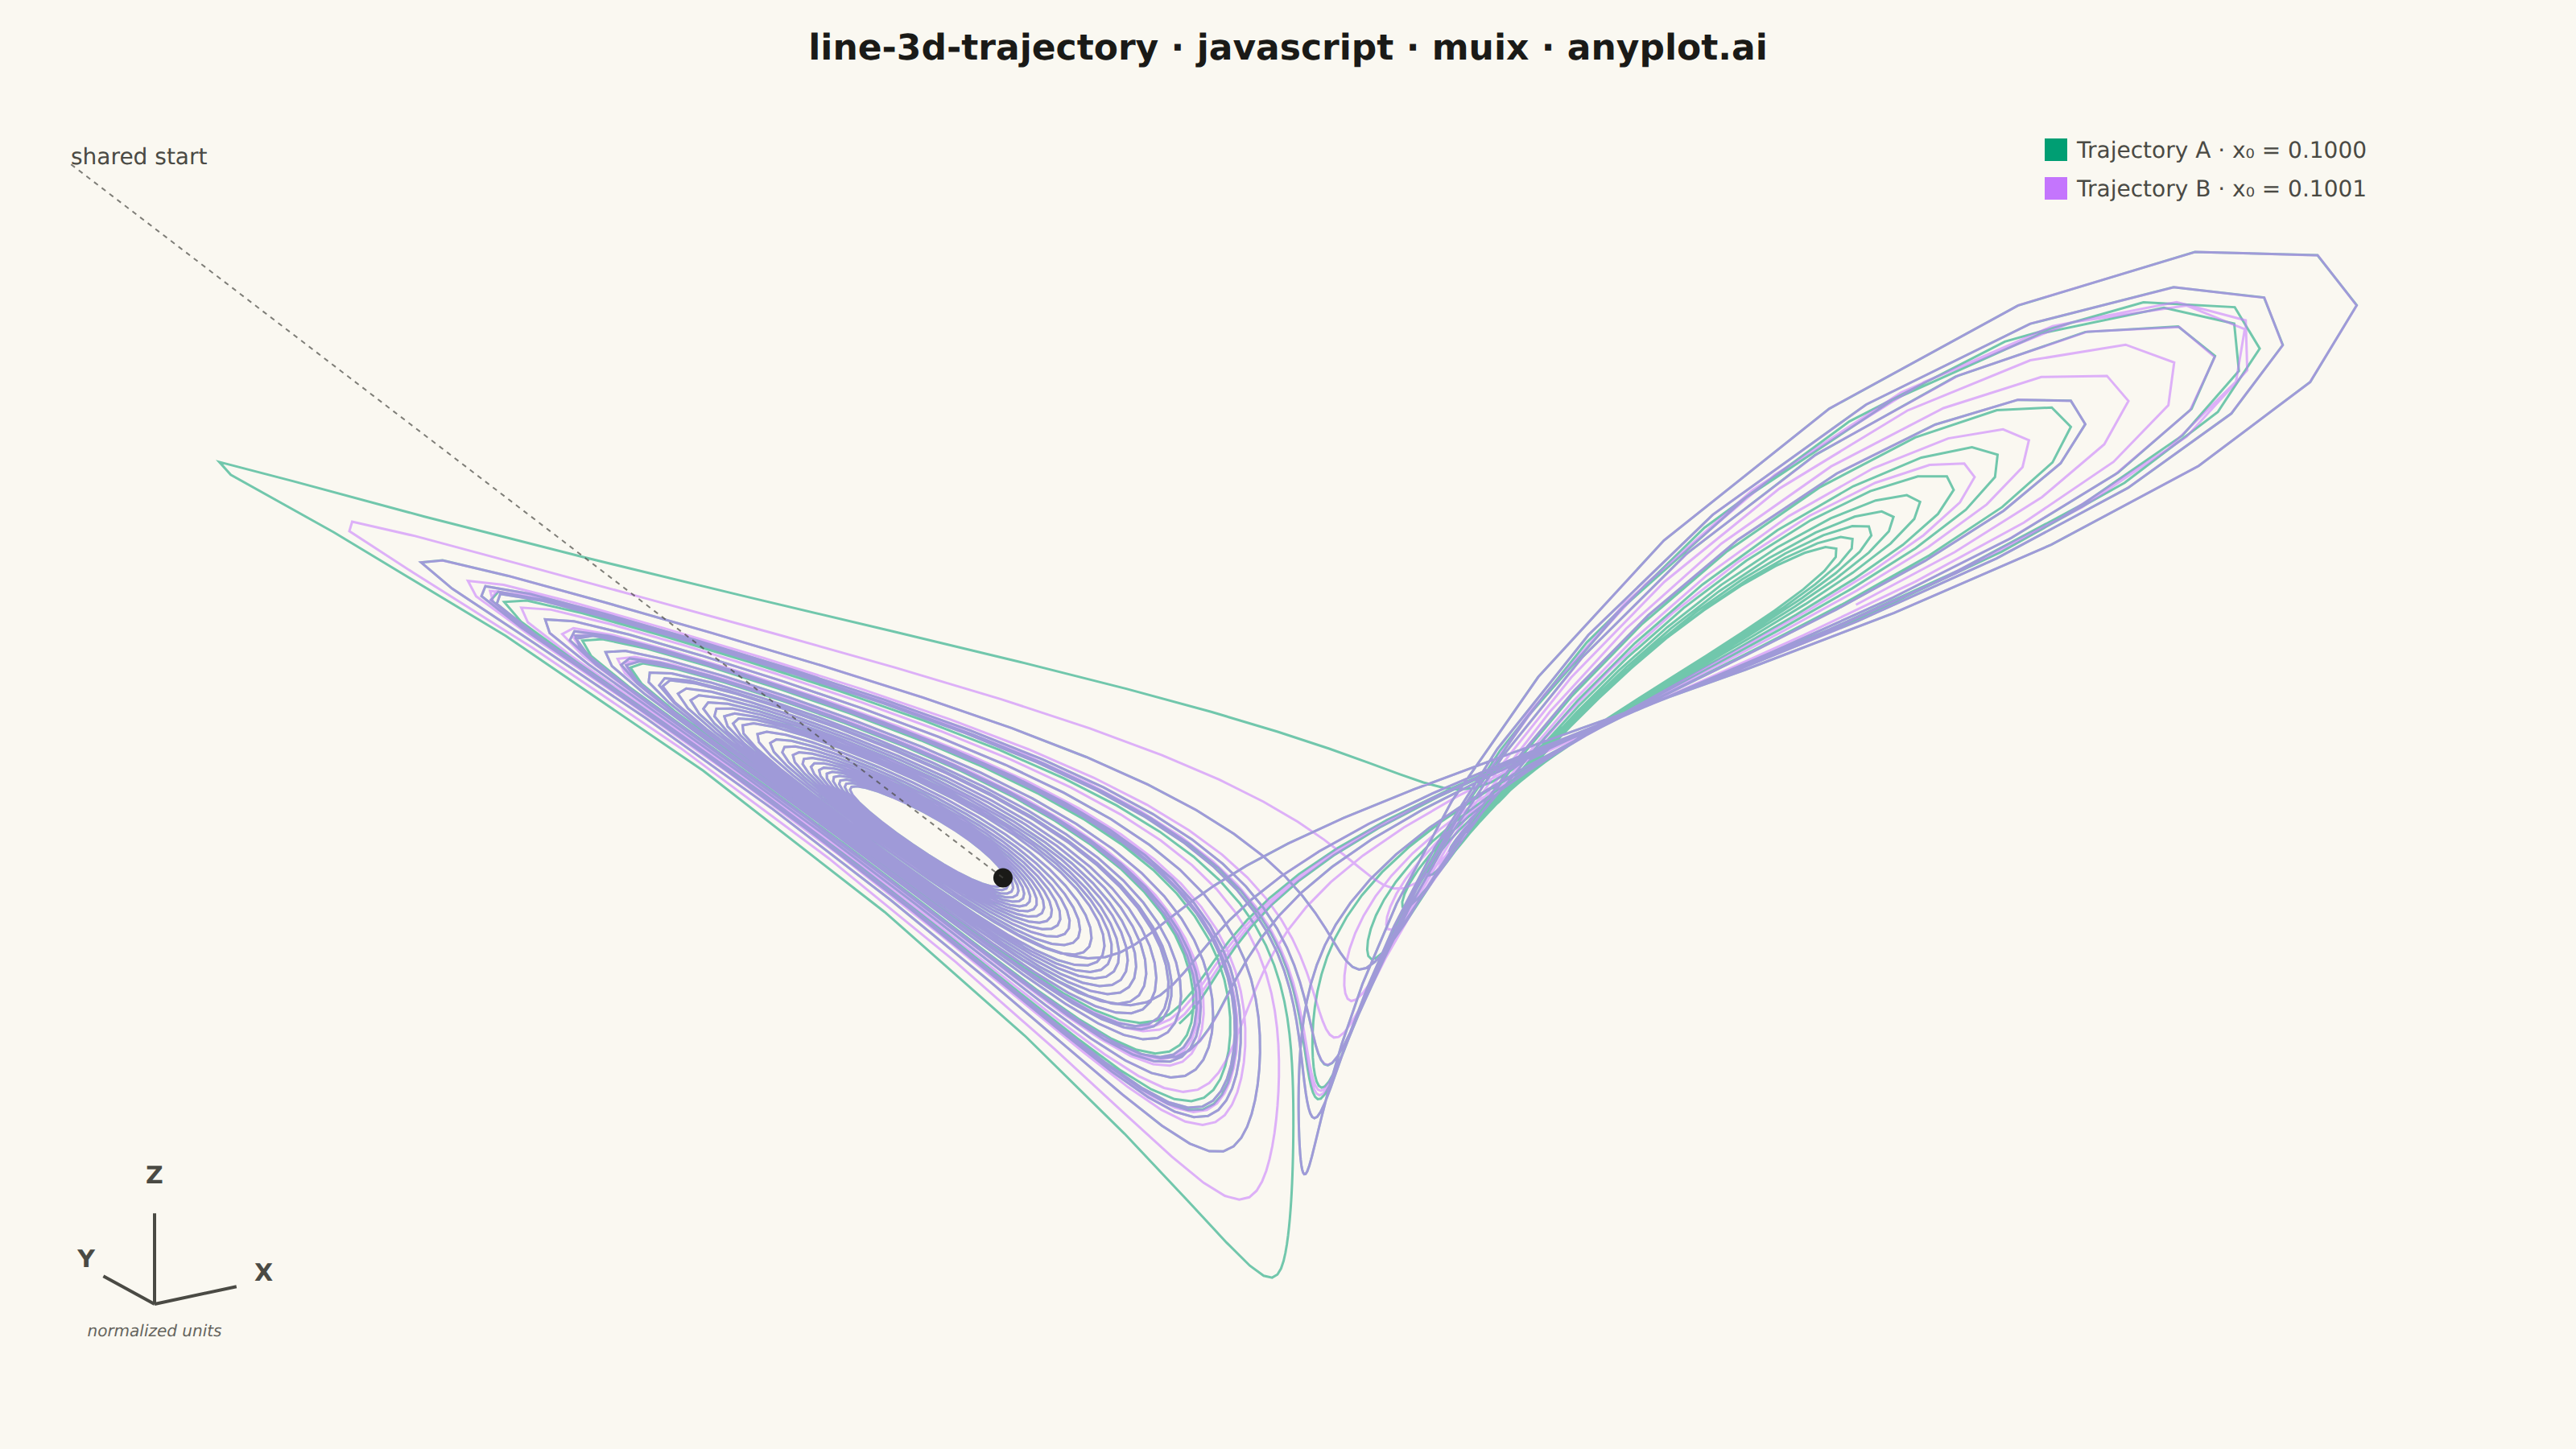
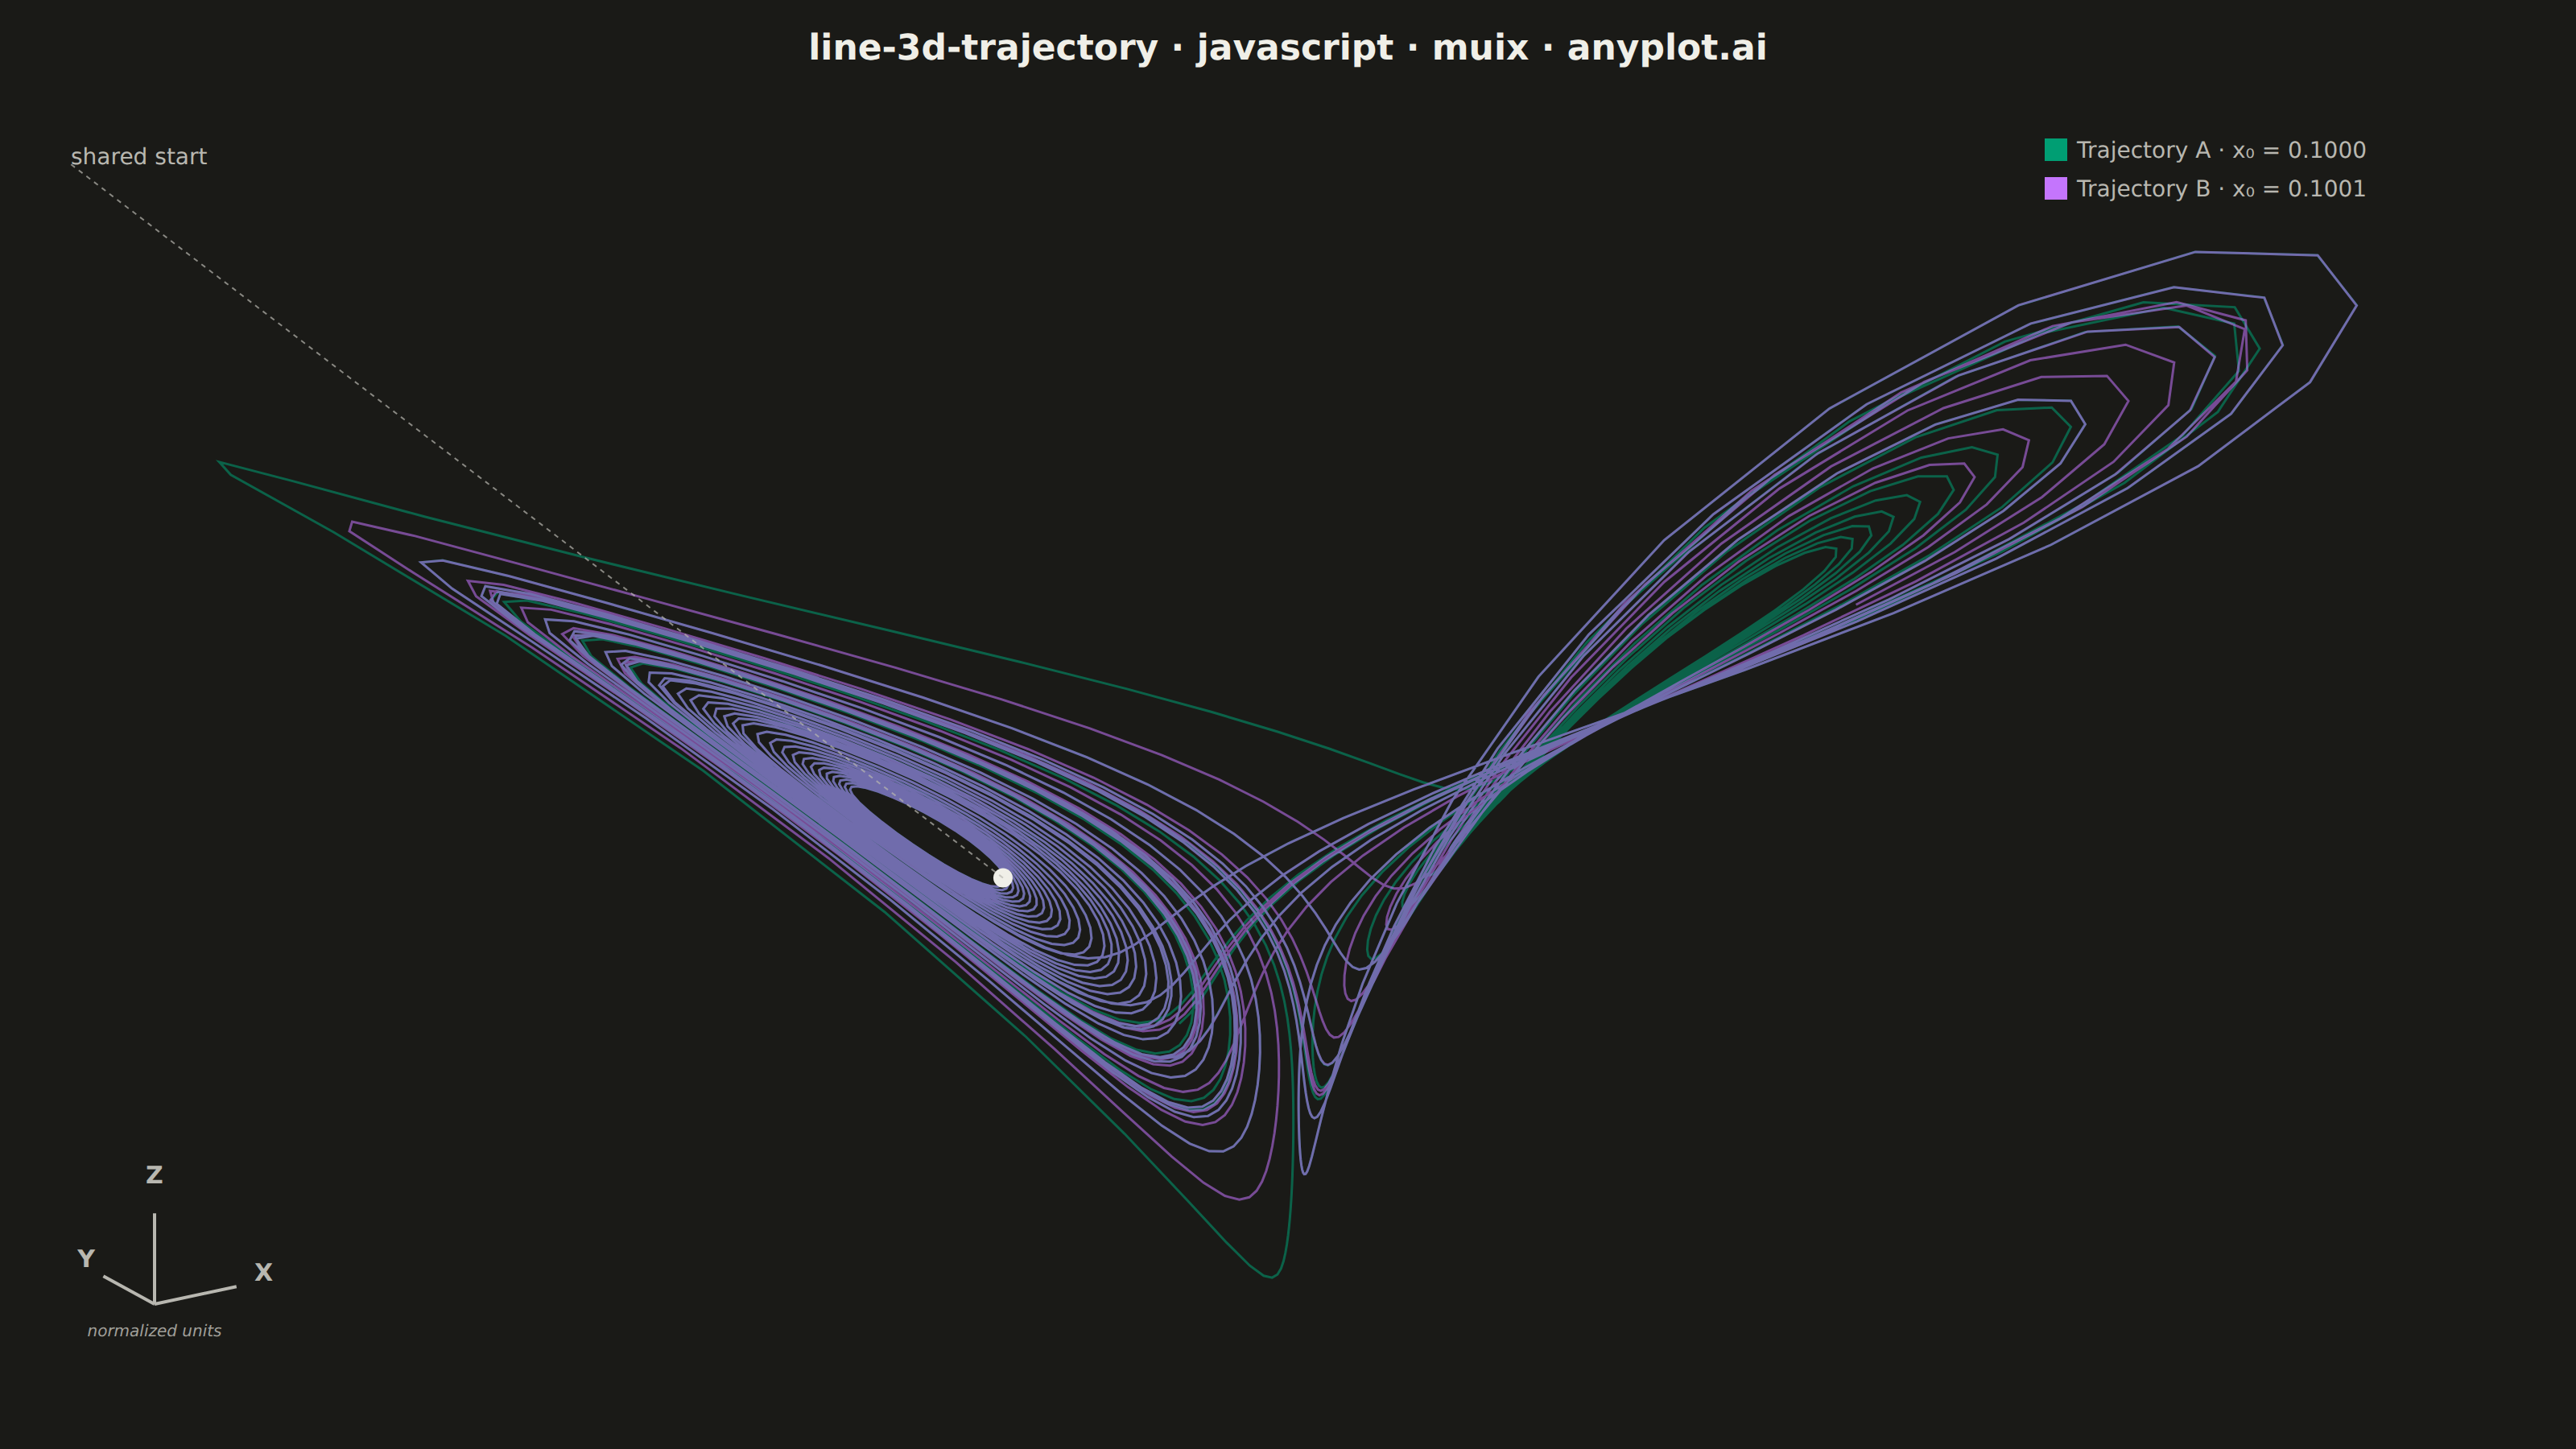
The same plot in 13 other libraries — JavaScript: Chart.js, D3.js, Apache ECharts, Highcharts; Python: Altair, Bokeh, lets-plot, Matplotlib, Plotly, Pygal, Seaborn; R: ggplot2; Julia: Makie.jl. Compare all 14 side by side: 3D Line Plot for Trajectory Visualization in Python, R, Julia and JavaScript.
A 3D line plot that displays paths, trajectories, or curves as connected lines in three-dimensional space. Unlike scatter plots that show discrete points, this visualization connects data points sequentially to reveal continuous paths, making it ideal for understanding motion, mathematical curves, and temporal evolution in 3D. Interactive rotation is essential for exploring the spatial structure of complex trajectories.
// anyplot.ai
// line-3d-trajectory: 3D Line Plot for Trajectory Visualization
// Library: muix 9.16.0 | JavaScript 22.23.3
// Quality: 83/100 | Updated: 2026-10-24

import { ChartsContainer } from "@mui/x-charts/ChartsContainer";
import { useDrawingArea } from "@mui/x-charts/hooks";

const t = window.ANYPLOT_TOKENS;

// Constants
const FONT = '"Plus Jakarta Sans", "Inter", -apple-system, BlinkMacSystemFont, sans-serif';
const MONO = '"JetBrains Mono", "SFMono-Regular", Menlo, monospace';
const ELEV_DEG = 24;
const AZIM_DEG = -40;
const ELEV_RAD = (ELEV_DEG * Math.PI) / 180;
const AZIM_RAD = (AZIM_DEG * Math.PI) / 180;
const COS_AZ = Math.cos(AZIM_RAD);
const SIN_AZ = Math.sin(AZIM_RAD);
const COS_EL = Math.cos(ELEV_RAD);
const SIN_EL = Math.sin(ELEV_RAD);
// Half-extents of the drawn box per axis (x, y, z): a flatter box fits the landscape canvas
const BOX = [1, 1, 0.52];
const PAD_SHARE = 0.05;

// Columns: set these to your data's column names
const X = "Convection rate (X)"; // role: x
const Y = "Horizontal temp var (Y)"; // role: y
const Z = "Vertical temp var (Z)"; // role: z
const TRAJECTORY = "Trajectory"; // role: color

// Data: replace this block with your own records
const SIGMA = 10;
const RHO = 28;
const BETA = 8 / 3;
const DT = 0.01;
const STEPS = 2200;
const TRANSIENT = 200;
const SUBSAMPLE = 1;

const INITIAL_STATES: Array<{ label: string; init: [number, number, number] }> = [
  { label: "Trajectory A (x₀ = 5.0000)", init: [5, 5, 20] },
  { label: "Trajectory B (x₀ = 5.0001)", init: [5.0001, 5, 20] },
];

const data: Array<{
  [TRAJECTORY]: string;
  [X]: number;
  [Y]: number;
  [Z]: number;
}> = [];

for (let s = 0; s < INITIAL_STATES.length; s += 1) {
  const { label, init } = INITIAL_STATES[s];
  let x = init[0];
  let y = init[1];
  let z = init[2];

  for (let i = 0; i < STEPS; i += 1) {
    const k1x = SIGMA * (y - x);
    const k1y = x * (RHO - z) - y;
    const k1z = x * y - BETA * z;

    const x2 = x + 0.5 * DT * k1x;
    const y2 = y + 0.5 * DT * k1y;
    const z2 = z + 0.5 * DT * k1z;
    const k2x = SIGMA * (y2 - x2);
    const k2y = x2 * (RHO - z2) - y2;
    const k2z = x2 * y2 - BETA * z2;

    const x3 = x + 0.5 * DT * k2x;
    const y3 = y + 0.5 * DT * k2y;
    const z3 = z + 0.5 * DT * k2z;
    const k3x = SIGMA * (y3 - x3);
    const k3y = x3 * (RHO - z3) - y3;
    const k3z = x3 * y3 - BETA * z3;

    const x4 = x + DT * k3x;
    const y4 = y + DT * k3y;
    const z4 = z + DT * k3z;
    const k4x = SIGMA * (y4 - x4);
    const k4y = x4 * (RHO - z4) - y4;
    const k4z = x4 * y4 - BETA * z4;

    x += (DT / 6) * (k1x + 2 * k2x + 2 * k3x + k4x);
    y += (DT / 6) * (k1y + 2 * k2y + 2 * k3y + k4y);
    z += (DT / 6) * (k1z + 2 * k2z + 2 * k3z + k4z);

    if (i >= TRANSIENT && (i - TRANSIENT) % SUBSAMPLE === 0) {
      data.push({
        [TRAJECTORY]: label,
        [X]: x,
        [Y]: y,
        [Z]: z,
      });
    }
  }
}

// Plot: reads only data and the constants above
const trajectoryNames = Array.from(new Set(data.map((d) => d[TRAJECTORY])));

const COLS = [X, Y, Z] as const;
const ranges = COLS.map((c) => {
  const vals = data.map((d) => d[c]);
  return { min: Math.min(...vals), max: Math.max(...vals) };
});

interface ScreenPt {
  sx: number;
  sy: number;
  depth: number;
}

// Orthographic oblique projection of box coordinates (each in [-1, 1])
function project(n: [number, number, number]): ScreenPt {
  const bx = n[0] * BOX[0];
  const by = n[1] * BOX[1];
  const bz = n[2] * BOX[2];
  const xRot = bx * COS_AZ - by * SIN_AZ;
  const depth = bx * SIN_AZ + by * COS_AZ;
  return { sx: xRot, sy: depth * SIN_EL + bz * COS_EL, depth };
}

const projectedTrajectories = trajectoryNames.map((name, idx) => ({
  name,
  color: t.palette[idx],
  points: data
    .filter((d) => d[TRAJECTORY] === name)
    .map((d) =>
      project(
        COLS.map(
          (c, k) => (2 * (d[c] - ranges[k].min)) / (ranges[k].max - ranges[k].min) - 1,
        ) as [number, number, number],
      ),
    ),
}));

// Floor corners sorted into near / left / right / far for the current view
const floor = (
  [
    [-1, -1],
    [1, -1],
    [1, 1],
    [-1, 1],
  ] as Array<[number, number]>
).map(([a, b]) => ({ a, b, bottom: project([a, b, -1]), top: project([a, b, 1]) }));
const byDepth = [...floor].sort((p, q) => p.bottom.depth - q.bottom.depth);
const near = byDepth[0];
const far = byDepth[3];
const [leftC, rightC] = [byDepth[1], byDepth[2]].sort((p, q) => p.bottom.sx - q.bottom.sx);

const allScreenPts = [
  ...projectedTrajectories.flatMap((tr) => tr.points),
  ...floor.flatMap((c) => [c.bottom, c.top]),
];
const SX_MIN = Math.min(...allScreenPts.map((p) => p.sx));
const SX_MAX = Math.max(...allScreenPts.map((p) => p.sx));
const SY_MIN = Math.min(...allScreenPts.map((p) => p.sy));
const SY_MAX = Math.max(...allScreenPts.map((p) => p.sy));
const PAD = Math.max(SX_MAX - SX_MIN, SY_MAX - SY_MIN) * PAD_SHARE;
const DOM_X0 = SX_MIN - PAD;
const DOM_X1 = SX_MAX + PAD;
const DOM_Y0 = SY_MIN - PAD;
const DOM_Y1 = SY_MAX + PAD;

const axisLabel = (k: number) => {
  const { min, max } = ranges[k];
  const fmt = (v: number) => (v > 0 ? `+${v.toFixed(0)}` : v.toFixed(0));
  return `${COLS[k]} [${fmt(min)} to ${fmt(max)}]`;
};

const gizmoAxes = ["X", "Y", "Z"].map((label, k) => {
  const unit: [number, number, number] = [0, 0, 0];
  unit[k] = 1;
  const p = project(unit);
  return { label, sx: p.sx / BOX[k], sy: p.sy / BOX[k] };
});

function TrajectoriesLayer() {
  const { left, top, width, height: areaHeight } = useDrawingArea();

  const xDomSpan = DOM_X1 - DOM_X0;
  const yDomSpan = DOM_Y1 - DOM_Y0;
  const scale = Math.min(width / xDomSpan, areaHeight / yDomSpan);
  const offsetX = left + (width - xDomSpan * scale) / 2;
  const offsetY = top + (areaHeight - yDomSpan * scale) / 2;
  const px = (p: ScreenPt) => ({
    x: offsetX + (p.sx - DOM_X0) * scale,
    y: offsetY + (DOM_Y1 - p.sy) * scale,
  });
  const pts = (...ps: ScreenPt[]) =>
    ps
      .map(px)
      .map((q) => `${q.x.toFixed(1)},${q.y.toFixed(1)}`)
      .join(" ");
  // Uniform Catmull-Rom spline through every point: same vertices, smooth turns
  const smoothPath = (ps: ScreenPt[]) => {
    const q = ps.map(px);
    const f = (v: number) => v.toFixed(1);
    let d = `M${f(q[0].x)},${f(q[0].y)}`;
    for (let i = 0; i < q.length - 1; i += 1) {
      const p0 = q[Math.max(i - 1, 0)];
      const p1 = q[i];
      const p2 = q[i + 1];
      const p3 = q[Math.min(i + 2, q.length - 1)];
      d += `C${f(p1.x + (p2.x - p0.x) / 6)},${f(p1.y + (p2.y - p0.y) / 6)} ${f(p2.x - (p3.x - p1.x) / 6)},${f(p2.y - (p3.y - p1.y) / 6)} ${f(p2.x)},${f(p2.y)}`;
    }
    return d;
  };

  const boxCenter = px(project([0, 0, -1]));

  // Front floor edges carry the X / Y titles, parallel to the edge and pushed outward
  const edgeTitle = (c: typeof near, k: number) => {
    const p0 = px(near.bottom);
    const p1 = px(c.bottom);
    const mid = { x: (p0.x + p1.x) / 2, y: (p0.y + p1.y) / 2 };
    const len = Math.hypot(p1.x - p0.x, p1.y - p0.y);
    let nx = (p1.y - p0.y) / len;
    let ny = -(p1.x - p0.x) / len;
    if (nx * (mid.x - boxCenter.x) + ny * (mid.y - boxCenter.y) < 0) {
      nx = -nx;
      ny = -ny;
    }
    let angle = (Math.atan2(p1.y - p0.y, p1.x - p0.x) * 180) / Math.PI;
    if (angle > 90) angle -= 180;
    if (angle < -90) angle += 180;
    return { x: mid.x + nx * 30, y: mid.y + ny * 30, angle, text: axisLabel(k) };
  };
  const frontTitles = [leftC, rightC].map((c) => edgeTitle(c, c.a !== near.a ? 0 : 1));

  const zBottom = px(leftC.bottom);
  const zTop = px(leftC.top);
  const zTitle = { x: zBottom.x - 26, y: (zBottom.y + zTop.y) / 2 };

  const starts = projectedTrajectories.map((tr) => px(tr.points[0]));
  const startsClose = starts.length > 1 && starts.every((s) => Math.hypot(s.x - starts[0].x, s.y - starts[0].y) < 6);
  const gizmoOrigin = { x: left + 96, y: top + areaHeight - 104 };
  const ARM = 52;

  return (
    <g>
      {/* Floor and the two back walls as a light reference frame */}
      <polygon
        points={pts(near.bottom, rightC.bottom, far.bottom, leftC.bottom)}
        fill={t.elevatedBg}
        fillOpacity={0.35}
        stroke={t.grid}
        strokeWidth={1.2}
      />
      {[leftC, rightC].map((c) => (
        <polygon
          key={`wall-${c.a}-${c.b}`}
          points={pts(c.bottom, far.bottom, far.top, c.top)}
          fill={t.elevatedBg}
          fillOpacity={0.18}
          stroke={t.grid}
          strokeWidth={1.2}
          strokeDasharray="4 4"
        />
      ))}

      {/* Labeled outer axis edges */}
      {[leftC, rightC].map((c) => {
        const a = px(near.bottom);
        const b = px(c.bottom);
        return (
          <line key={`edge-${c.a}-${c.b}`} x1={a.x} y1={a.y} x2={b.x} y2={b.y} stroke={t.inkSoft} strokeWidth={2} />
        );
      })}
      <line x1={zBottom.x} y1={zBottom.y} x2={zTop.x} y2={zTop.y} stroke={t.inkSoft} strokeWidth={2} />
      {frontTitles.map((ft) => (
        <text
          key={ft.text}
          x={ft.x}
          y={ft.y}
          fill={t.ink}
          fontSize={14}
          fontWeight={600}
          textAnchor="middle"
          dominantBaseline="middle"
          transform={`rotate(${ft.angle.toFixed(1)} ${ft.x.toFixed(1)} ${ft.y.toFixed(1)})`}
        >
          {ft.text}
        </text>
      ))}
      <text
        x={zTitle.x}
        y={zTitle.y}
        fill={t.ink}
        fontSize={14}
        fontWeight={600}
        textAnchor="middle"
        dominantBaseline="middle"
        transform={`rotate(-90 ${zTitle.x.toFixed(1)} ${zTitle.y.toFixed(1)})`}
      >
        {axisLabel(2)}
      </text>

      {/* Trajectories: thin translucent strands so overlapping paths stay traceable */}
      {projectedTrajectories.map((traj) => (
        <path
          key={traj.name}
          d={smoothPath(traj.points)}
          fill="none"
          stroke={traj.color}
          strokeWidth={1.2}
          strokeOpacity={0.5}
          strokeLinejoin="round"
        />
      ))}

      {/* End markers drawn above both strands */}
      {projectedTrajectories.map((traj) => {
        const end = px(traj.points[traj.points.length - 1]);
        return (
          <circle
            key={`end-${traj.name}`}
            cx={end.x}
            cy={end.y}
            r={6}
            fill={traj.color}
            stroke={t.pageBg}
            strokeWidth={1.8}
          />
        );
      })}

      {/* Start marker and conditional shared-start callout */}
      {startsClose ? (
        <g>
          <circle cx={starts[0].x} cy={starts[0].y} r={6.5} fill={t.ink} stroke={t.pageBg} strokeWidth={1.5} />
          <text
            x={starts[0].x + 12}
            y={starts[0].y - 12}
            fill={t.ink}
            fontSize={14}
            fontWeight={600}
            fontFamily={MONO}
            textAnchor="start"
          >
            Shared start
          </text>
        </g>
      ) : (
        projectedTrajectories.map((traj, i) => (
          <circle
            key={`start-${traj.name}`}
            cx={starts[i].x}
            cy={starts[i].y}
            r={5}
            fill={t.ink}
            stroke={traj.color}
            strokeWidth={2}
          />
        ))
      )}

      {/* 3D orientation triad */}
      {gizmoAxes.map((a) => (
        <g key={a.label}>
          <line
            x1={gizmoOrigin.x}
            y1={gizmoOrigin.y}
            x2={gizmoOrigin.x + a.sx * ARM}
            y2={gizmoOrigin.y - a.sy * ARM}
            stroke={t.inkSoft}
            strokeWidth={2}
          />
          <text
            x={gizmoOrigin.x + a.sx * (ARM + 16)}
            y={gizmoOrigin.y - a.sy * (ARM + 16)}
            fill={t.ink}
            textAnchor="middle"
            dominantBaseline="middle"
            fontSize={15}
            fontWeight={700}
          >
            {a.label}
          </text>
        </g>
      ))}
      <text
        x={gizmoOrigin.x}
        y={gizmoOrigin.y + 72}
        fill={t.inkSoft}
        textAnchor="middle"
        fontSize={14}
        fontFamily={MONO}
      >
        elev {ELEV_DEG}°, azim {AZIM_DEG}°
      </text>
    </g>
  );
}

export default function Chart() {
  const W = window.ANYPLOT_SIZE.width;
  const H = window.ANYPLOT_SIZE.height;
  const HEADER_H = 84;
  const chartH = H - HEADER_H;

  return (
    <div
      style={{
        width: W,
        height: H,
        background: t.pageBg,
        color: t.ink,
        fontFamily: FONT,
        display: "flex",
        flexDirection: "column",
        boxSizing: "border-box",
      }}
    >
      <div
        style={{
          height: HEADER_H,
          padding: "14px 44px 4px 44px",
          display: "flex",
          alignItems: "center",
          justifyContent: "space-between",
          boxSizing: "border-box",
        }}
      >
        <div>
          <div
            style={{
              fontSize: 22,
              fontWeight: 700,
              color: t.ink,
              lineHeight: 1.2,
            }}
          >
            line-3d-trajectory · javascript · muix · anyplot.ai
          </div>
          <div
            style={{
              fontSize: 14,
              color: t.inkSoft,
              marginTop: 4,
              fontFamily: MONO,
            }}
          >
            {projectedTrajectories.length} trajectories ·{" "}
            {projectedTrajectories[0].points.length.toLocaleString()} points per
            trajectory ({X}, {Y}, {Z})
          </div>
        </div>

        <div
          style={{
            display: "flex",
            alignItems: "center",
            gap: 24,
            fontSize: 15,
            color: t.ink,
          }}
        >
          {projectedTrajectories.map((traj) => (
            <div
              key={traj.name}
              style={{ display: "flex", alignItems: "center", gap: 8 }}
            >
              <span
                style={{
                  width: 22,
                  height: 3,
                  borderRadius: 2,
                  background: traj.color,
                  display: "inline-block",
                }}
              />
              <span>{traj.name}</span>
            </div>
          ))}
        </div>
      </div>

      <ChartsContainer
        width={W}
        height={chartH}
        skipAnimation
        series={[]}
        xAxis={[{ min: 0, max: 1, position: "none" }]}
        yAxis={[{ min: 0, max: 1, position: "none" }]}
        margin={{ top: 12, bottom: 24, left: 32, right: 32 }}
      >
        <TrajectoriesLayer />
      </ChartsContainer>
    </div>
  );
}
Runnable source as JSON, for any HTTP client: https://api.anyplot.ai/specs/line-3d-trajectory/muix/code. Any spec id and library id listed in llms-full.txt fit the same URL shape; every URL below is complete and callable.
{
  "spec_id": "line-3d-trajectory",
  "language": "javascript",
  "library": "muix",
  "page": "https://anyplot.ai/line-3d-trajectory/javascript/muix",
  "hub": "https://anyplot.ai/line-3d-trajectory",
  "code_json": "https://api.anyplot.ai/specs/line-3d-trajectory/muix/code",
  "spec_json": "https://api.anyplot.ai/specs/line-3d-trajectory",
  "render_light_png": "https://storage.googleapis.com/anyplot-images/plots/line-3d-trajectory/javascript/muix/plot-light.png",
  "render_dark_png": "https://storage.googleapis.com/anyplot-images/plots/line-3d-trajectory/javascript/muix/plot-dark.png",
  "interactive_light_html": "https://storage.googleapis.com/anyplot-images/plots/line-3d-trajectory/javascript/muix/plot-light.html",
  "interactive_dark_html": "https://storage.googleapis.com/anyplot-images/plots/line-3d-trajectory/javascript/muix/plot-dark.html",
  "quality_score": 83.0,
  "license": "MIT",
  "guide": "https://anyplot.ai/llms.txt"
}
Part of 3D Line Plot for Trajectory Visualization on anyplot.ai.