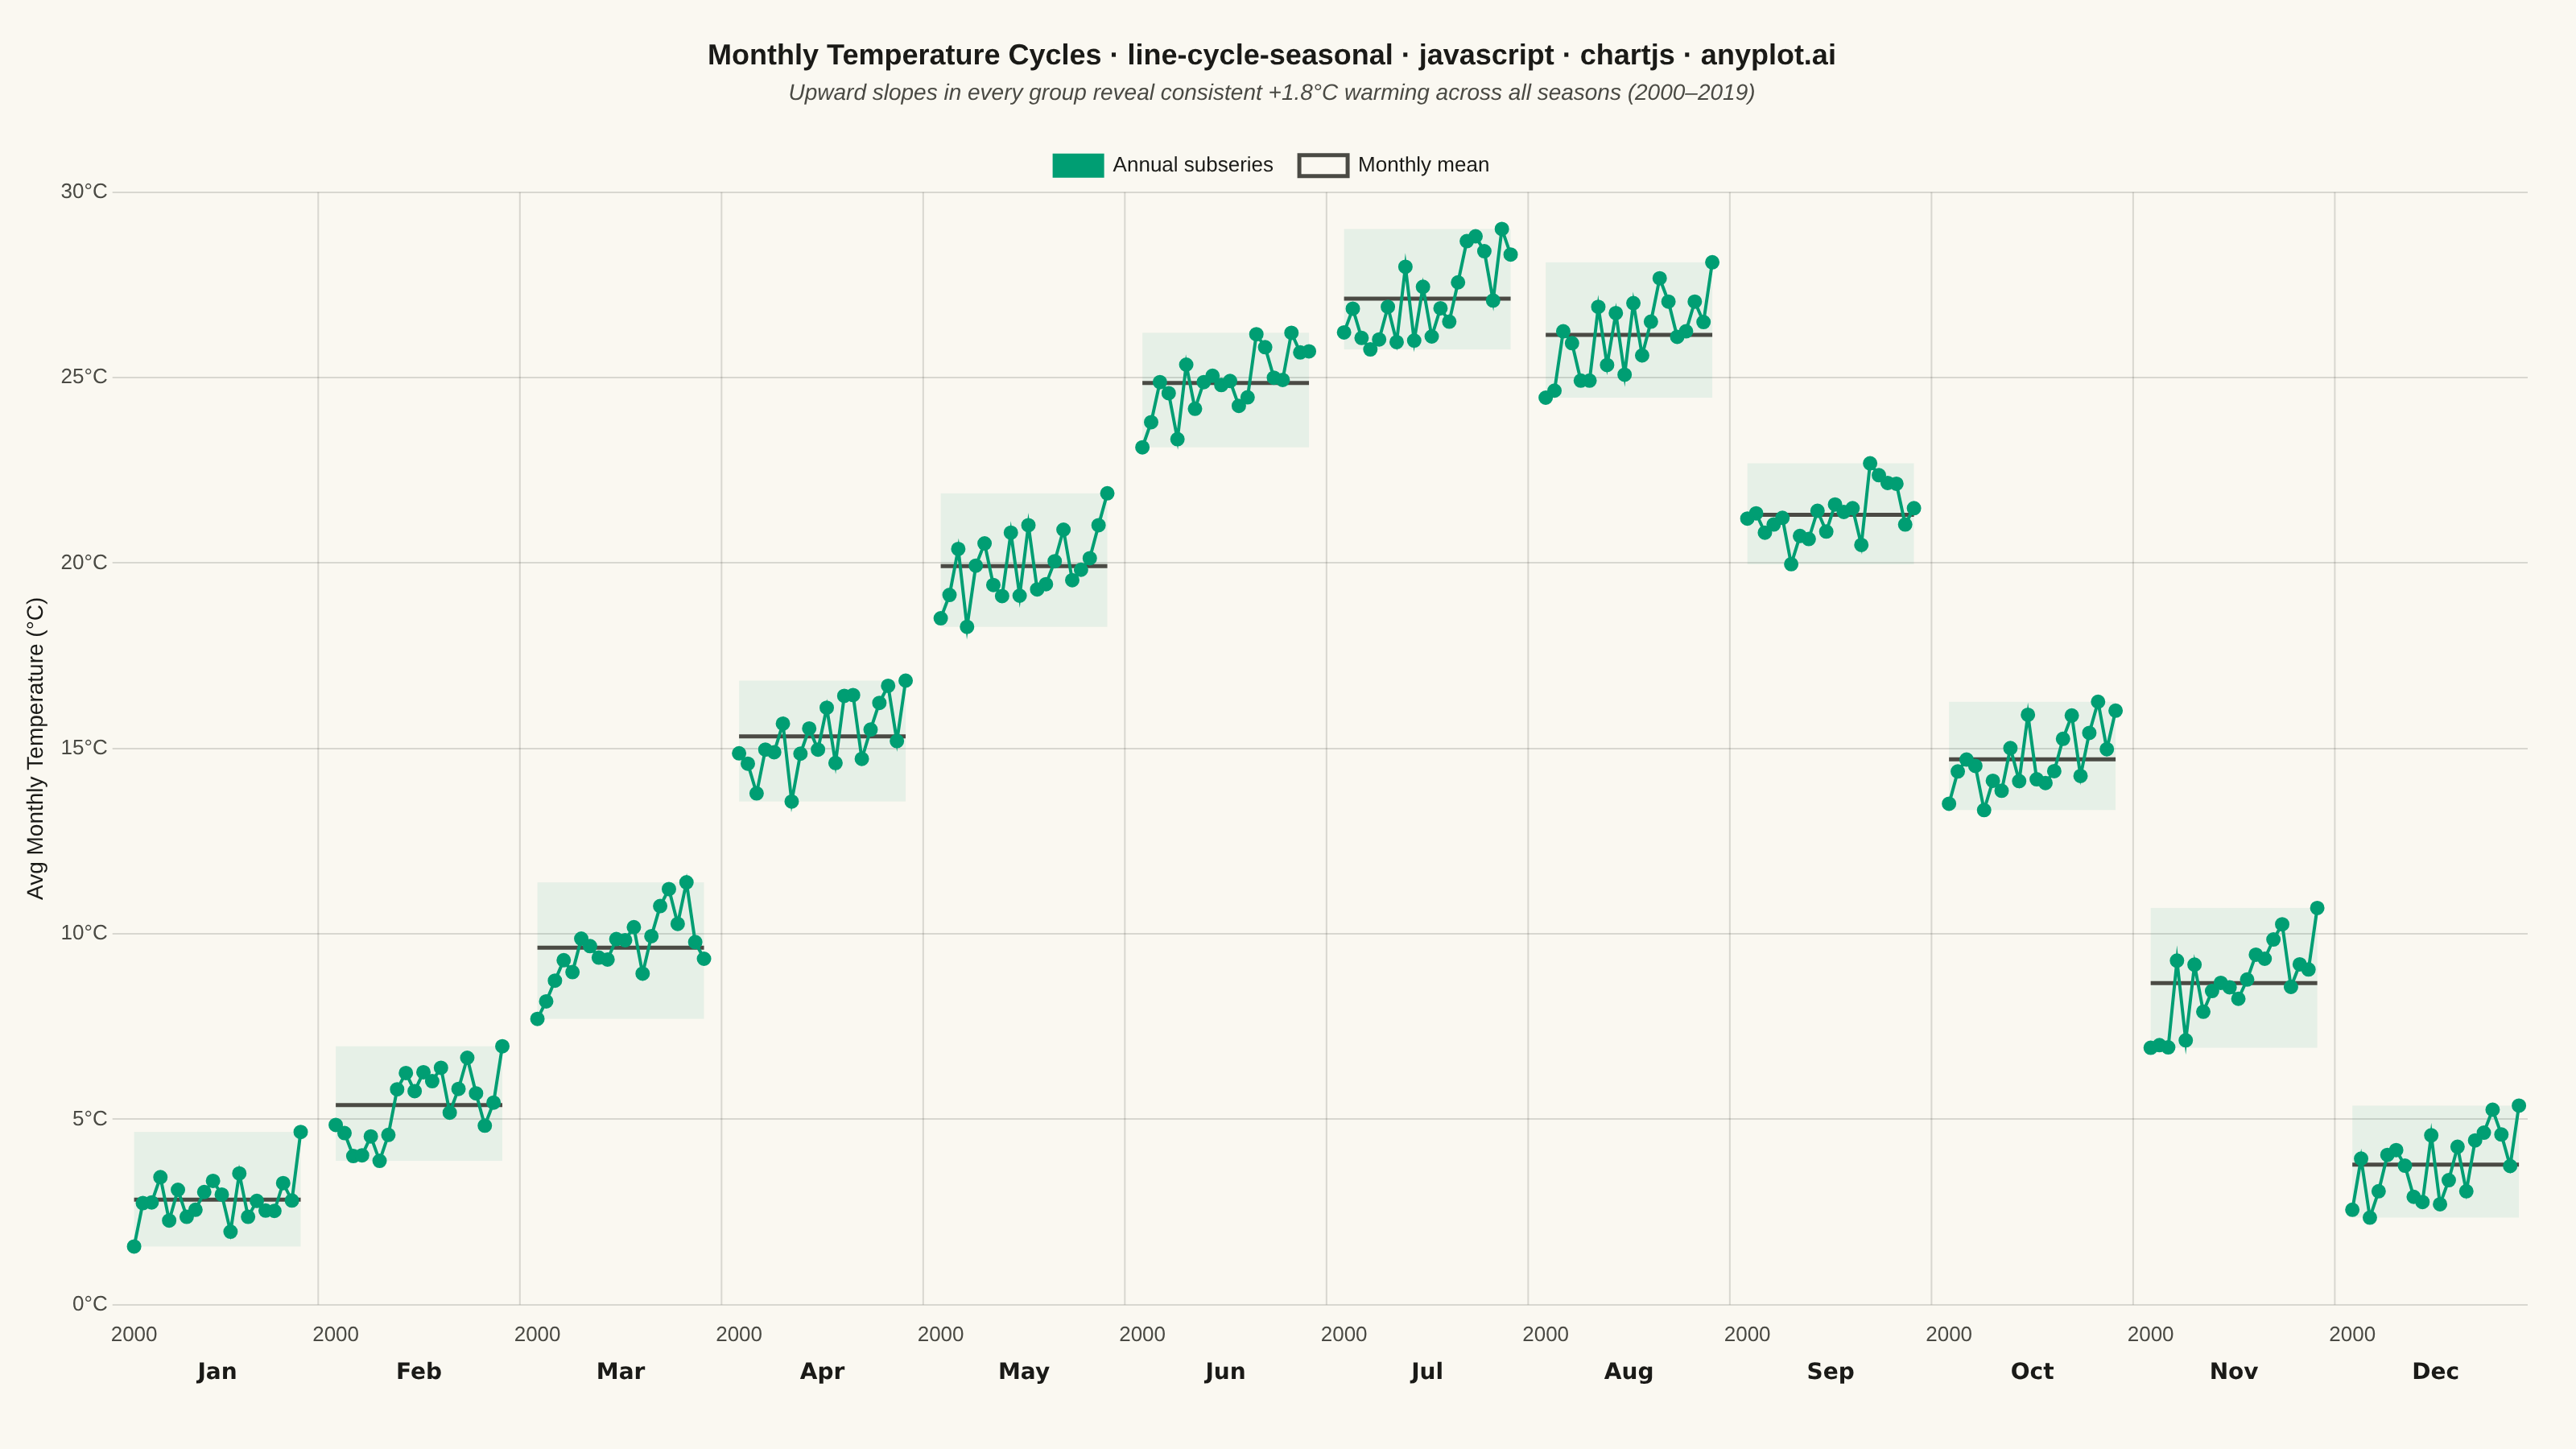
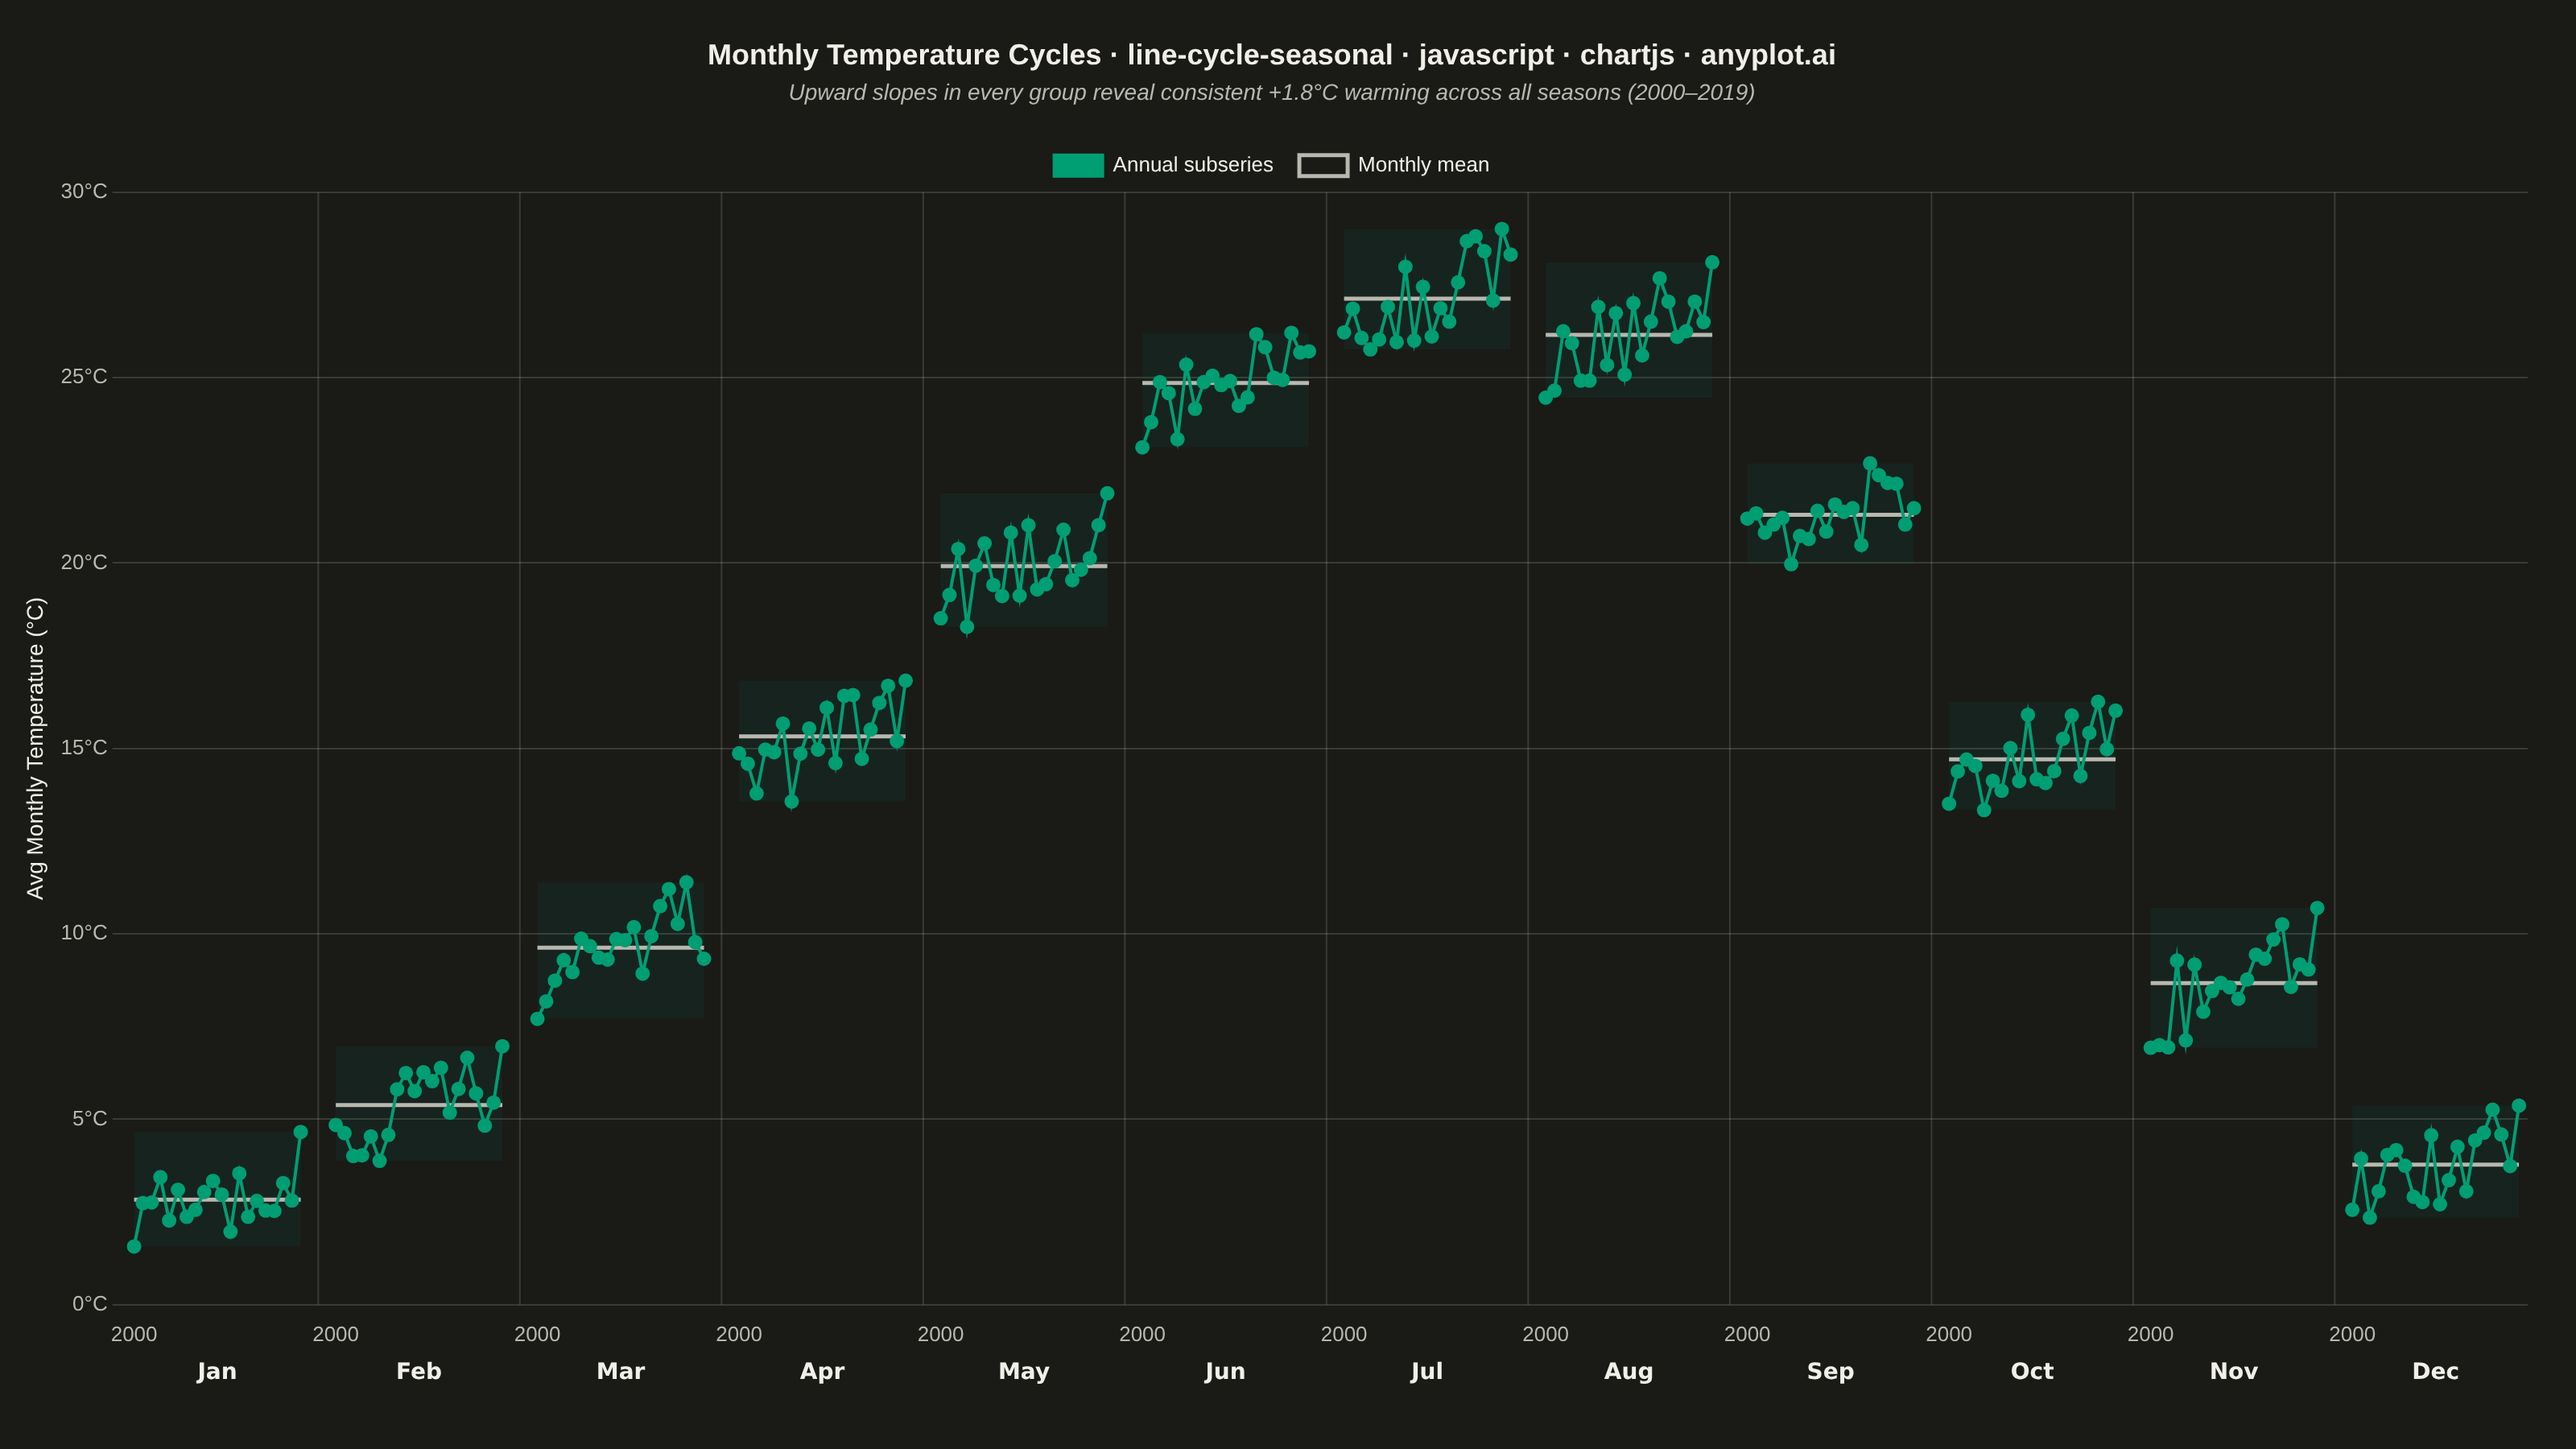
A cycle plot, also known as a seasonal subseries plot (introduced by William Cleveland), separates the seasonal pattern of a time series from the trend within each season. The series is split by seasonal period (e.g. one group per month or weekday); within each group the values are drawn in chronological order as a small line, and a horizontal reference line marks that group's mean. Comparing the mean lines across groups reveals the seasonal effect, while the slope of each subseries reveals the trend within that season — two patterns that are entangled in a standard time series plot.
// anyplot.ai
// line-cycle-seasonal: Cycle Plot (Seasonal Subseries)
// Library: chartjs 4.4.7 | JavaScript 22.22.3
// Quality: 92/100 | Created: 2026-06-15
//# anyplot-orientation: landscape

const t = window.ANYPLOT_TOKENS;

// --- Data -------------------------------------------------------------------
const MONTHS = ["Jan","Feb","Mar","Apr","May","Jun","Jul","Aug","Sep","Oct","Nov","Dec"];
const BASE_TEMPS = [2.1, 4.3, 8.7, 14.2, 19.1, 23.8, 26.2, 25.4, 20.3, 13.9, 7.8, 2.9];
const N_YEARS = 20;
const YEAR_START = 2000;
const GROUP_W = N_YEARS;
const GAP = 3;

// Park-Miller LCG — deterministic, no Date/Math.random
let _seed = 12345;
const rng = () => { _seed = (_seed * 48271) % 2147483647; return _seed / 2147483647; };

const gs = m => m * (GROUP_W + GAP);

// Monthly average temperatures across 20 years with warming trend + noise
const temps = MONTHS.map((_, m) =>
  Array.from({ length: N_YEARS }, (_, y) => {
    const trend = (y / (N_YEARS - 1)) * 1.8;
    const noise = (rng() - 0.5) * 2.4;
    return +(BASE_TEMPS[m] + trend + noise).toFixed(2);
  })
);

const means = temps.map(arr => arr.reduce((a, b) => a + b, 0) / arr.length);

// --- Mount ------------------------------------------------------------------
const canvas = document.createElement("canvas");
document.getElementById("container").appendChild(canvas);

// --- Datasets ---------------------------------------------------------------
// One scatter+line dataset per month (subseries)
const subDatasets = MONTHS.map((_, m) => ({
  label: MONTHS[m],
  data: temps[m].map((v, y) => ({ x: gs(m) + y, y: v })),
  showLine: true,
  tension: 0,
  borderColor: t.palette[0],
  backgroundColor: t.palette[0],
  borderWidth: 2,
  pointRadius: 3.5,
  pointHoverRadius: 0,
}));

// One 2-point line per month for the horizontal mean reference
const meanDatasets = MONTHS.map((_, m) => ({
  label: `_mean${m}`,
  data: [
    { x: gs(m), y: means[m] },
    { x: gs(m) + N_YEARS - 1, y: means[m] },
  ],
  showLine: true,
  tension: 0,
  borderColor: t.inkSoft,
  backgroundColor: "transparent",
  borderWidth: 2.5,
  pointRadius: 0,
}));

// --- Title ------------------------------------------------------------------
const TITLE = "Monthly Temperature Cycles · line-cycle-seasonal · javascript · chartjs · anyplot.ai";
const titleSize = Math.max(13, Math.round(22 * 67 / TITLE.length));

// --- Plugin: range bands (behind data), separators, month labels ------------
const groupPlugin = {
  id: "cycleGroups",
  // Draw min-max range envelope behind the subseries lines
  beforeDatasetsDraw(chart) {
    const { ctx } = chart;
    const xScale = chart.scales.x;
    const yScale = chart.scales.y;
    ctx.save();
    MONTHS.forEach((_, m) => {
      const vals = temps[m];
      const minV = Math.min(...vals);
      const maxV = Math.max(...vals);
      const x0 = xScale.getPixelForValue(gs(m));
      const x1 = xScale.getPixelForValue(gs(m) + N_YEARS - 1);
      const yTop = yScale.getPixelForValue(maxV);
      const yBot = yScale.getPixelForValue(minV);
      ctx.fillStyle = "rgba(0,158,115,0.08)";
      ctx.fillRect(x0, yTop, x1 - x0, yBot - yTop);
    });
    ctx.restore();
  },
  afterDraw(chart) {
    const { ctx, chartArea } = chart;
    const xScale = chart.scales.x;
    ctx.save();

    MONTHS.forEach((month, m) => {
      const x0 = xScale.getPixelForValue(gs(m));
      const x1 = xScale.getPixelForValue(gs(m) + N_YEARS - 1);

      // Subtle vertical separator between groups
      if (m > 0) {
        const prevX1 = xScale.getPixelForValue(gs(m - 1) + N_YEARS - 1);
        const sepX = (prevX1 + x0) / 2;
        ctx.beginPath();
        ctx.strokeStyle = t.grid;
        ctx.lineWidth = 1;
        ctx.moveTo(sepX, chartArea.top);
        ctx.lineTo(sepX, chartArea.bottom);
        ctx.stroke();
      }

      // Month label drawn below the x-axis tick labels
      ctx.font = "bold 14px system-ui, sans-serif";
      ctx.fillStyle = t.ink;
      ctx.textAlign = "center";
      ctx.textBaseline = "top";
      ctx.fillText(month, (x0 + x1) / 2, xScale.bottom + 6);
    });

    ctx.restore();
  },
};

// --- Chart ------------------------------------------------------------------
new Chart(canvas, {
  type: "scatter",
  plugins: [groupPlugin],
  data: { datasets: [...subDatasets, ...meanDatasets] },
  options: {
    responsive: true,
    maintainAspectRatio: false,
    animation: false,
    layout: { padding: { top: 16, right: 30, bottom: 60, left: 10 } },
    plugins: {
      title: {
        display: true,
        text: TITLE,
        color: t.ink,
        font: { size: titleSize, weight: "600" },
        padding: { top: 8, bottom: 4 },
      },
      subtitle: {
        display: true,
        text: "Upward slopes in every group reveal consistent +1.8°C warming across all seasons (2000–2019)",
        color: t.inkSoft,
        font: { size: Math.max(11, Math.round(titleSize * 0.78)), style: "italic" },
        padding: { bottom: 14 },
      },
      legend: {
        display: true,
        labels: {
          color: t.ink,
          font: { size: 13 },
          boxWidth: 30,
          padding: 16,
          generateLabels: () => [
            {
              text: "Annual subseries",
              fillStyle: t.palette[0],
              strokeStyle: t.palette[0],
              fontColor: t.ink,
              lineWidth: 2,
              hidden: false,
              datasetIndex: 0,
            },
            {
              text: "Monthly mean",
              fillStyle: "transparent",
              strokeStyle: t.inkSoft,
              fontColor: t.ink,
              lineWidth: 2.5,
              hidden: false,
              datasetIndex: 12,
            },
          ],
        },
      },
      tooltip: { enabled: false },
    },
    scales: {
      x: {
        type: "linear",
        min: gs(0) - 1,
        max: gs(11) + N_YEARS,
        afterBuildTicks(scale) {
          const ticks = [];
          for (let m = 0; m < 12; m++) {
            ticks.push({ value: gs(m) });
          }
          scale.ticks = ticks;
        },
        ticks: {
          color: t.inkSoft,
          font: { size: 13 },
          maxRotation: 0,
          callback(value) {
            for (let m = 0; m < 12; m++) {
              if (value === gs(m)) return `${YEAR_START}`;
            }
            return null;
          },
        },
        grid: { display: false },
        border: { display: false },
      },
      y: {
        ticks: {
          color: t.inkSoft,
          font: { size: 13 },
          callback: v => `${v.toFixed(0)}°C`,
        },
        grid: { color: t.grid },
        title: {
          display: true,
          text: "Avg Monthly Temperature (°C)",
          color: t.ink,
          font: { size: 14 },
        },
        border: { display: false },
      },
    },
  },
});
Runnable source as JSON, for any HTTP client: https://api.anyplot.ai/specs/line-cycle-seasonal/chartjs/code. Any spec id and library id listed in llms-full.txt fit the same URL shape; every URL below is complete and callable.
{
  "spec_id": "line-cycle-seasonal",
  "language": "javascript",
  "library": "chartjs",
  "page": "https://anyplot.ai/line-cycle-seasonal/javascript/chartjs",
  "hub": "https://anyplot.ai/line-cycle-seasonal",
  "code_json": "https://api.anyplot.ai/specs/line-cycle-seasonal/chartjs/code",
  "spec_json": "https://api.anyplot.ai/specs/line-cycle-seasonal",
  "render_light_png": "https://storage.googleapis.com/anyplot-images/plots/line-cycle-seasonal/javascript/chartjs/plot-light.png",
  "render_dark_png": "https://storage.googleapis.com/anyplot-images/plots/line-cycle-seasonal/javascript/chartjs/plot-dark.png",
  "interactive_light_html": "https://storage.googleapis.com/anyplot-images/plots/line-cycle-seasonal/javascript/chartjs/plot-light.html",
  "interactive_dark_html": "https://storage.googleapis.com/anyplot-images/plots/line-cycle-seasonal/javascript/chartjs/plot-dark.html",
  "quality_score": 92.0,
  "license": "MIT",
  "guide": "https://anyplot.ai/llms.txt"
}
Part of Cycle Plot (Seasonal Subseries) on anyplot.ai.