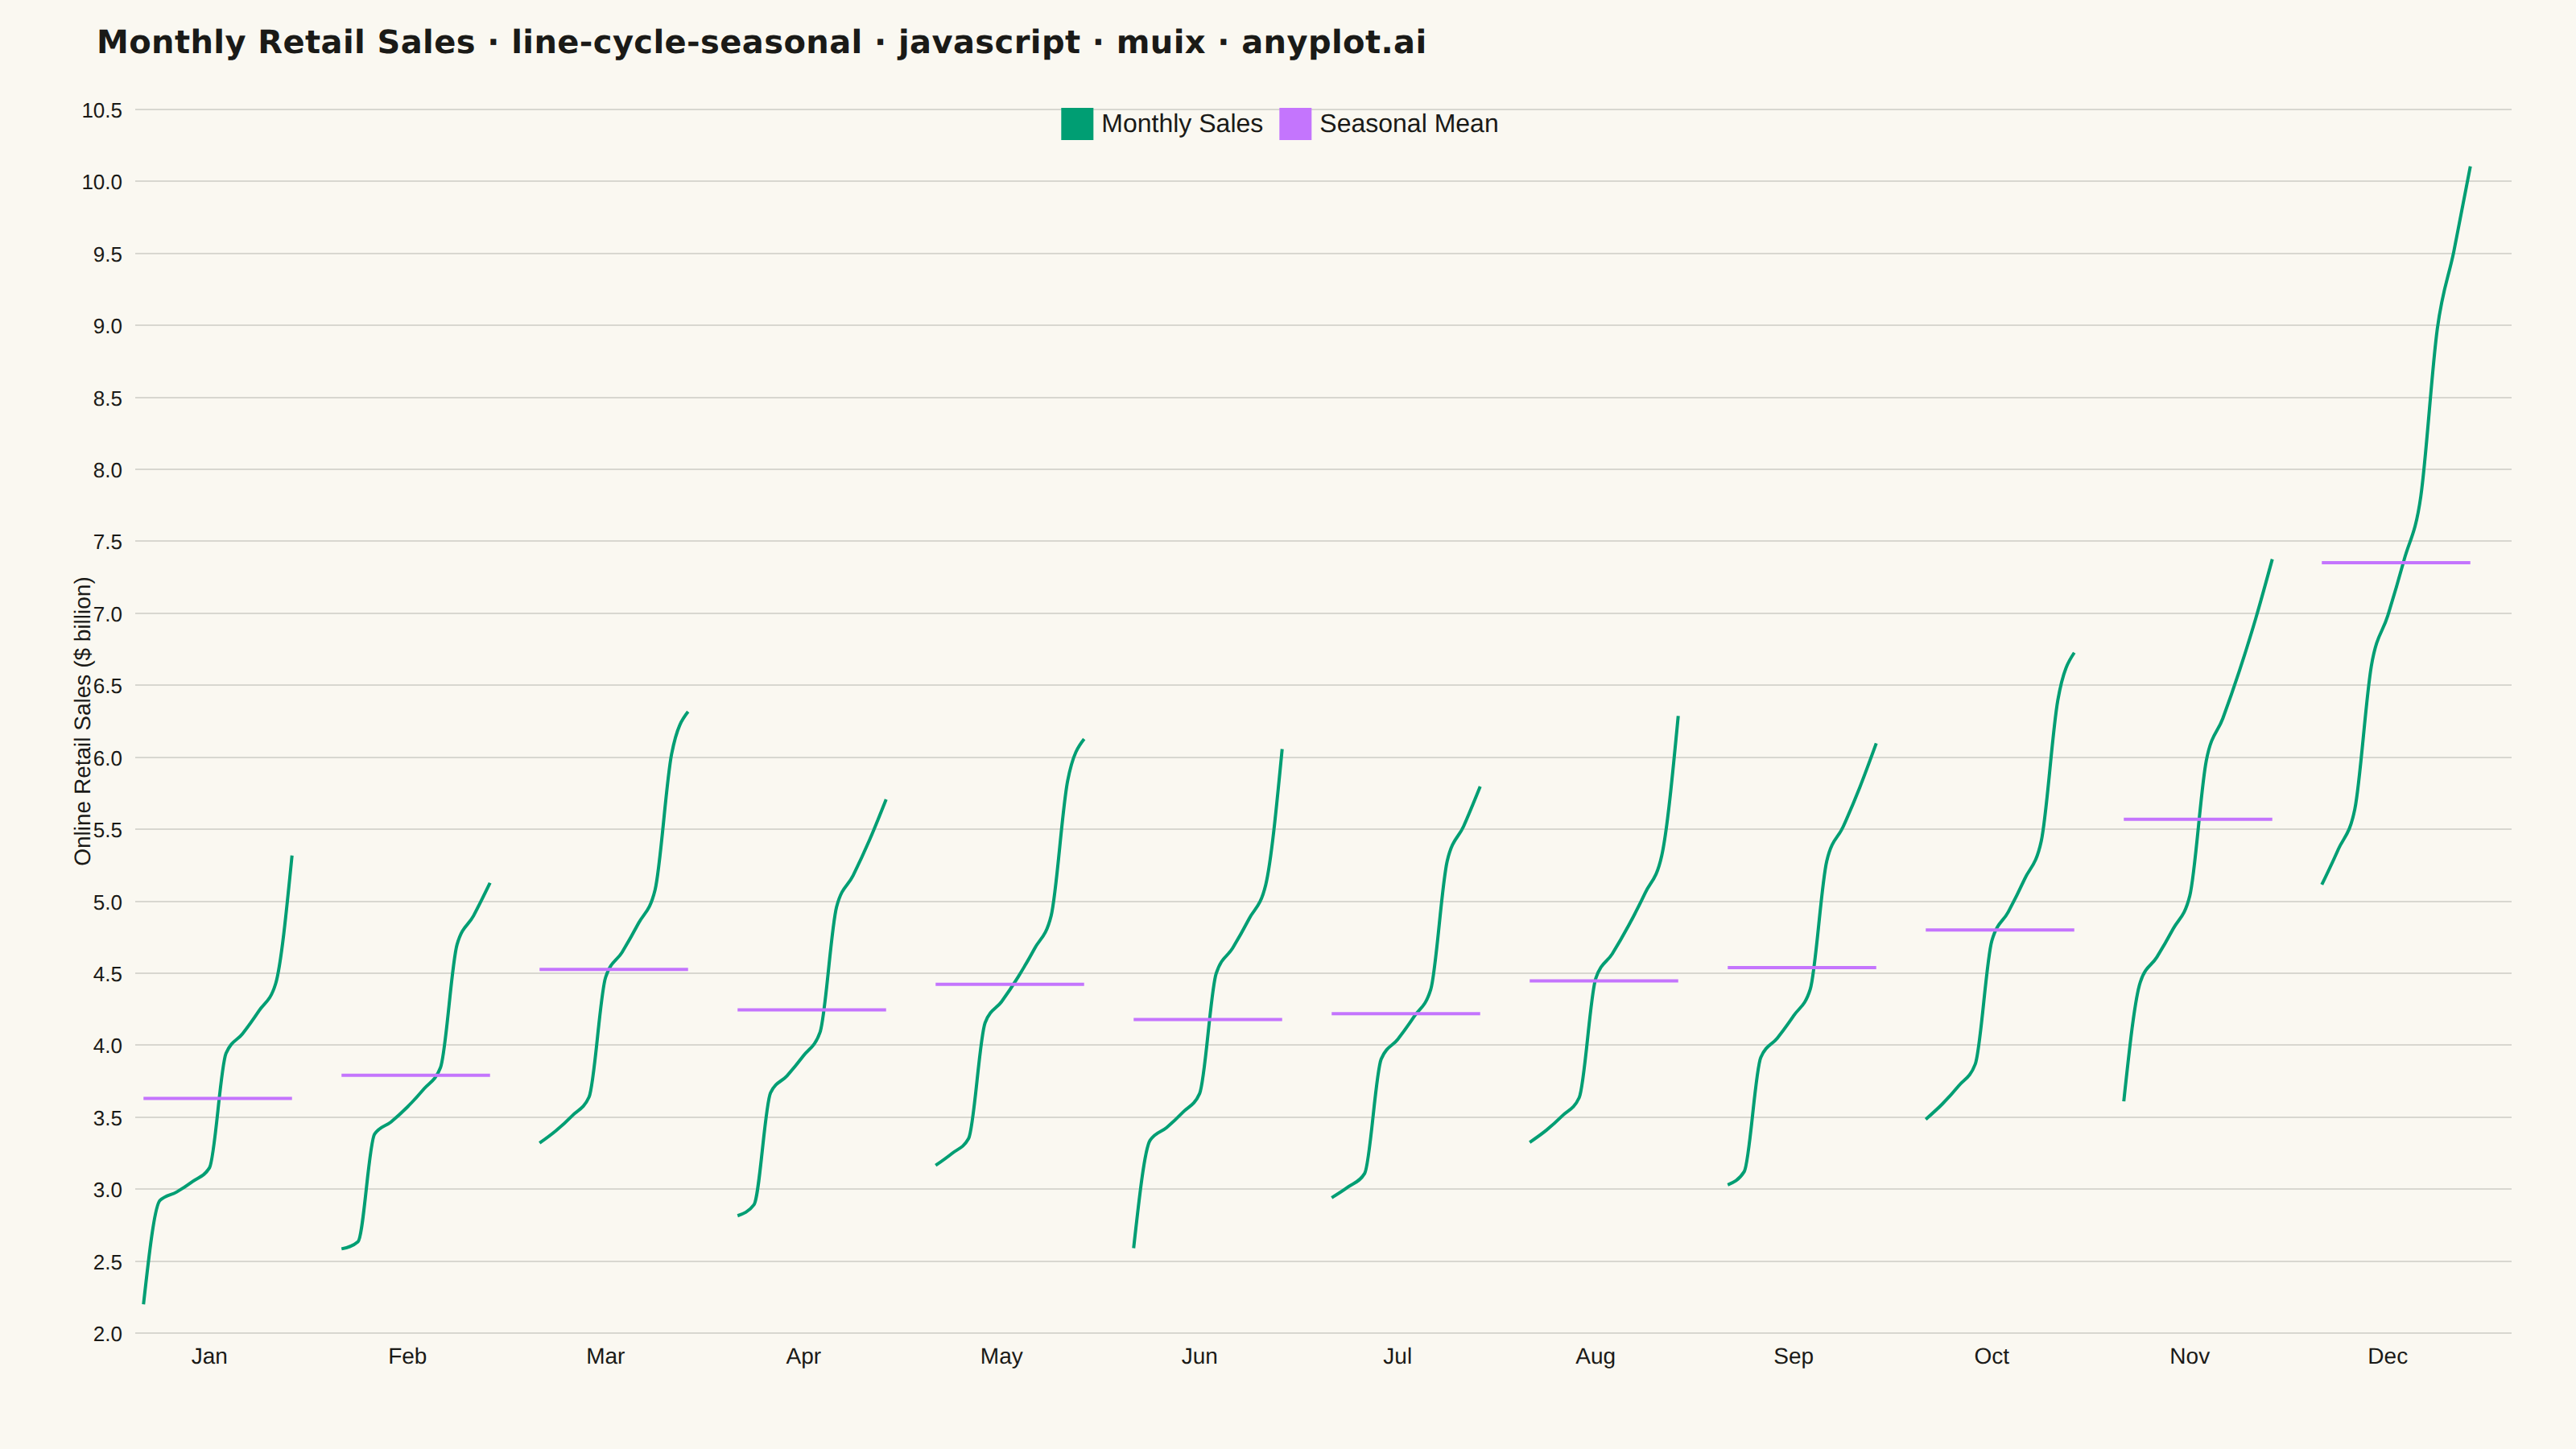
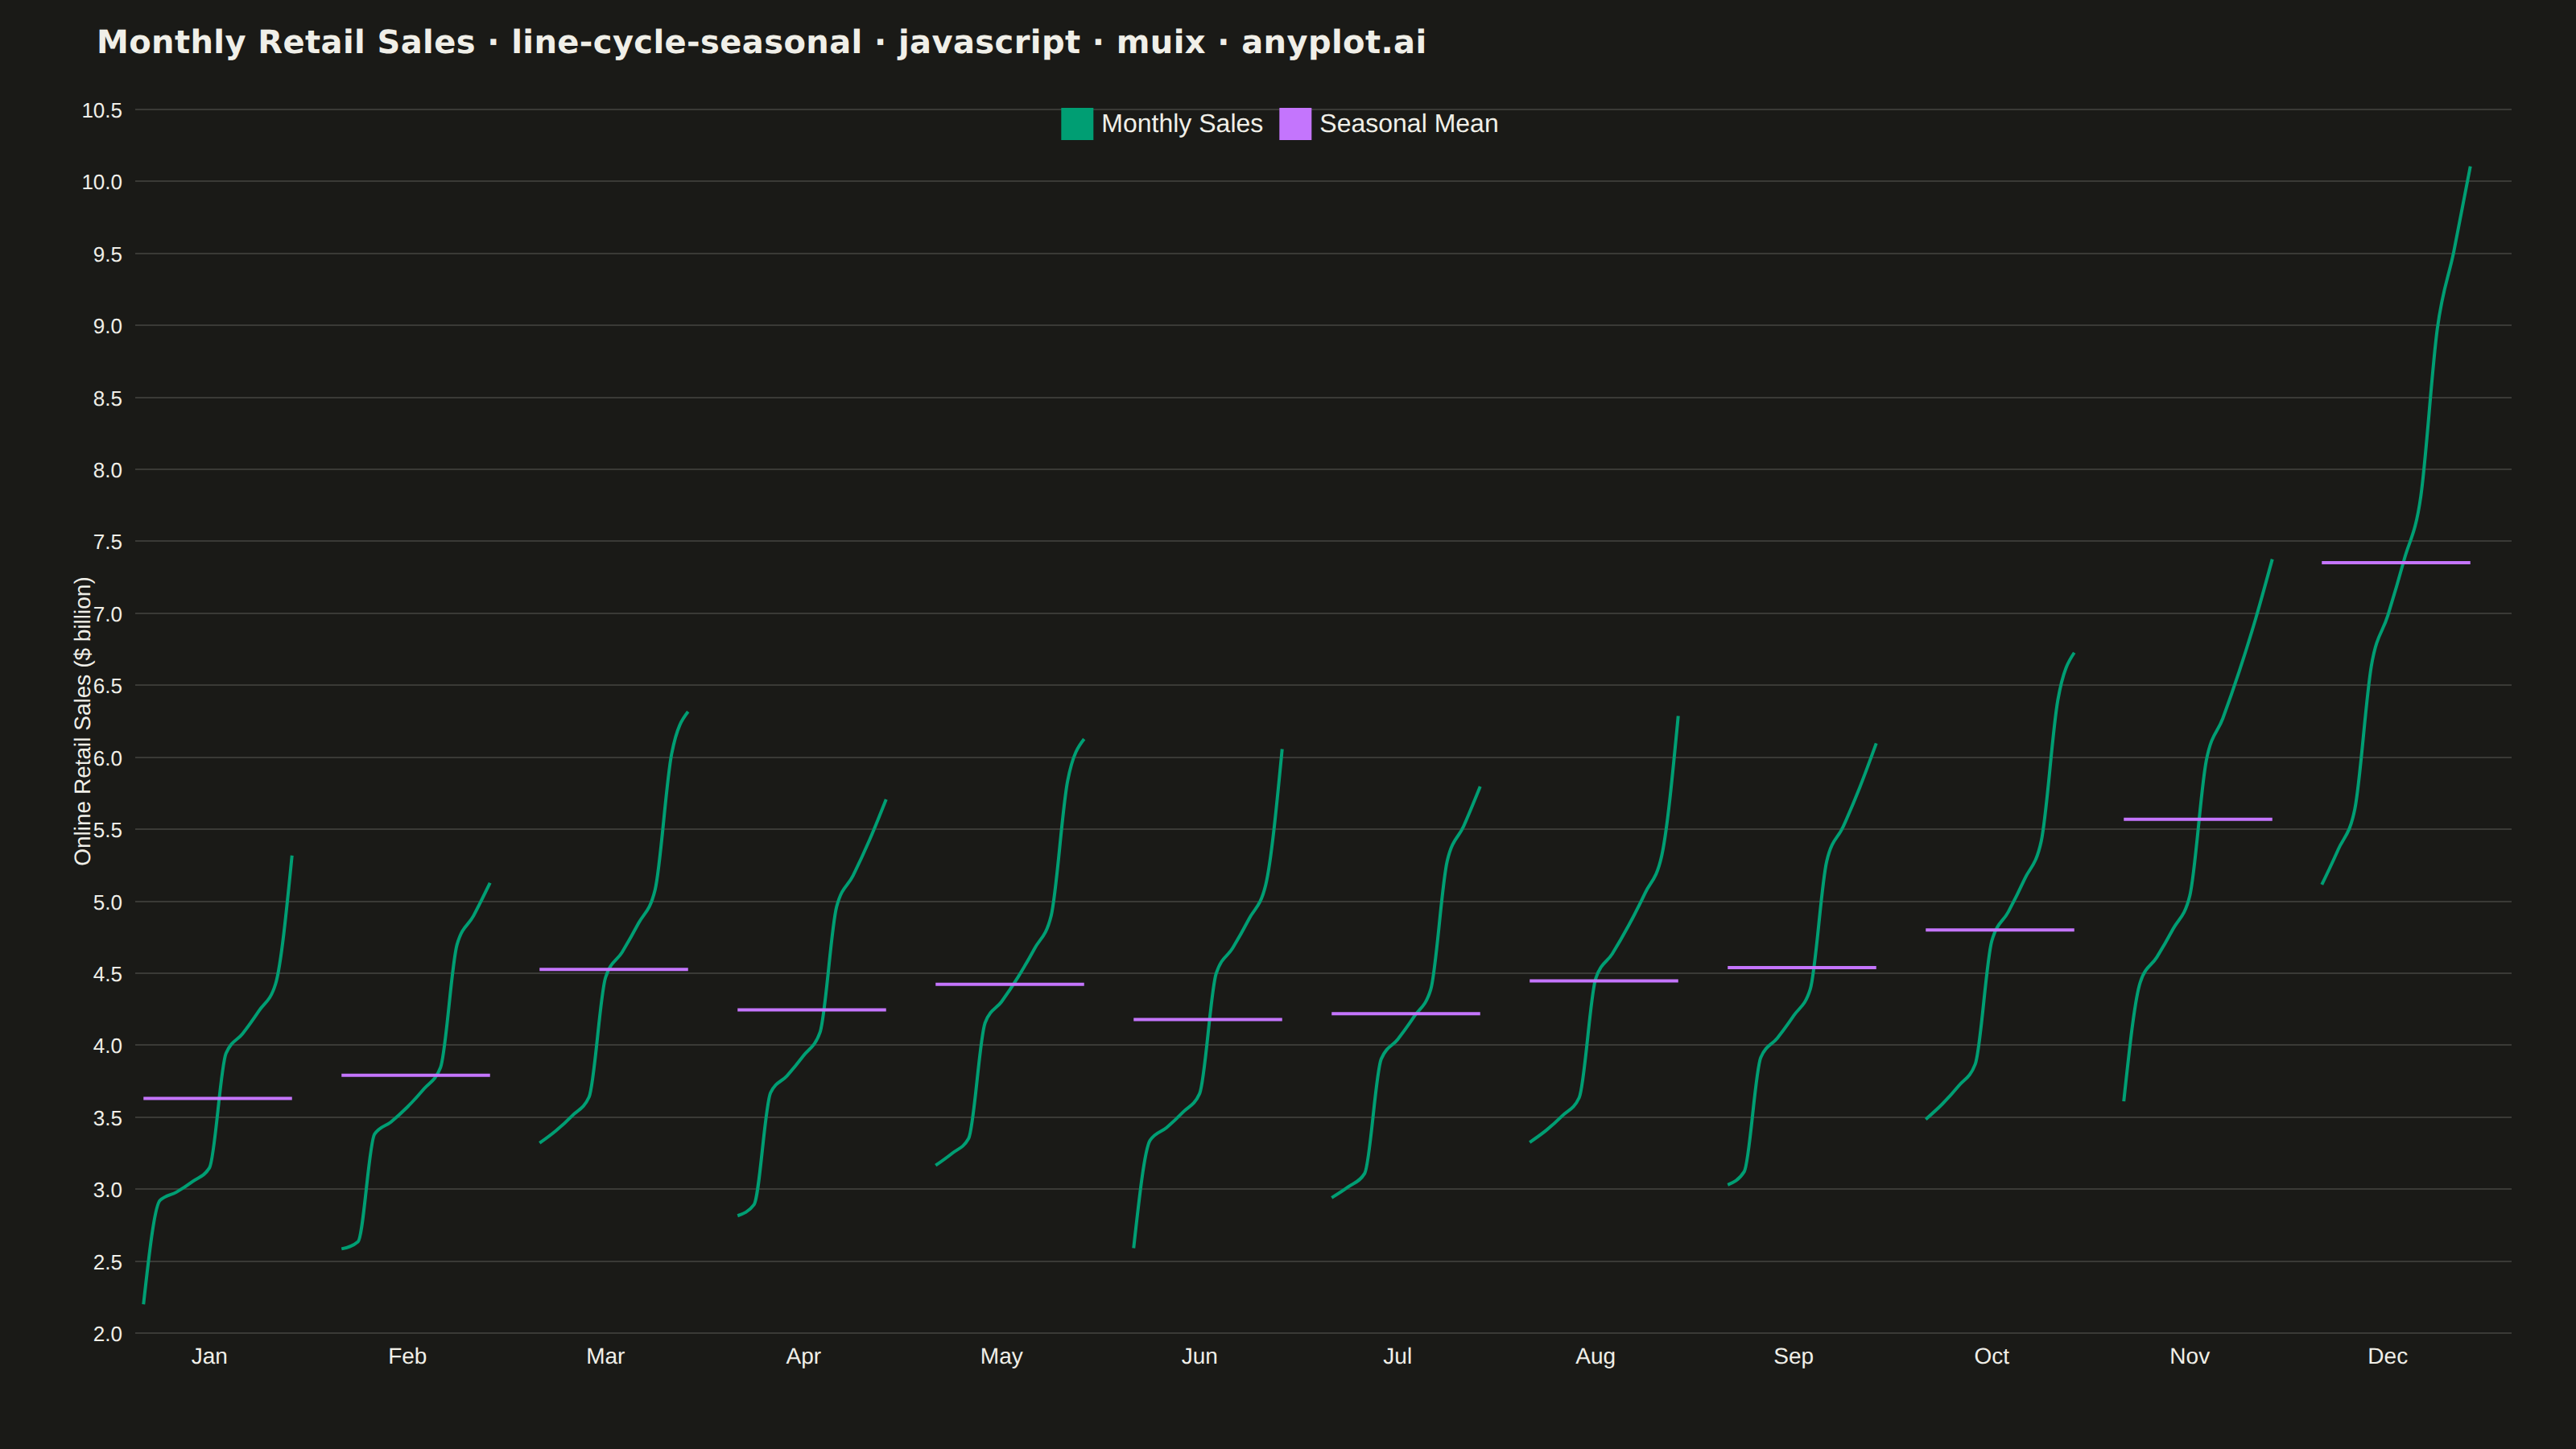
A cycle plot, also known as a seasonal subseries plot (introduced by William Cleveland), separates the seasonal pattern of a time series from the trend within each season. The series is split by seasonal period (e.g. one group per month or weekday); within each group the values are drawn in chronological order as a small line, and a horizontal reference line marks that group's mean. Comparing the mean lines across groups reveals the seasonal effect, while the slope of each subseries reveals the trend within that season — two patterns that are entangled in a standard time series plot.
// anyplot.ai
// line-cycle-seasonal: Cycle Plot (Seasonal Subseries)
// Library: muix 7.29.1 | JavaScript 22.22.3
// Quality: 87/100 | Created: 2026-06-15

import { LineChart } from "@mui/x-charts/LineChart";

const t = window.ANYPLOT_TOKENS;

// --- Data: monthly online retail sales ($ billion), 2014–2023 ---
// Cycle plot: 12 month groups, each with 10 chronological year observations.
// Null-position gaps between groups create visual separation.

const MONTHS = ["Jan","Feb","Mar","Apr","May","Jun","Jul","Aug","Sep","Oct","Nov","Dec"];
const N_YEARS = 10;  // 2014–2023
const GAP = 2;       // null-gap bands between month groups

// Seasonal multipliers (low in winter, peak in holiday season)
const SEASONAL = [0.72, 0.75, 0.88, 0.85, 0.87, 0.82, 0.84, 0.87, 0.90, 0.95, 1.10, 1.45];

// Center index within each group — tick label placed at year 2018 (index 4)
const CENTER_IDX = 4;

const xCategories: string[] = [];
const tickPositions: string[] = [];
const salesValues: (number | null)[] = [];
const meanValues: (number | null)[] = [];

MONTHS.forEach((month, m) => {
  const yearVals: number[] = [];

  for (let yi = 0; yi < N_YEARS; yi++) {
    const trend = 3.5 * Math.pow(1.08, yi);  // ~8% annual growth baseline
    const noise = (((m * 7 + yi * 13) % 17) - 8) * 0.04;  // deterministic ±0.32 B
    const val = trend * SEASONAL[m] + noise;
    yearVals.push(val);

    const cat = `${month}_${2014 + yi}`;
    xCategories.push(cat);
    salesValues.push(val);

    if (yi === CENTER_IDX) tickPositions.push(cat);
  }

  for (let g = 0; g < GAP; g++) {
    xCategories.push(`__gap_${m}_${g}`);
    salesValues.push(null);
  }

  const mean = yearVals.reduce((s, v) => s + v, 0) / N_YEARS;
  for (let yi = 0; yi < N_YEARS; yi++) {
    meanValues.push(mean);
  }
  for (let g = 0; g < GAP; g++) {
    meanValues.push(null);
  }
});

// Title is 75 chars — scale from 22px: round(22 × 67/75) ≈ 20px
const TITLE =
  "Monthly Retail Sales · line-cycle-seasonal · javascript · muix · anyplot.ai";

// --- Chart ---
export default function Chart() {
  const { width, height } = window.ANYPLOT_SIZE;
  const titleH = 52;

  return (
    <div
      style={{
        width,
        height,
        display: "flex",
        flexDirection: "column",
        fontFamily: "system-ui, -apple-system, sans-serif",
      }}
    >
      {/* Title — wrapper div, MUI X community has no built-in title slot */}
      <div
        style={{
          height: titleH,
          padding: "14px 60px 0",
          fontSize: 20,
          fontWeight: 600,
          color: t.ink,
          letterSpacing: "0.01em",
          flexShrink: 0,
        }}
      >
        {TITLE}
      </div>

      <LineChart
        width={width}
        height={height - titleH}
        skipAnimation
        colors={[t.palette[0], t.palette[1]]}
        grid={{ horizontal: true }}
        sx={{
          // Remove axis spine lines for a cleaner frameless look
          "& .MuiChartsAxis-line": { display: "none" },
          // Remove tick marks, keep labels
          "& .MuiChartsAxis-tick": { display: "none" },
          // Subtle horizontal grid using theme grid token
          "& .MuiChartsGrid-horizontalLine": {
            stroke: t.grid,
            strokeWidth: 1,
          },
        }}
        xAxis={[{
          scaleType: "band",
          data: xCategories,
          // Tick labels only at center of each month group (e.g. "Jan_2018")
          tickInterval: tickPositions,
          valueFormatter: (val: string) => val.split("_")[0],
          tickLabelStyle: { fontSize: 14 },
        }]}
        yAxis={[{
          label: "Online Retail Sales ($ billion)",
          labelStyle: { fontSize: 14 },
          tickLabelStyle: { fontSize: 13 },
          min: 2,
        }]}
        series={[
          {
            data: salesValues,
            label: "Monthly Sales",
            showMark: false,
            connectNulls: false,
          },
          {
            data: meanValues,
            label: "Seasonal Mean",
            showMark: false,
            connectNulls: false,
          },
        ]}
        margin={{ top: 16, right: 40, bottom: 72, left: 84 }}
      />
    </div>
  );
}
Runnable source as JSON, for any HTTP client: https://api.anyplot.ai/specs/line-cycle-seasonal/muix/code. Any spec id and library id listed in llms-full.txt fit the same URL shape; every URL below is complete and callable.
{
  "spec_id": "line-cycle-seasonal",
  "language": "javascript",
  "library": "muix",
  "page": "https://anyplot.ai/line-cycle-seasonal/javascript/muix",
  "hub": "https://anyplot.ai/line-cycle-seasonal",
  "code_json": "https://api.anyplot.ai/specs/line-cycle-seasonal/muix/code",
  "spec_json": "https://api.anyplot.ai/specs/line-cycle-seasonal",
  "render_light_png": "https://storage.googleapis.com/anyplot-images/plots/line-cycle-seasonal/javascript/muix/plot-light.png",
  "render_dark_png": "https://storage.googleapis.com/anyplot-images/plots/line-cycle-seasonal/javascript/muix/plot-dark.png",
  "interactive_light_html": "https://storage.googleapis.com/anyplot-images/plots/line-cycle-seasonal/javascript/muix/plot-light.html",
  "interactive_dark_html": "https://storage.googleapis.com/anyplot-images/plots/line-cycle-seasonal/javascript/muix/plot-dark.html",
  "quality_score": 87.0,
  "license": "MIT",
  "guide": "https://anyplot.ai/llms.txt"
}
Part of Cycle Plot (Seasonal Subseries) on anyplot.ai.