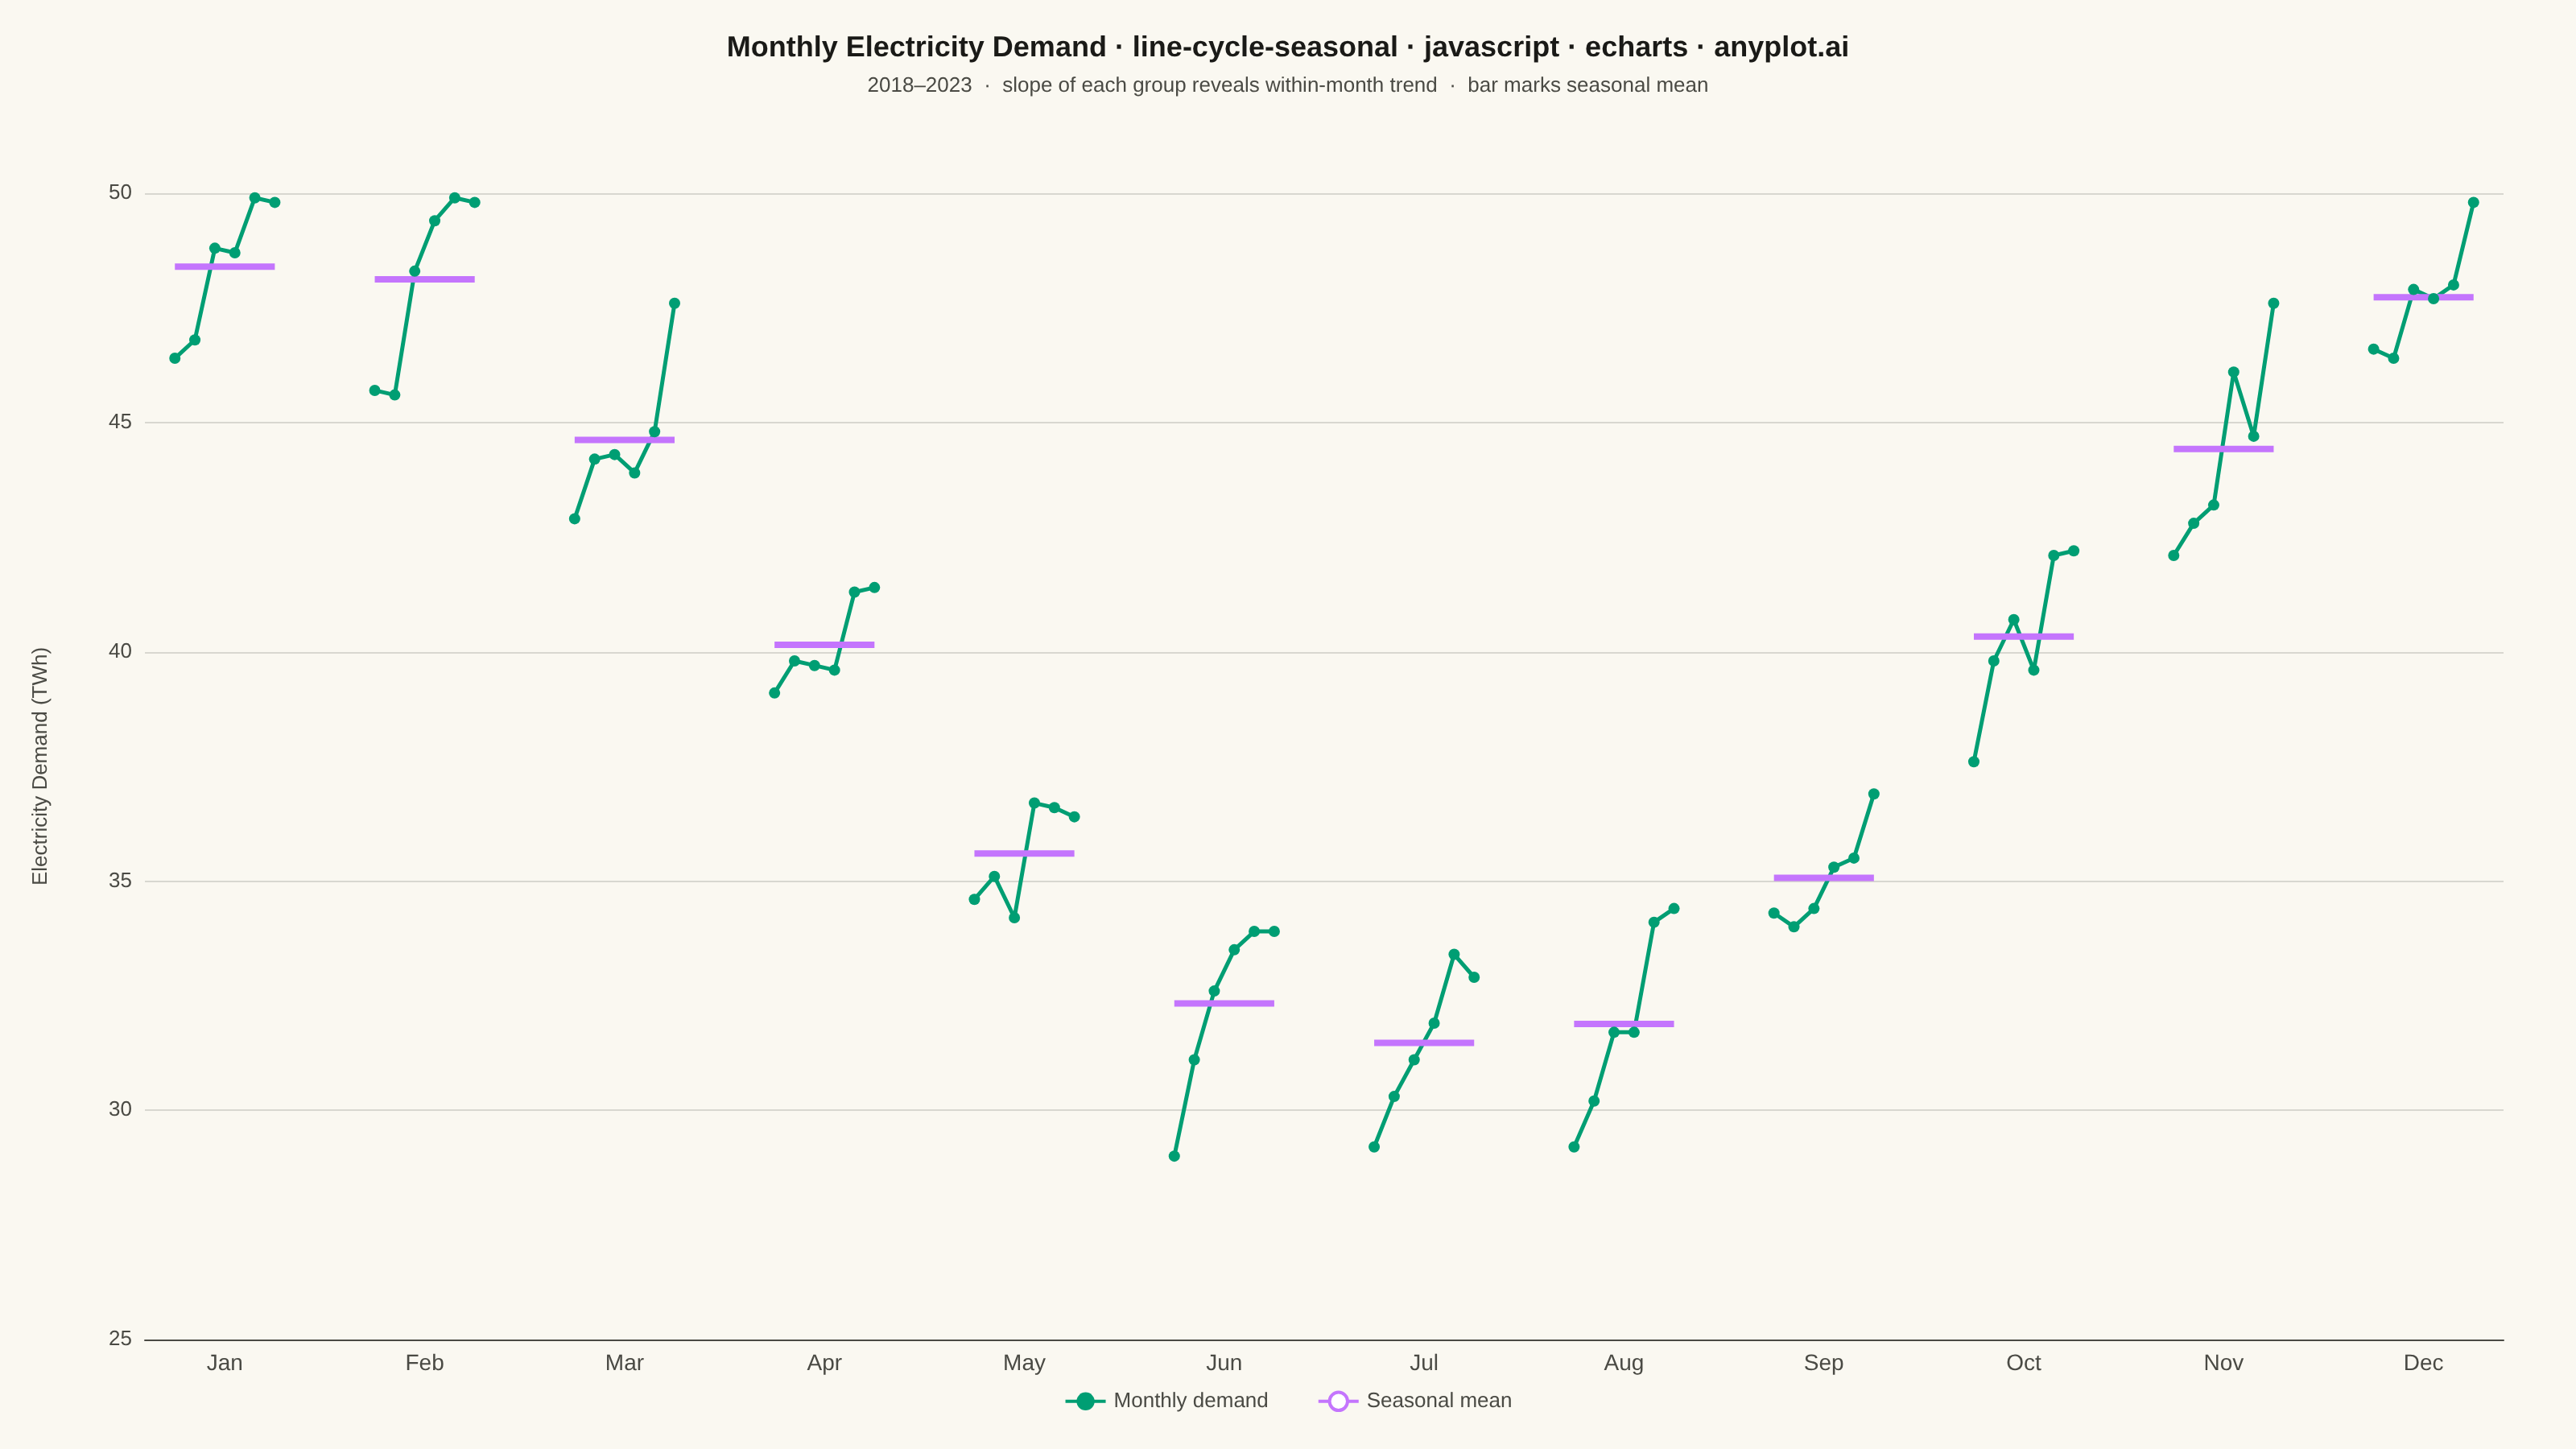
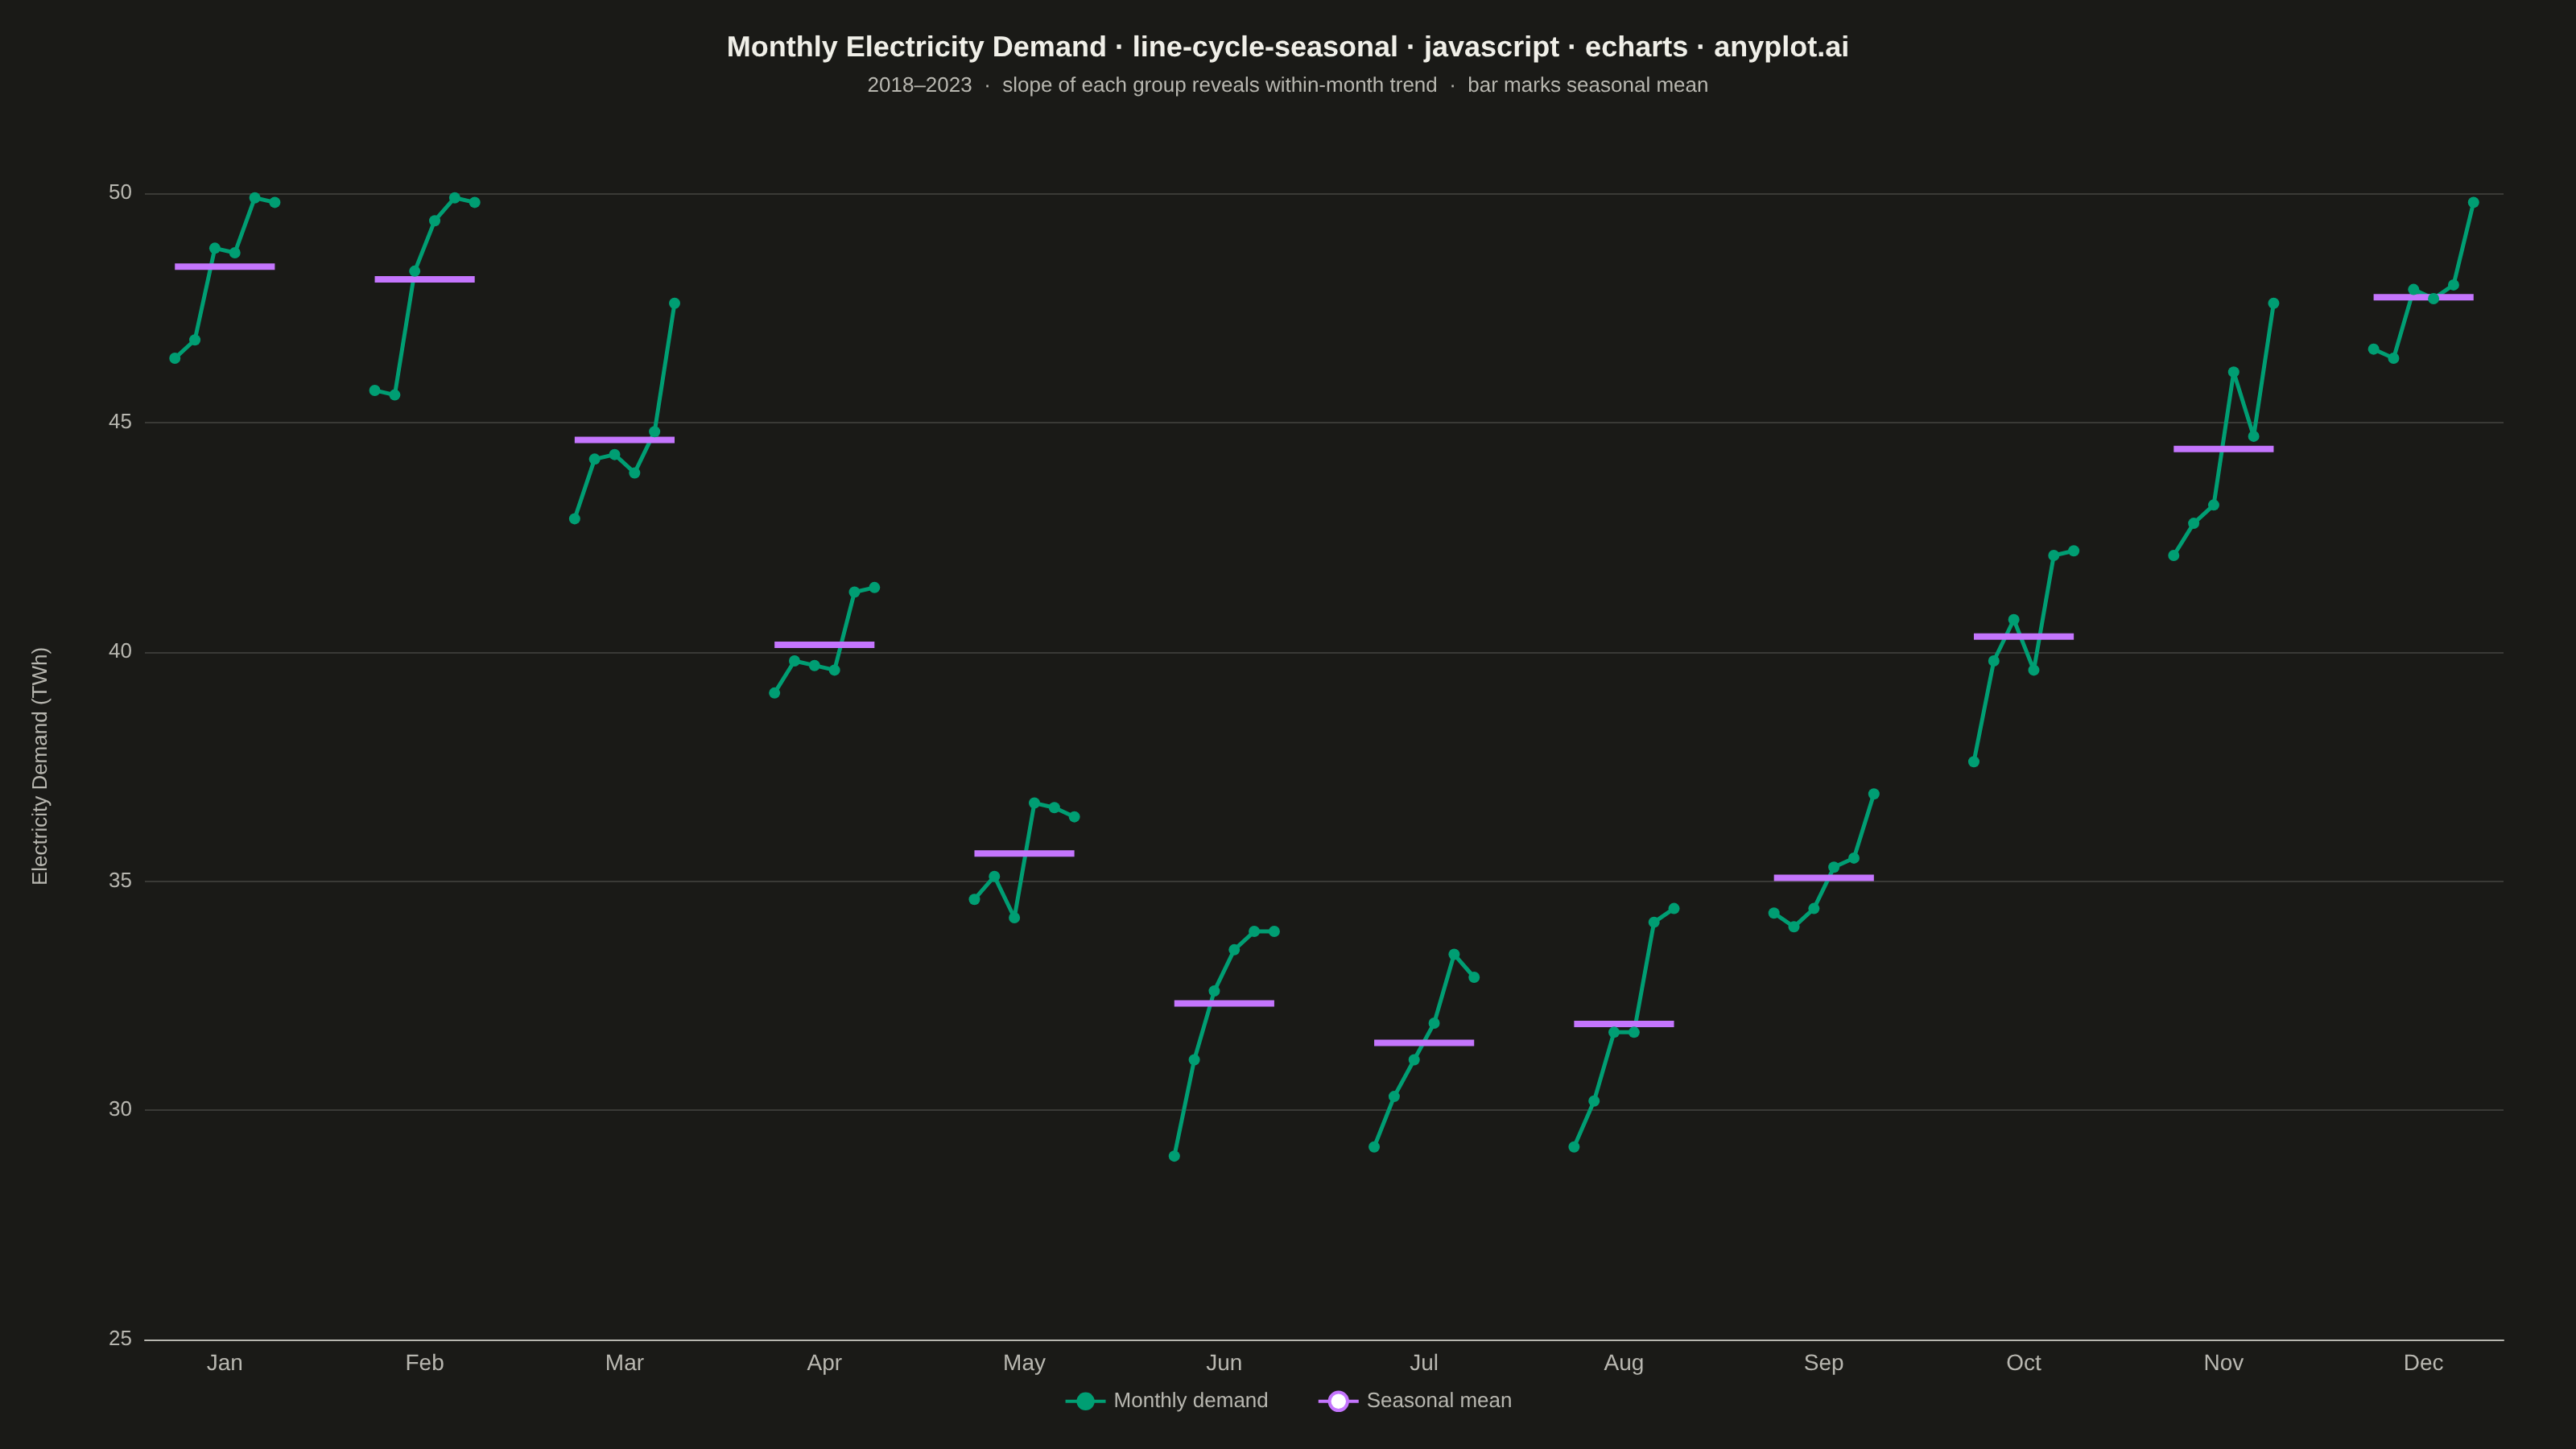
A cycle plot, also known as a seasonal subseries plot (introduced by William Cleveland), separates the seasonal pattern of a time series from the trend within each season. The series is split by seasonal period (e.g. one group per month or weekday); within each group the values are drawn in chronological order as a small line, and a horizontal reference line marks that group's mean. Comparing the mean lines across groups reveals the seasonal effect, while the slope of each subseries reveals the trend within that season — two patterns that are entangled in a standard time series plot.
// anyplot.ai
// line-cycle-seasonal: Cycle Plot (Seasonal Subseries)
// Library: echarts 5.5.1 | JavaScript 22.22.3
// Quality: 89/100 | Created: 2026-06-15

const t = window.ANYPLOT_TOKENS;

// Simple deterministic LCG for synthetic data (no seeded RNG in browser)
let seed = 42;
function lcg() {
  seed = (seed * 1664525 + 1013904223) & 0xffffffff;
  return (seed >>> 0) / 0xffffffff;
}

// Data: Monthly electricity demand (TWh) for a regional grid, 2018–2023
const MONTHS = ['Jan', 'Feb', 'Mar', 'Apr', 'May', 'Jun', 'Jul', 'Aug', 'Sep', 'Oct', 'Nov', 'Dec'];
const YEARS = [2018, 2019, 2020, 2021, 2022, 2023];
const NY = YEARS.length; // 6
const SPACING = 10; // x-units per month group (6 data points + 4 unit gap)

// Seasonal model: amplitude 9 TWh, peak in Jan (m=0), upward trend 0.8 TWh/yr
const monthlyData = MONTHS.map(function(_, m) {
  var base = 38 + 9 * Math.cos(2 * Math.PI * m / 12);
  return YEARS.map(function(_, y) {
    return +((base + 0.8 * y + (lcg() - 0.5) * 2.5)).toFixed(1);
  });
});

// Seasonal means (one per month, averaged over all years)
const means = monthlyData.map(function(data) {
  return +(data.reduce(function(sum, v) { return sum + v; }, 0) / NY).toFixed(2);
});

// Build series data with null separators between month groups
const trendData = [];
const meanData = [];

MONTHS.forEach(function(_, m) {
  var xStart = m * SPACING;
  var xEnd = m * SPACING + NY - 1;
  // Trend line: 6 chronological data points per month
  monthlyData[m].forEach(function(v, y) { trendData.push([xStart + y, v]); });
  trendData.push(null); // break line between groups
  // Mean line: horizontal segment spanning the group width
  meanData.push([xStart, means[m]], [xEnd, means[m]], null);
});

// Month label positions (center of each group)
const monthCenters = MONTHS.map(function(_, m) { return m * SPACING + (NY - 1) / 2; });

// Title with scaled font size (67-char baseline → scale down for longer titles)
const titleText = 'Monthly Electricity Demand · line-cycle-seasonal · javascript · echarts · anyplot.ai';
const titleFontSize = Math.max(14, Math.round(22 * 67 / titleText.length));

const chart = echarts.init(document.getElementById('container'));

chart.setOption({
  animation: false,
  backgroundColor: 'transparent',

  title: {
    text: titleText,
    subtext: '2018–2023  ·  slope of each group reveals within-month trend  ·  bar marks seasonal mean',
    left: 'center',
    top: 16,
    textStyle: { color: t.ink, fontSize: titleFontSize, fontWeight: 'bold' },
    subtextStyle: { color: t.inkSoft, fontSize: 13 },
    itemGap: 8,
  },

  legend: {
    data: ['Monthly demand', 'Seasonal mean'],
    bottom: 18,
    textStyle: { color: t.inkSoft, fontSize: 13 },
    itemGap: 30,
    selectedMode: false,
  },

  grid: { left: 90, right: 45, top: 120, bottom: 68 },

  xAxis: {
    type: 'value',
    min: -1.5,
    max: 11 * SPACING + NY + 0.5, // 116.5 — clear of last data point (x=115)
    axisLabel: {
      customValues: monthCenters,
      formatter: function(v) {
        // customValues ensures v is always a month center; derive index for safety
        var m = Math.round((v - (NY - 1) / 2) / SPACING);
        return (m >= 0 && m < 12) ? MONTHS[m] : '';
      },
      color: t.inkSoft,
      fontSize: 14,
    },
    axisTick: { show: false },
    axisLine: { lineStyle: { color: t.inkSoft } },
    splitLine: { show: false },
  },

  yAxis: {
    type: 'value',
    name: 'Electricity Demand (TWh)',
    nameLocation: 'middle',
    nameGap: 58,
    nameTextStyle: { color: t.inkSoft, fontSize: 13 },
    axisLabel: { color: t.inkSoft, fontSize: 13 },
    axisLine: { show: false },
    axisTick: { show: false },
    splitLine: { lineStyle: { color: t.grid } },
    scale: true,
  },

  series: [
    {
      name: 'Monthly demand',
      type: 'line',
      data: trendData,
      connectNulls: false,
      lineStyle: { color: t.palette[0], width: 2.5 },
      itemStyle: { color: t.palette[0] },
      showSymbol: true,
      symbolSize: 7,
      symbol: 'circle',
      emphasis: { disabled: true },
    },
    {
      name: 'Seasonal mean',
      type: 'line',
      data: meanData,
      connectNulls: false,
      lineStyle: { color: t.palette[1], width: 4 },
      itemStyle: { color: t.palette[1] },
      showSymbol: false,
      emphasis: { disabled: true },
    },
  ],
});
Runnable source as JSON, for any HTTP client: https://api.anyplot.ai/specs/line-cycle-seasonal/echarts/code. Any spec id and library id listed in llms-full.txt fit the same URL shape; every URL below is complete and callable.
{
  "spec_id": "line-cycle-seasonal",
  "language": "javascript",
  "library": "echarts",
  "page": "https://anyplot.ai/line-cycle-seasonal/javascript/echarts",
  "hub": "https://anyplot.ai/line-cycle-seasonal",
  "code_json": "https://api.anyplot.ai/specs/line-cycle-seasonal/echarts/code",
  "spec_json": "https://api.anyplot.ai/specs/line-cycle-seasonal",
  "render_light_png": "https://storage.googleapis.com/anyplot-images/plots/line-cycle-seasonal/javascript/echarts/plot-light.png",
  "render_dark_png": "https://storage.googleapis.com/anyplot-images/plots/line-cycle-seasonal/javascript/echarts/plot-dark.png",
  "interactive_light_html": "https://storage.googleapis.com/anyplot-images/plots/line-cycle-seasonal/javascript/echarts/plot-light.html",
  "interactive_dark_html": "https://storage.googleapis.com/anyplot-images/plots/line-cycle-seasonal/javascript/echarts/plot-dark.html",
  "quality_score": 89.0,
  "license": "MIT",
  "guide": "https://anyplot.ai/llms.txt"
}
Part of Cycle Plot (Seasonal Subseries) on anyplot.ai.