Source code in 15 libraries — Python: Altair, Bokeh, lets-plot, Matplotlib, Plotly, plotnine, Pygal, Seaborn; R: ggplot2; Julia: Makie.jl; JavaScript: Chart.js, D3.js, Apache ECharts, Highcharts, MUI X Charts.
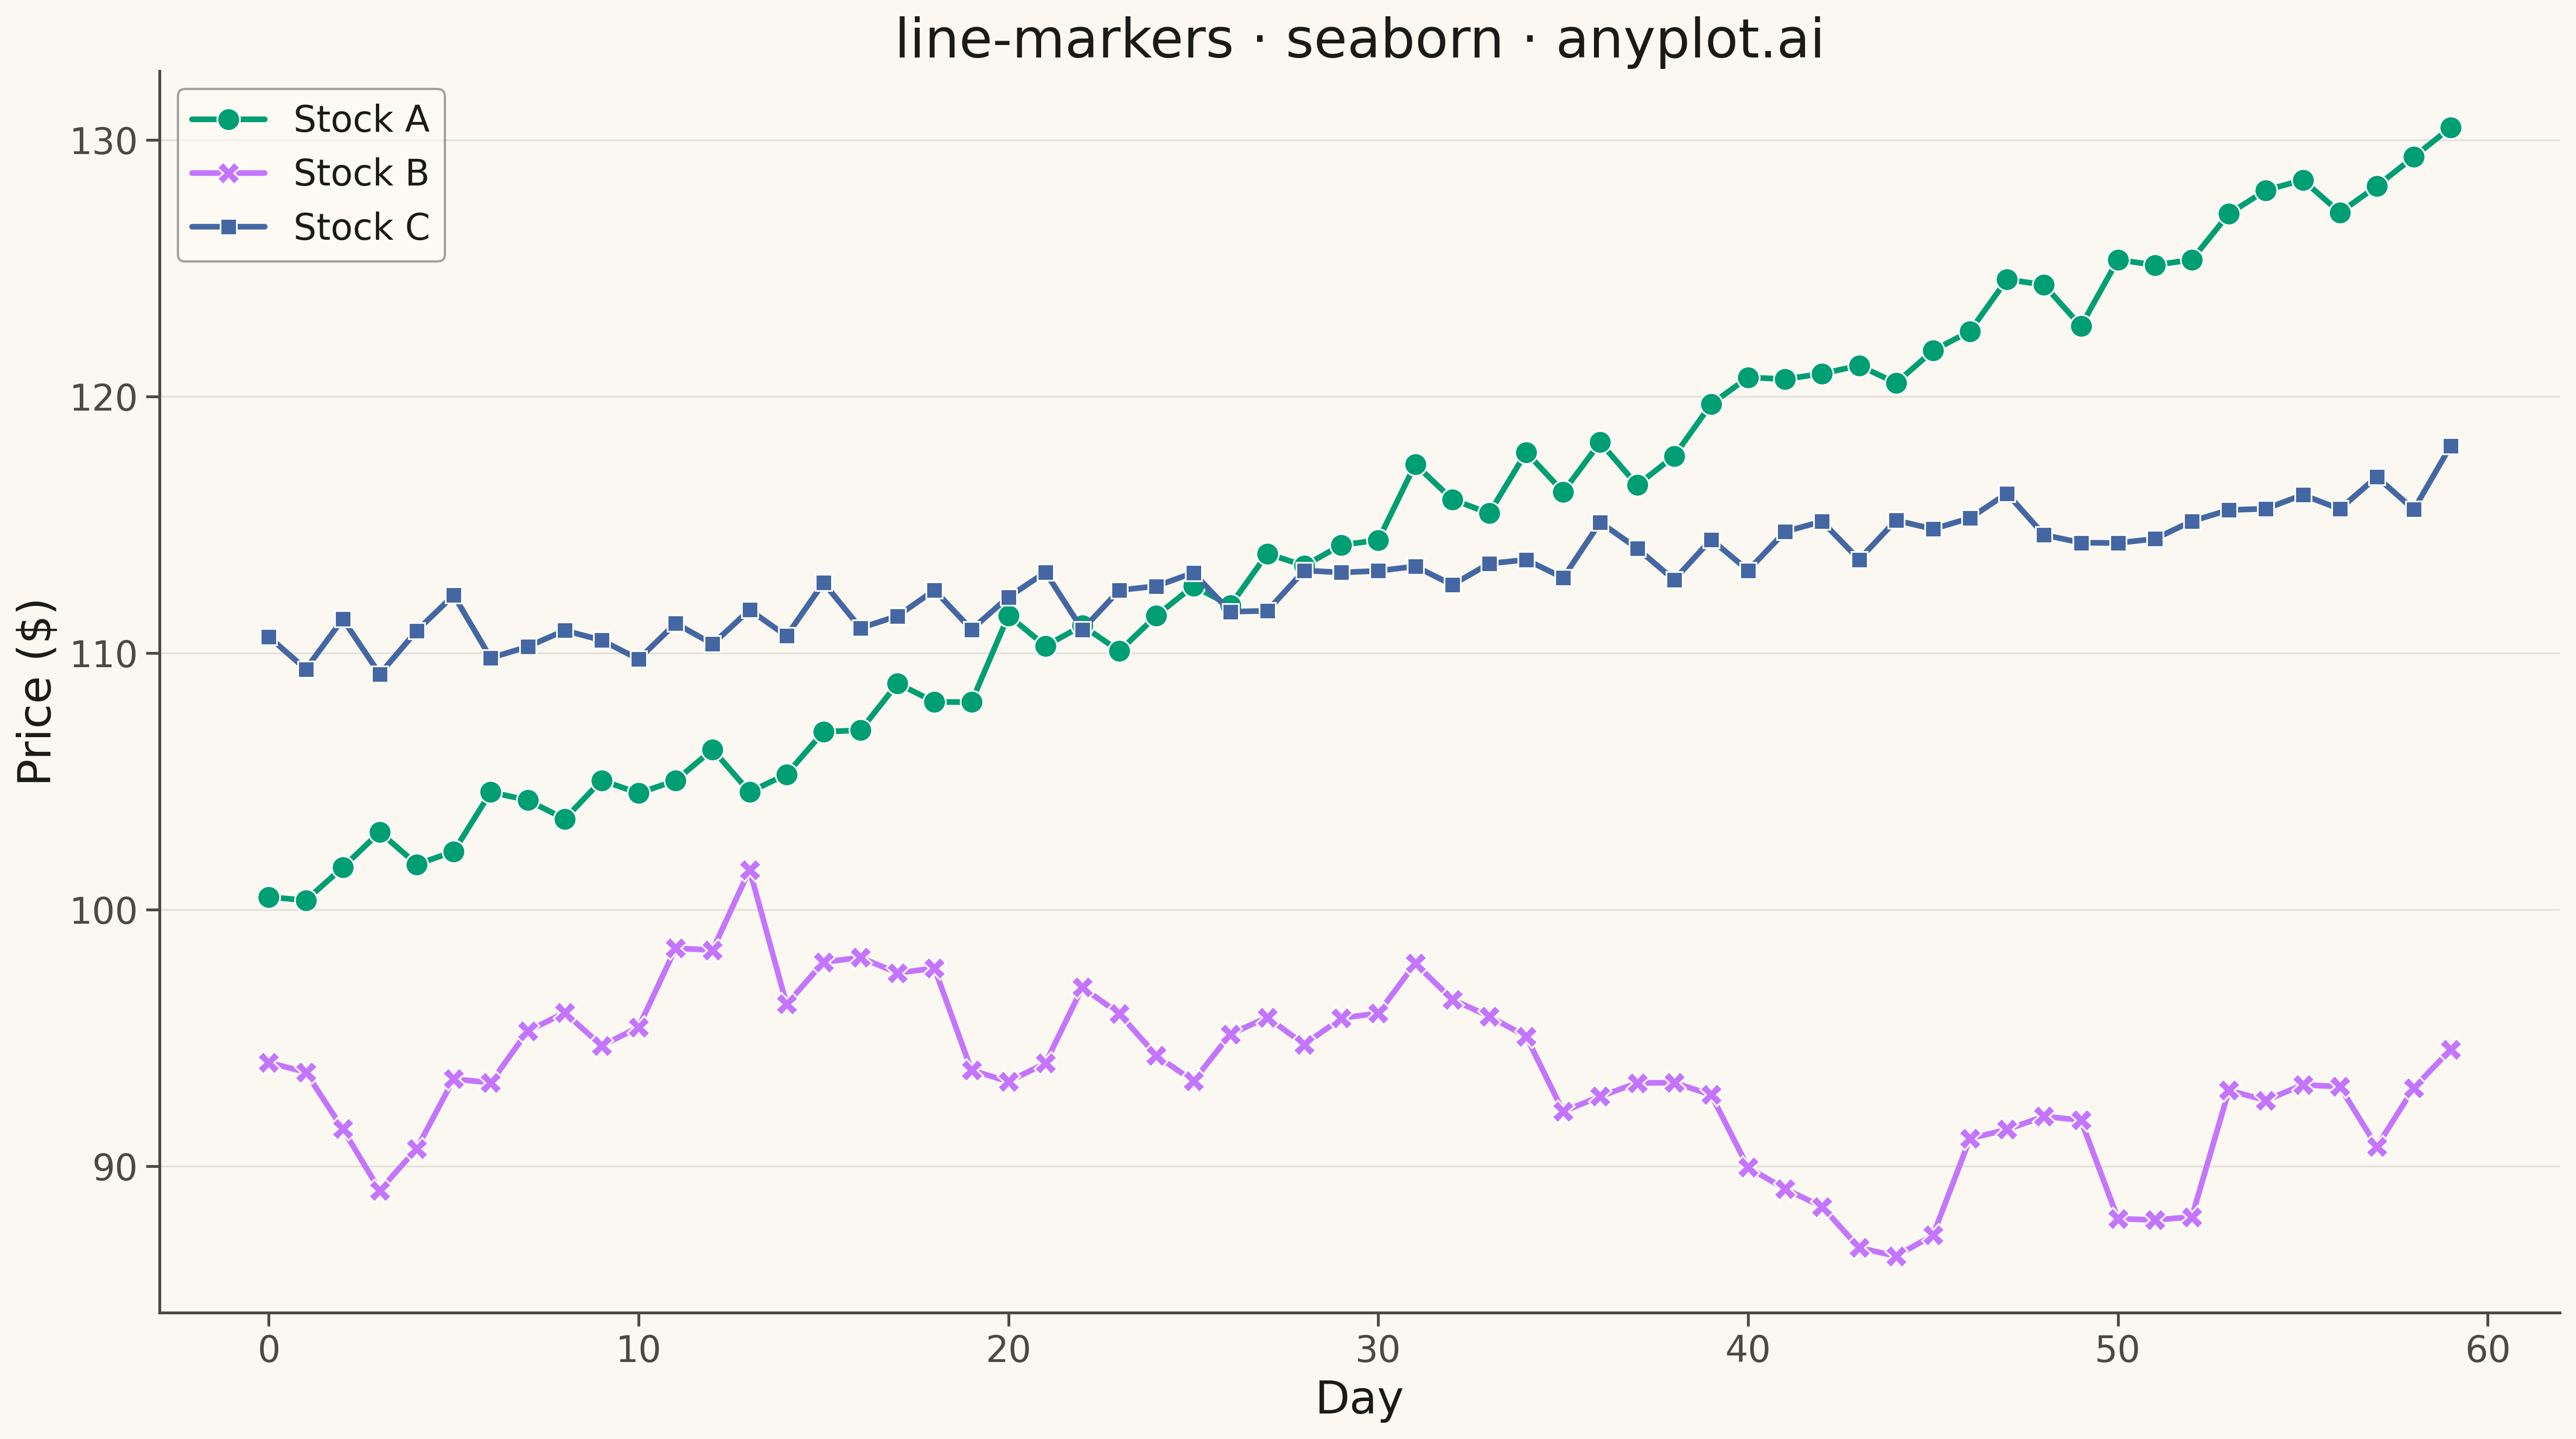
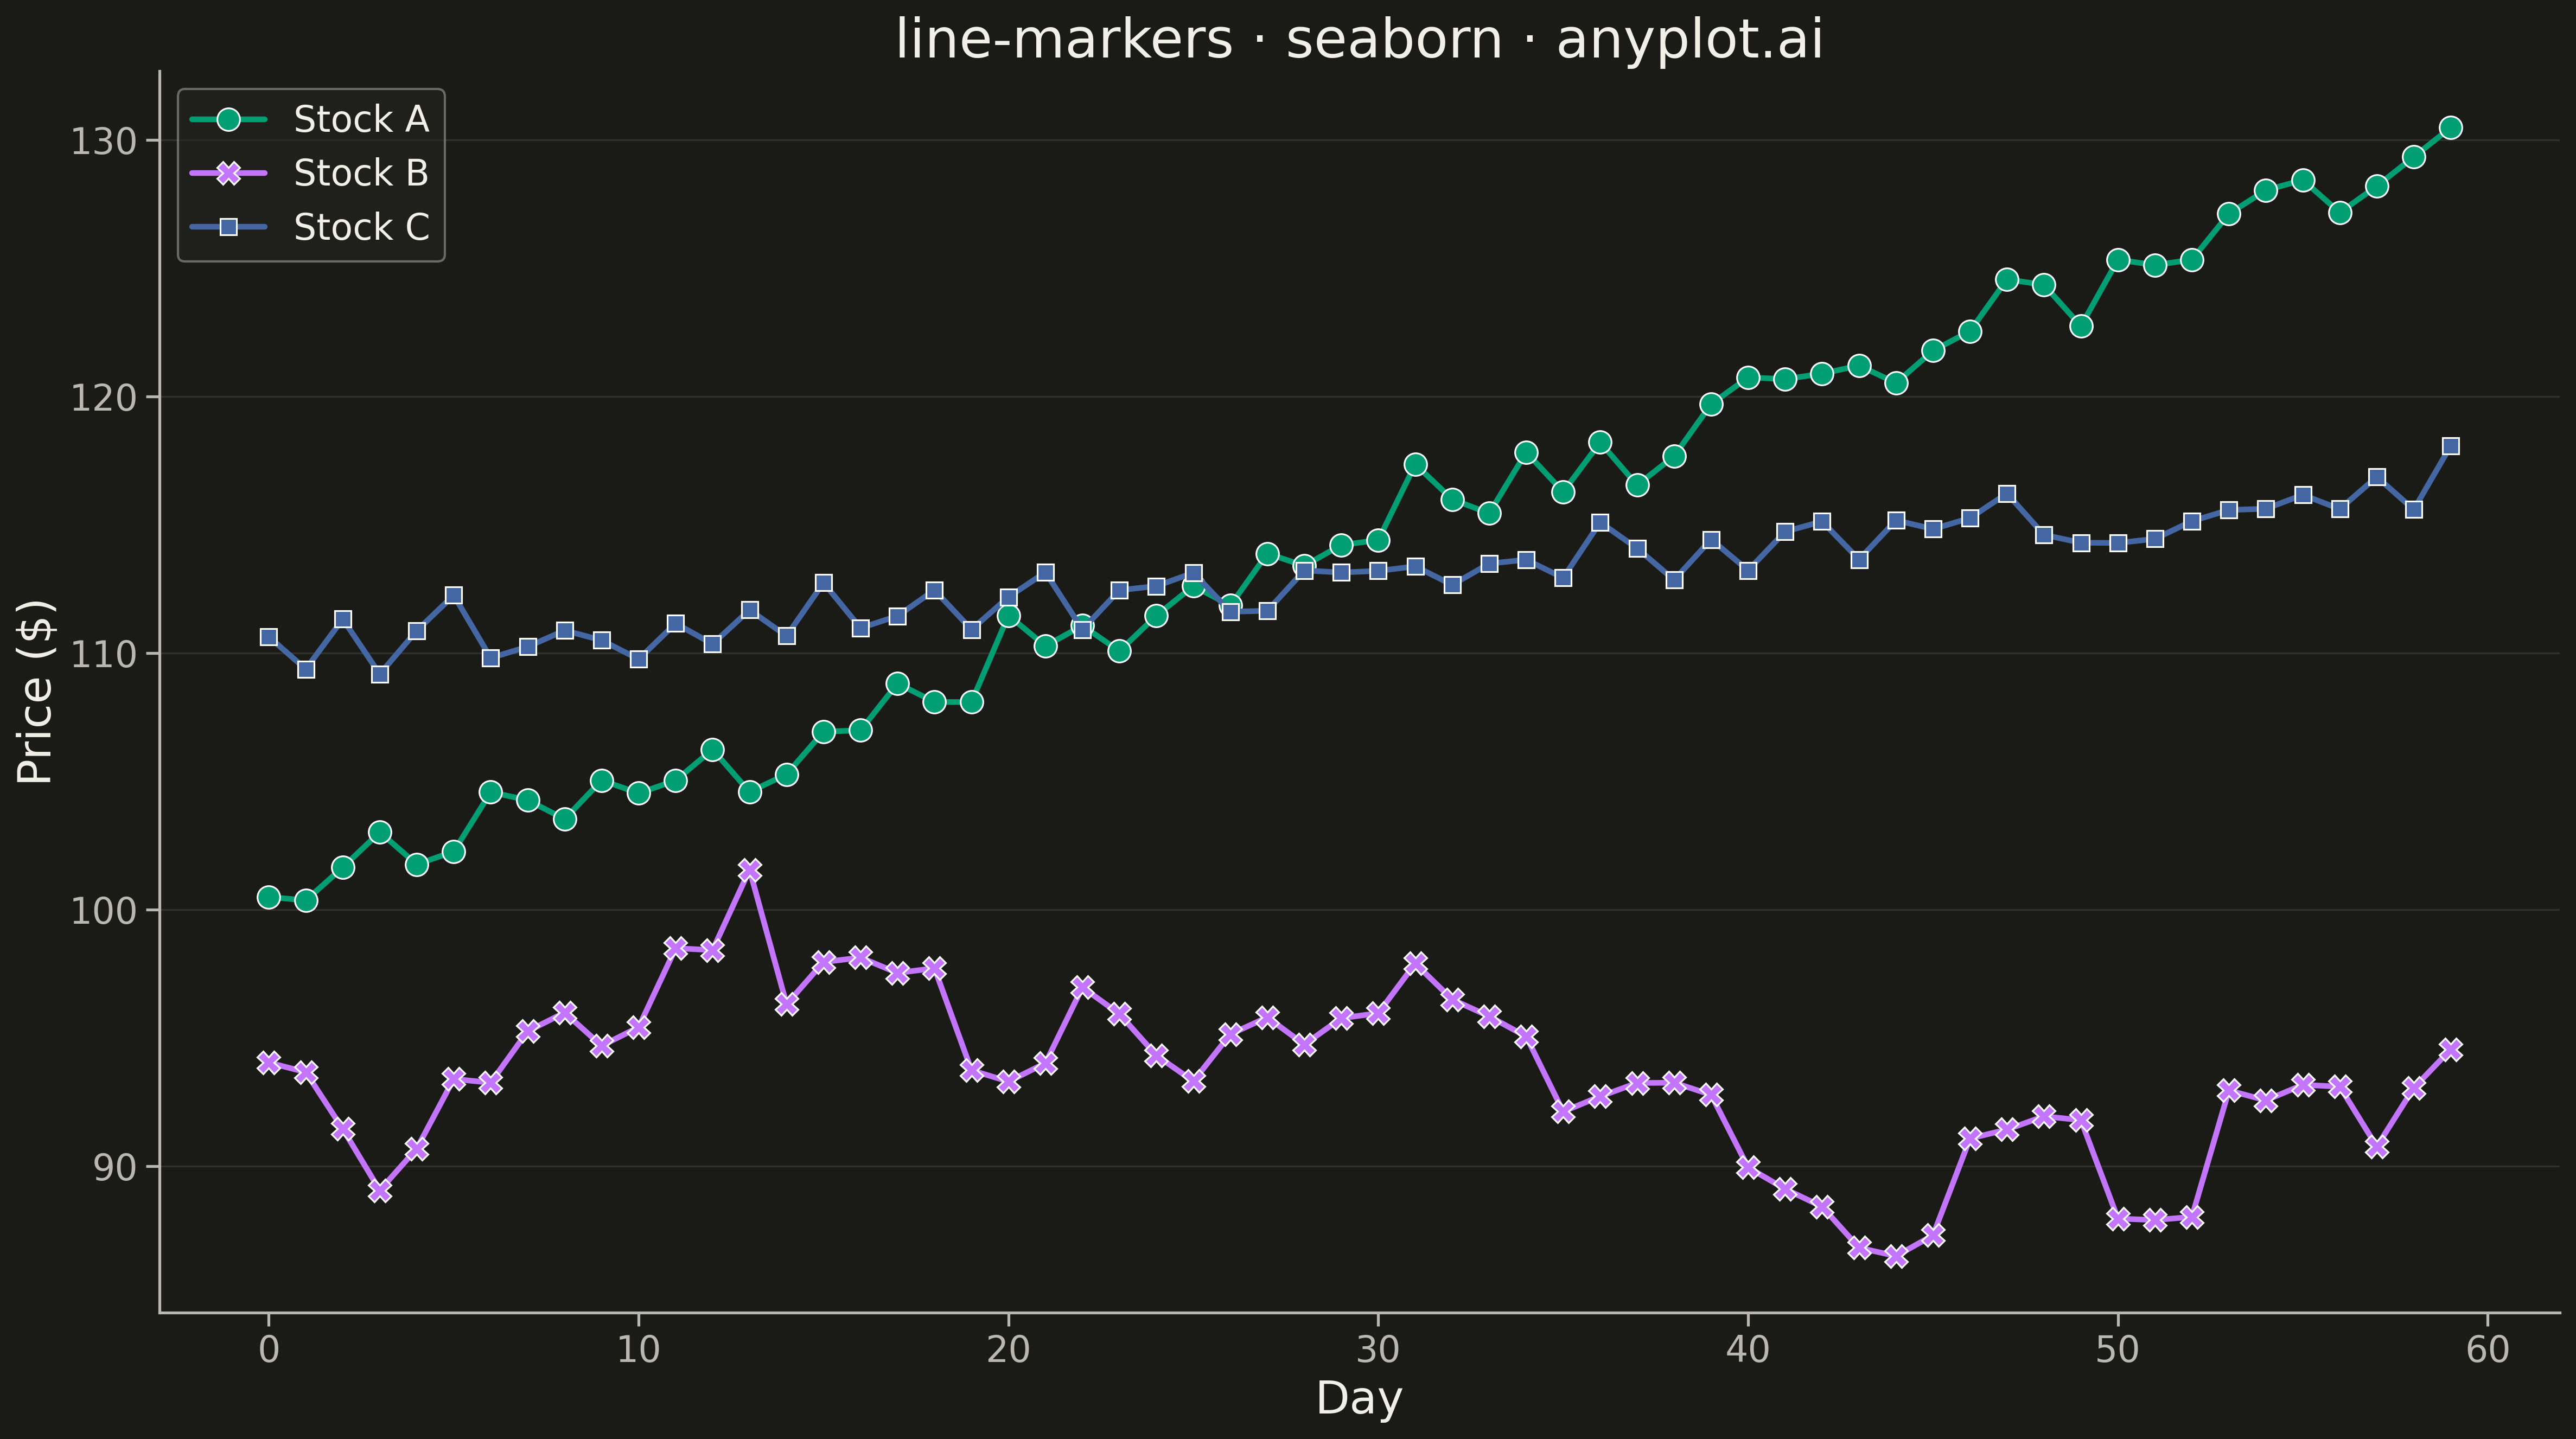
A line plot with visible markers at each data point, combining line and scatter plot features. This is particularly useful for sparse data where individual observations are significant.
Preview render from the Seaborn implementation.