The same plot in 14 other libraries — JavaScript: D3.js, Apache ECharts, Highcharts, MUI X Charts; Python: Altair, Bokeh, lets-plot, Matplotlib, Plotly, plotnine, Pygal, Seaborn; R: ggplot2; Julia: Makie.jl. Compare all 15 side by side: Line Plot with Markers in Python, R, Julia and JavaScript.
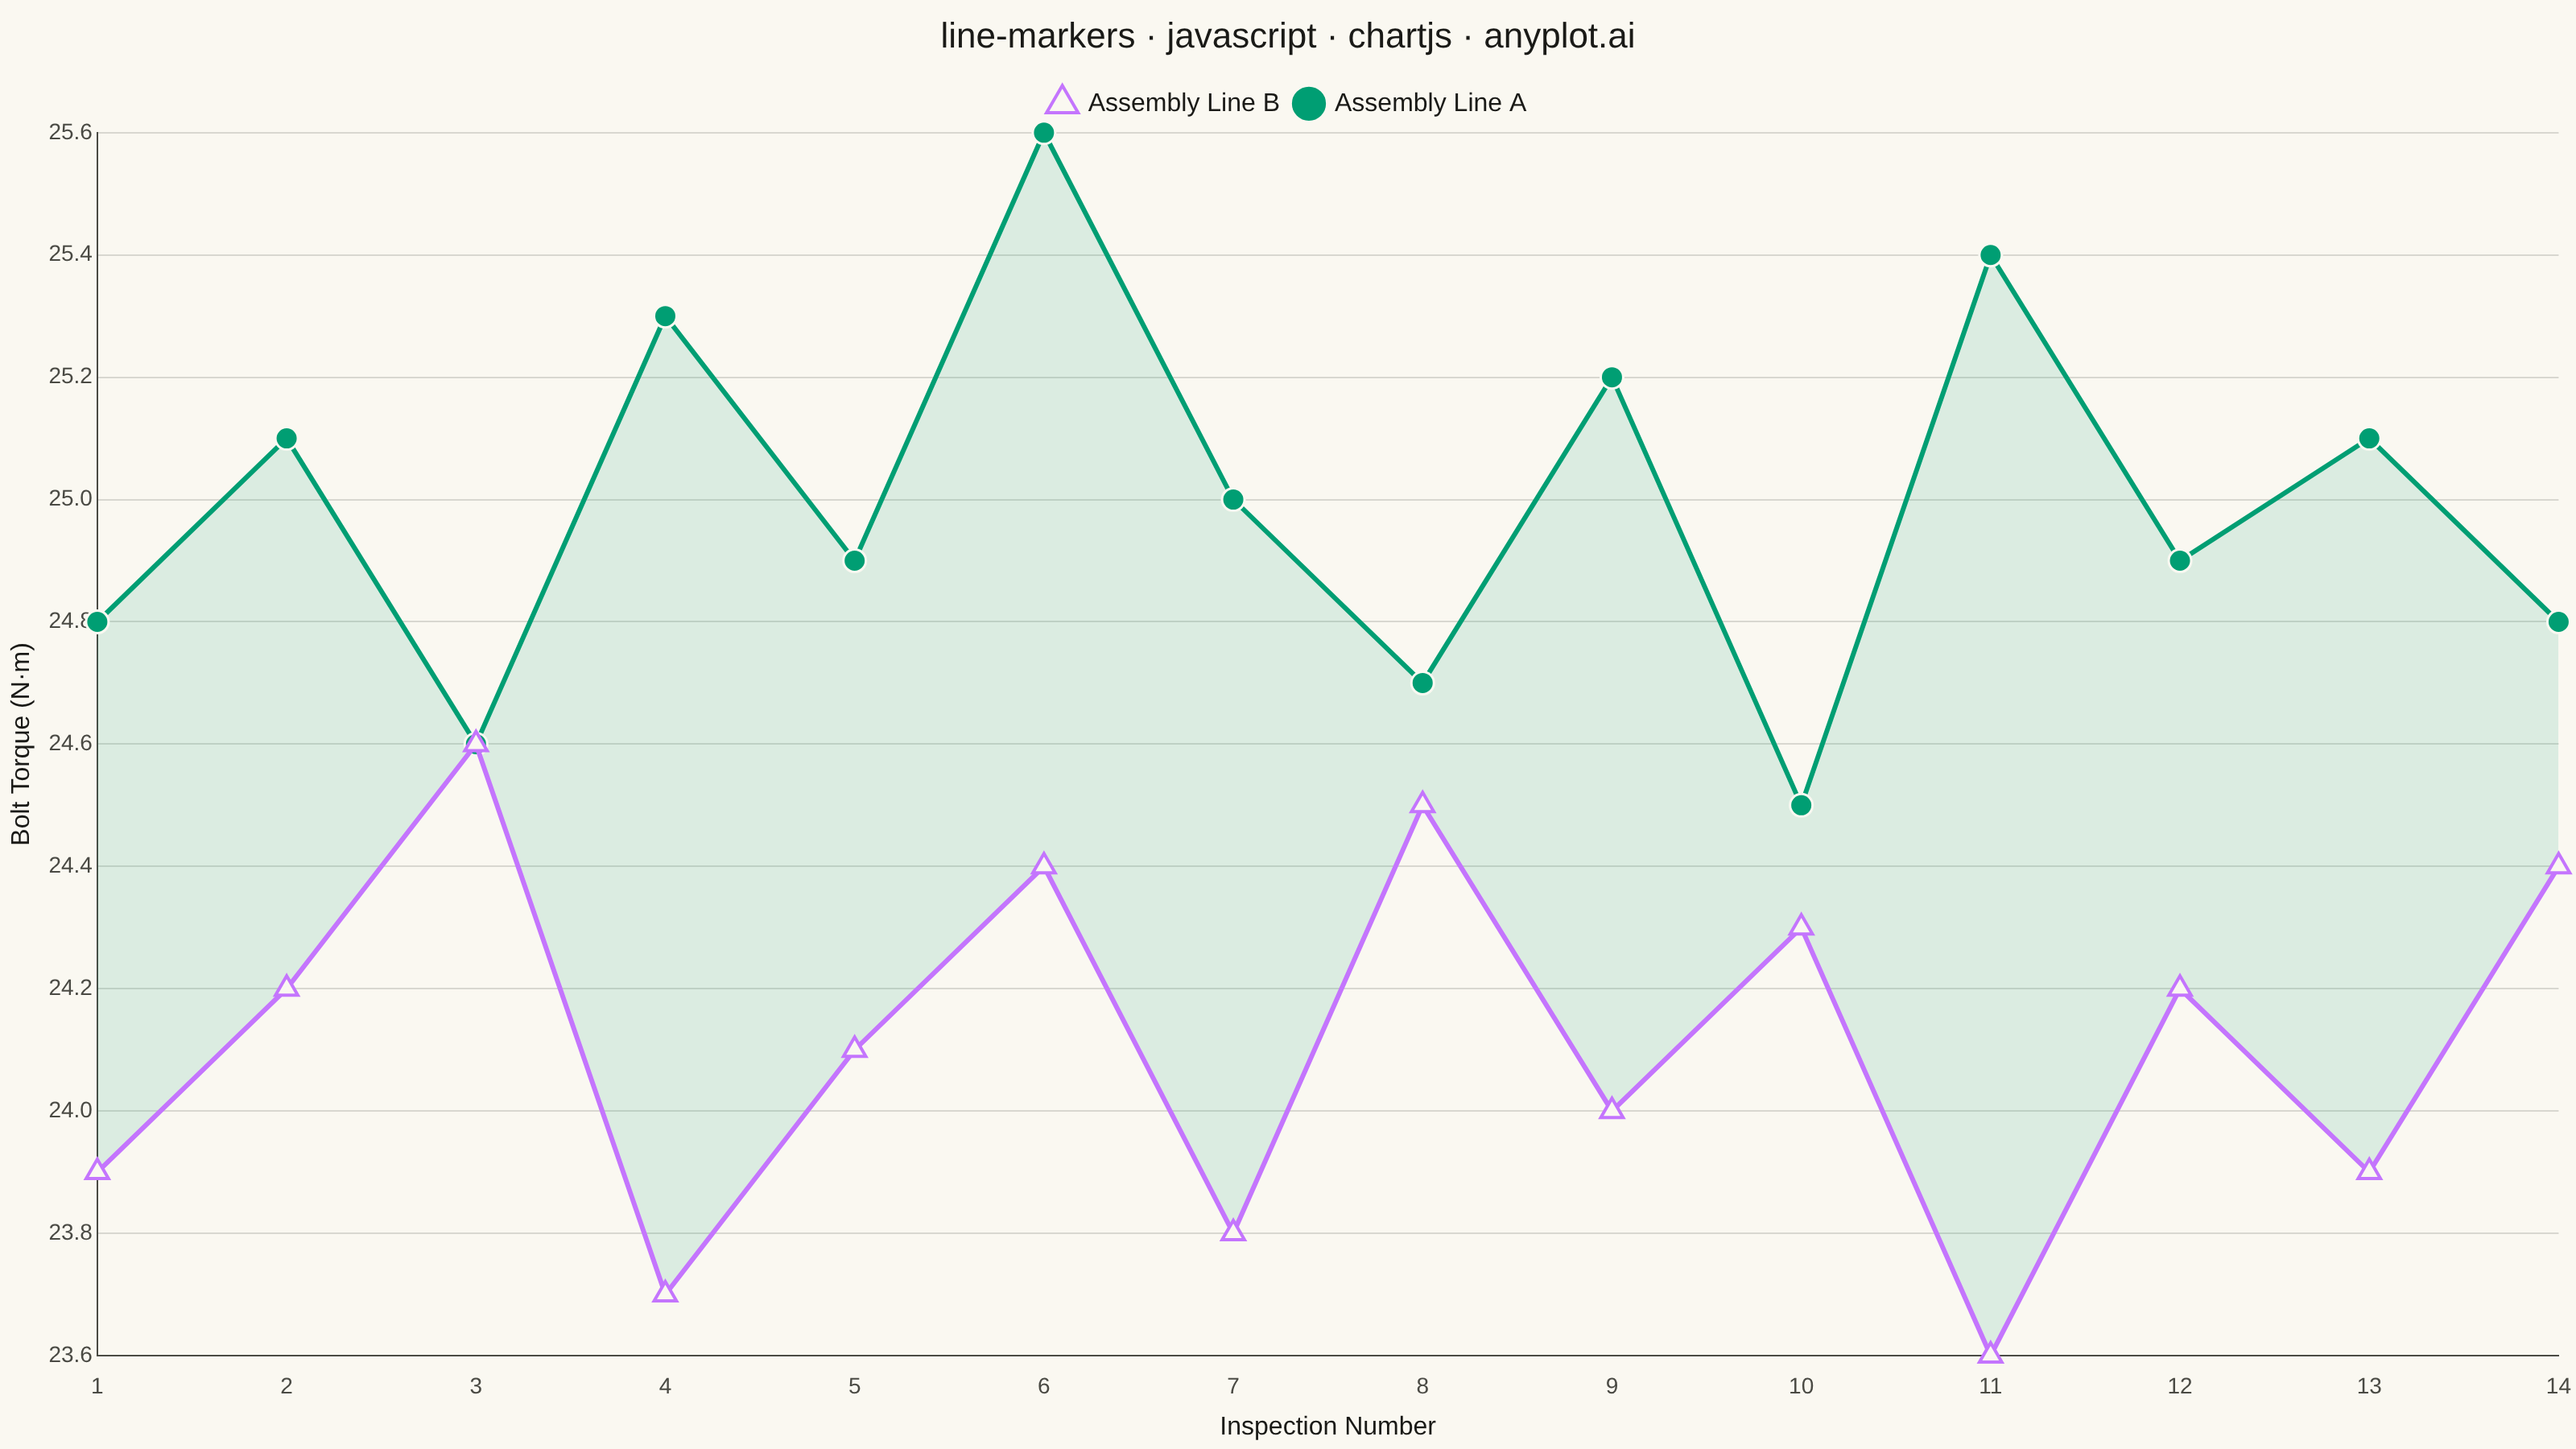
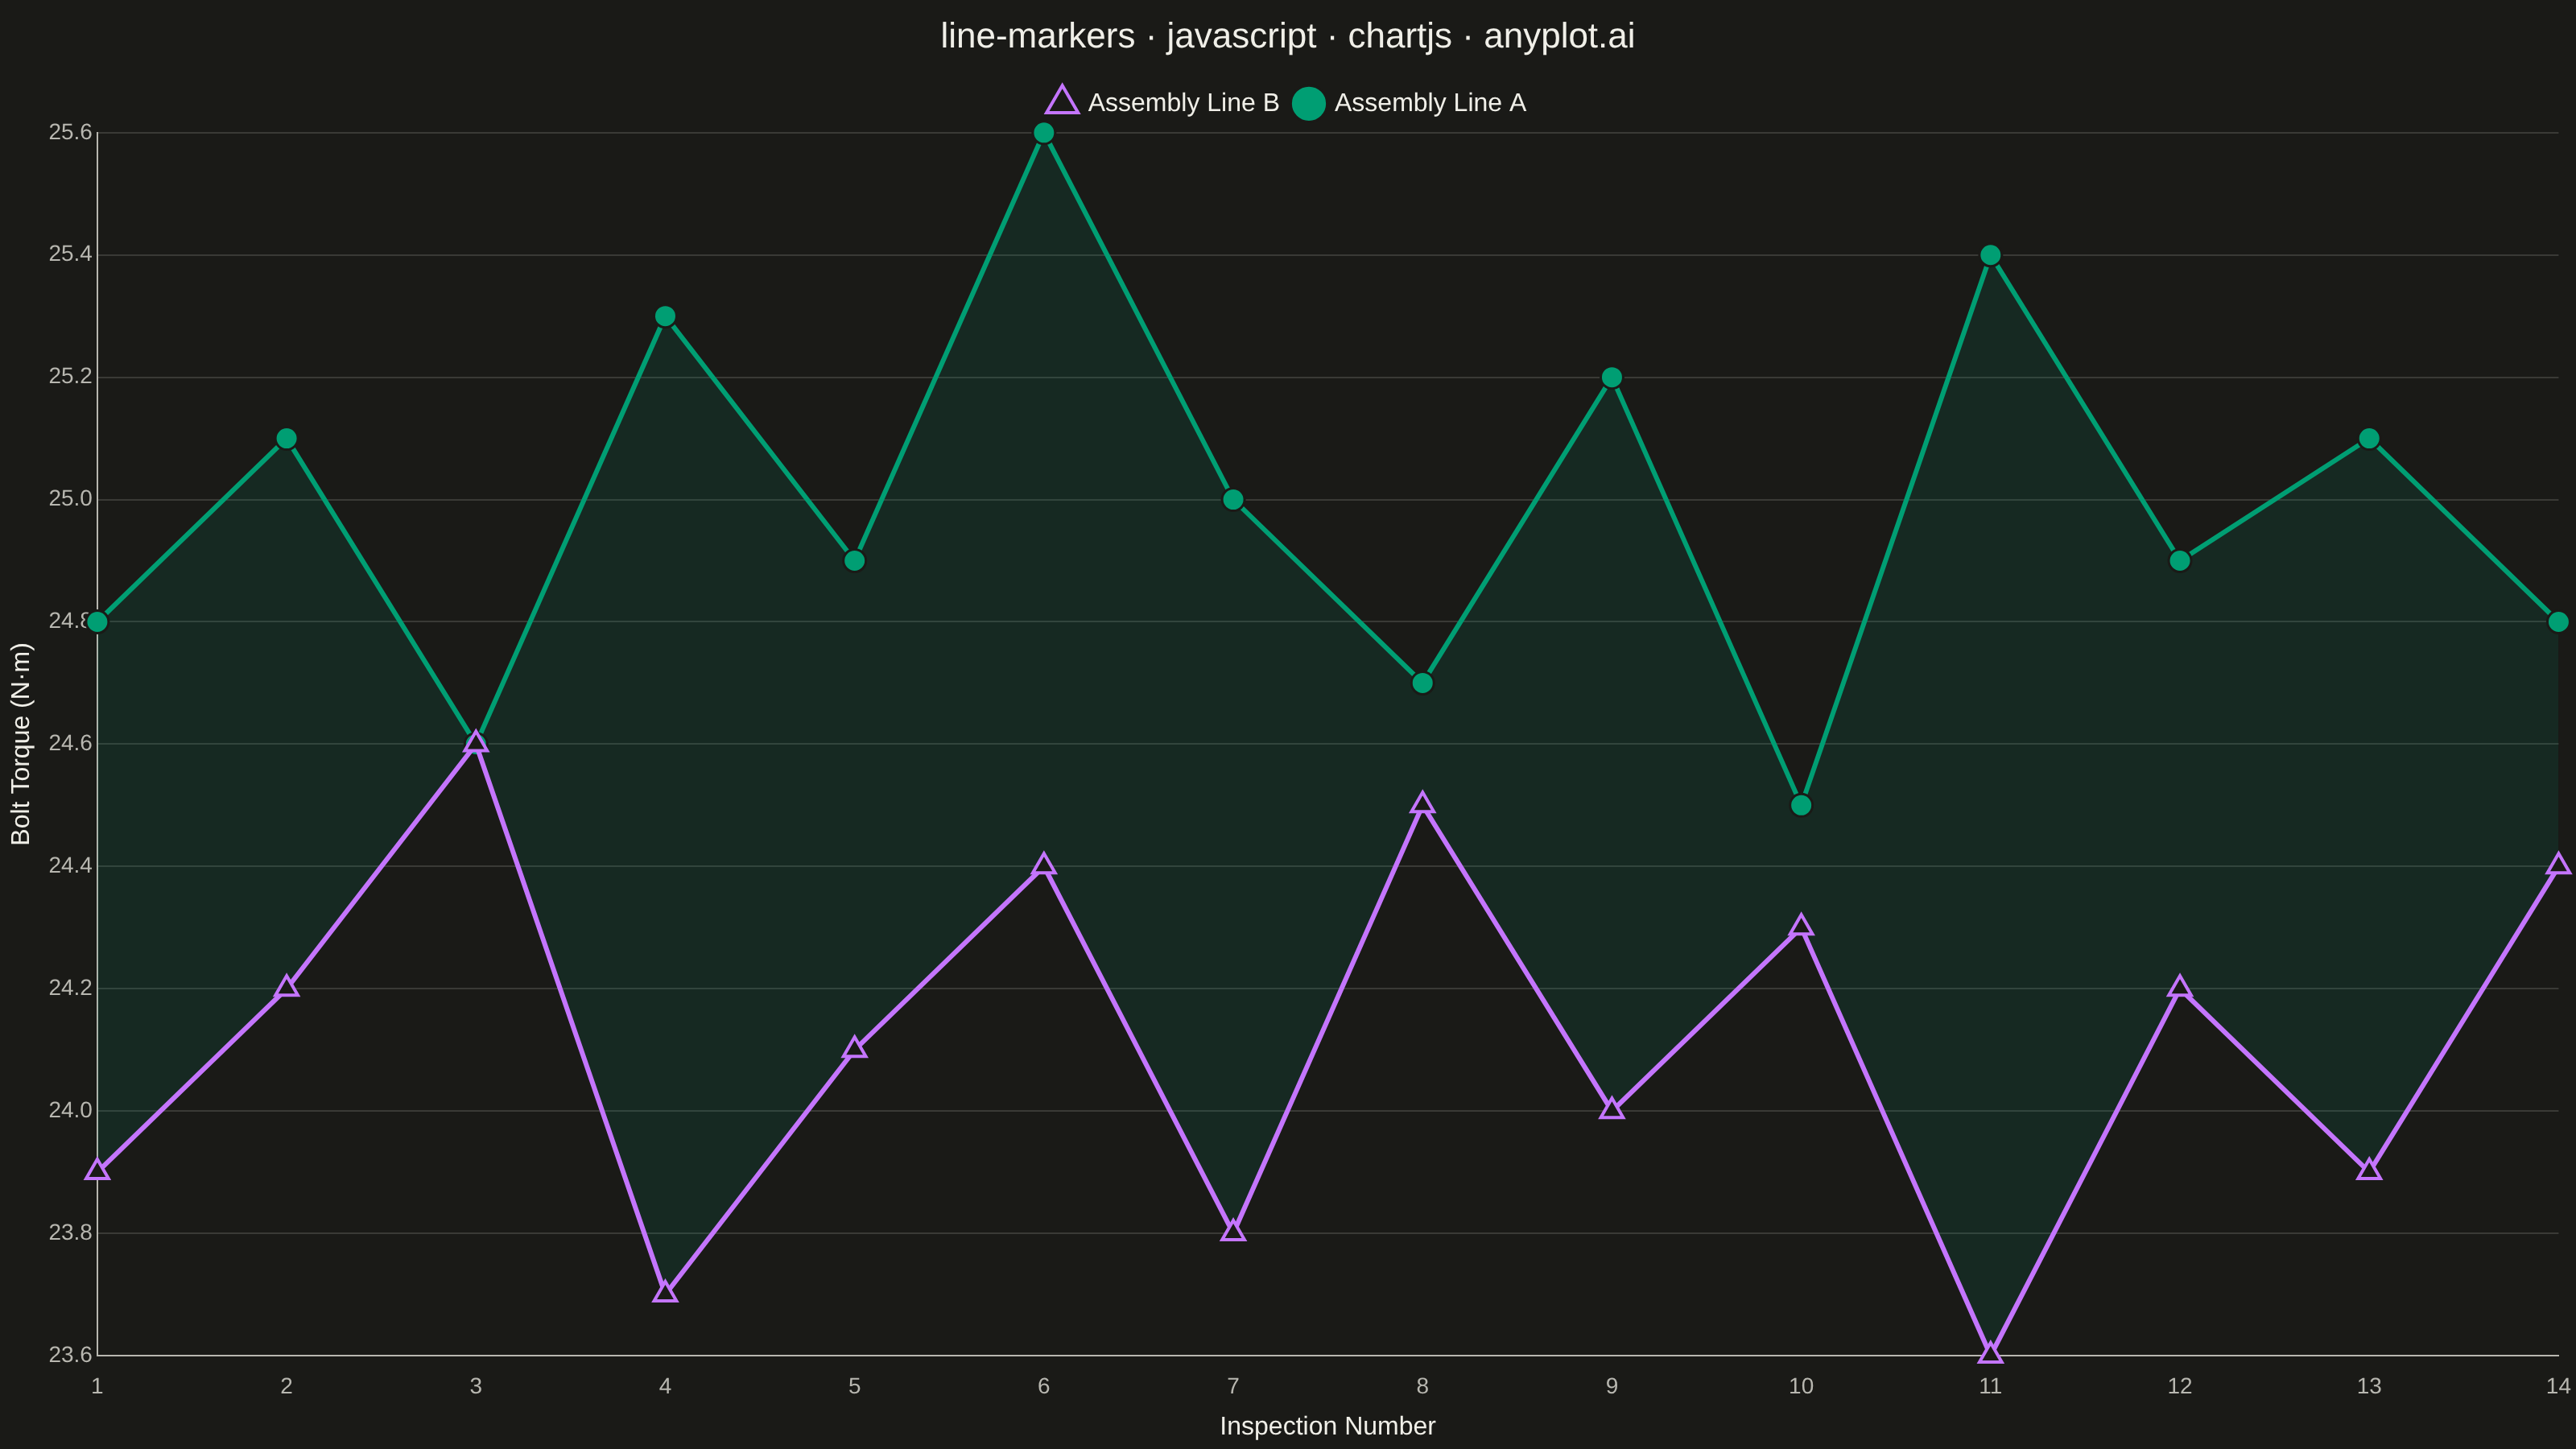
A line plot with visible markers at each data point, combining line and scatter plot features. This is particularly useful for sparse data where individual observations are significant.
// anyplot.ai
// line-markers: Line Plot with Markers
// Library: chartjs 4.4.7 | JavaScript 22.23.2
// Quality: 92/100 | Created: 2026-09-05

const t = window.ANYPLOT_TOKENS;

function withAlpha(hex, alpha) {
  const r = parseInt(hex.slice(1, 3), 16);
  const g = parseInt(hex.slice(3, 5), 16);
  const b = parseInt(hex.slice(5, 7), 16);
  return `rgba(${r}, ${g}, ${b}, ${alpha})`;
}

// --- Data (in-memory, deterministic) ---------------------------------------
const inspectionNumber = [1, 2, 3, 4, 5, 6, 7, 8, 9, 10, 11, 12, 13, 14];
const lineATorque = [24.8, 25.1, 24.6, 25.3, 24.9, 25.6, 25.0, 24.7, 25.2, 24.5, 25.4, 24.9, 25.1, 24.8];
const lineBTorque = [23.9, 24.2, 24.6, 23.7, 24.1, 24.4, 23.8, 24.5, 24.0, 24.3, 23.6, 24.2, 23.9, 24.4];

const lineAData = inspectionNumber.map((x, i) => ({ x, y: lineATorque[i] }));
const lineBData = inspectionNumber.map((x, i) => ({ x, y: lineBTorque[i] }));

// --- Mount -------------------------------------------------------------------
const canvas = document.createElement("canvas");
document.getElementById("container").appendChild(canvas);

// --- Chart -------------------------------------------------------------------
new Chart(canvas, {
  type: "line",
  data: {
    datasets: [
      {
        label: "Assembly Line A",
        data: lineAData,
        borderColor: t.palette[0],
        backgroundColor: withAlpha(t.palette[0], 0.12),
        fill: "+1",
        pointStyle: "circle",
        pointRadius: 7,
        pointHoverRadius: 7,
        pointBackgroundColor: t.palette[0],
        pointBorderColor: t.pageBg,
        pointBorderWidth: 1.5,
        borderWidth: 3,
        tension: 0,
        order: 2,
      },
      {
        label: "Assembly Line B",
        data: lineBData,
        borderColor: t.palette[1],
        pointStyle: "triangle",
        pointRadius: 8,
        pointHoverRadius: 8,
        pointBackgroundColor: t.pageBg,
        pointBorderColor: t.palette[1],
        pointBorderWidth: 2,
        borderWidth: 3,
        tension: 0,
        order: 1,
      },
    ],
  },
  options: {
    responsive: true,
    maintainAspectRatio: false,
    animation: false,
    plugins: {
      title: {
        display: true,
        text: "line-markers · javascript · chartjs · anyplot.ai",
        color: t.ink,
        font: { size: 22, weight: "500" },
      },
      legend: {
        position: "top",
        labels: { color: t.ink, font: { size: 16 }, usePointStyle: true },
      },
    },
    scales: {
      x: {
        type: "linear",
        ticks: { color: t.inkSoft, font: { size: 14 }, stepSize: 1 },
        grid: { display: false },
        border: { color: t.inkSoft },
        title: { display: true, text: "Inspection Number", color: t.ink, font: { size: 16 } },
      },
      y: {
        ticks: { color: t.inkSoft, font: { size: 14 } },
        grid: { color: t.grid, drawTicks: false },
        border: { color: t.inkSoft },
        title: { display: true, text: "Bolt Torque (N·m)", color: t.ink, font: { size: 16 } },
      },
    },
  },
});
Runnable source as JSON, for any HTTP client: https://api.anyplot.ai/specs/line-markers/chartjs/code. Any spec id and library id listed in llms-full.txt fit the same URL shape; every URL below is complete and callable.
{
  "spec_id": "line-markers",
  "language": "javascript",
  "library": "chartjs",
  "page": "https://anyplot.ai/line-markers/javascript/chartjs",
  "hub": "https://anyplot.ai/line-markers",
  "code_json": "https://api.anyplot.ai/specs/line-markers/chartjs/code",
  "spec_json": "https://api.anyplot.ai/specs/line-markers",
  "render_light_png": "https://storage.googleapis.com/anyplot-images/plots/line-markers/javascript/chartjs/plot-light.png",
  "render_dark_png": "https://storage.googleapis.com/anyplot-images/plots/line-markers/javascript/chartjs/plot-dark.png",
  "interactive_light_html": "https://storage.googleapis.com/anyplot-images/plots/line-markers/javascript/chartjs/plot-light.html",
  "interactive_dark_html": "https://storage.googleapis.com/anyplot-images/plots/line-markers/javascript/chartjs/plot-dark.html",
  "quality_score": 92.0,
  "license": "MIT",
  "guide": "https://anyplot.ai/llms.txt"
}
Part of Line Plot with Markers on anyplot.ai.