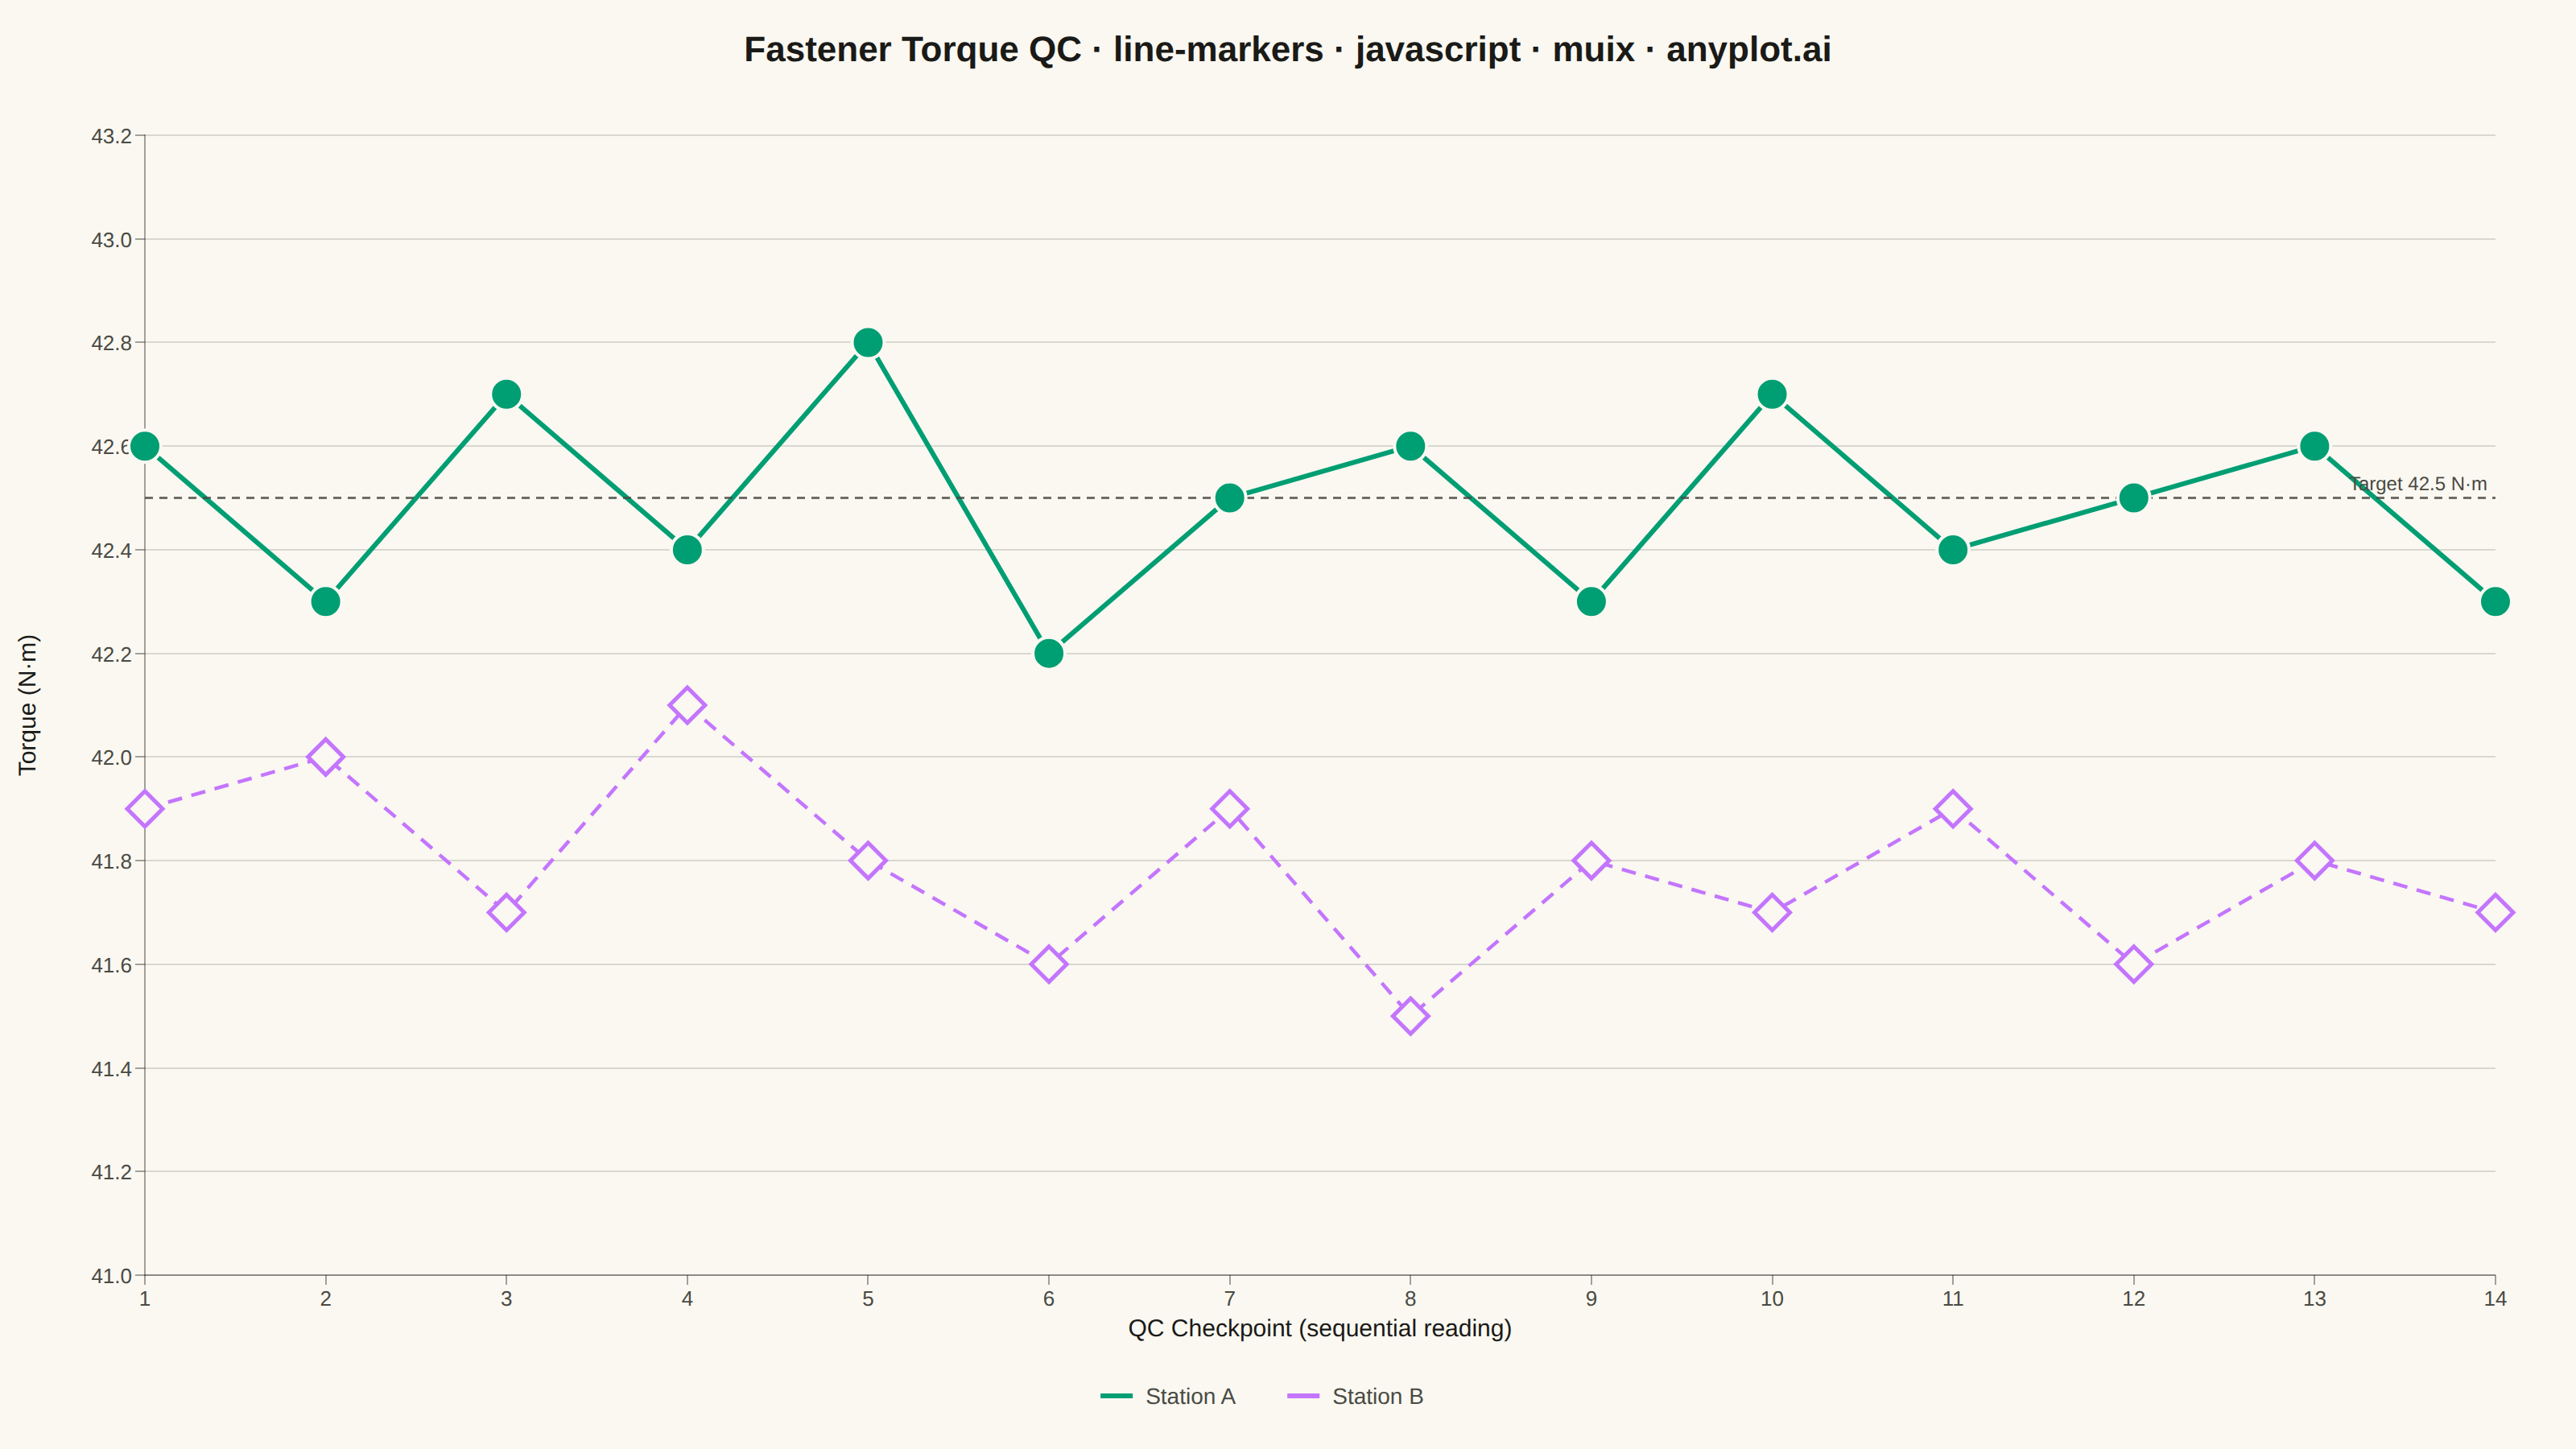
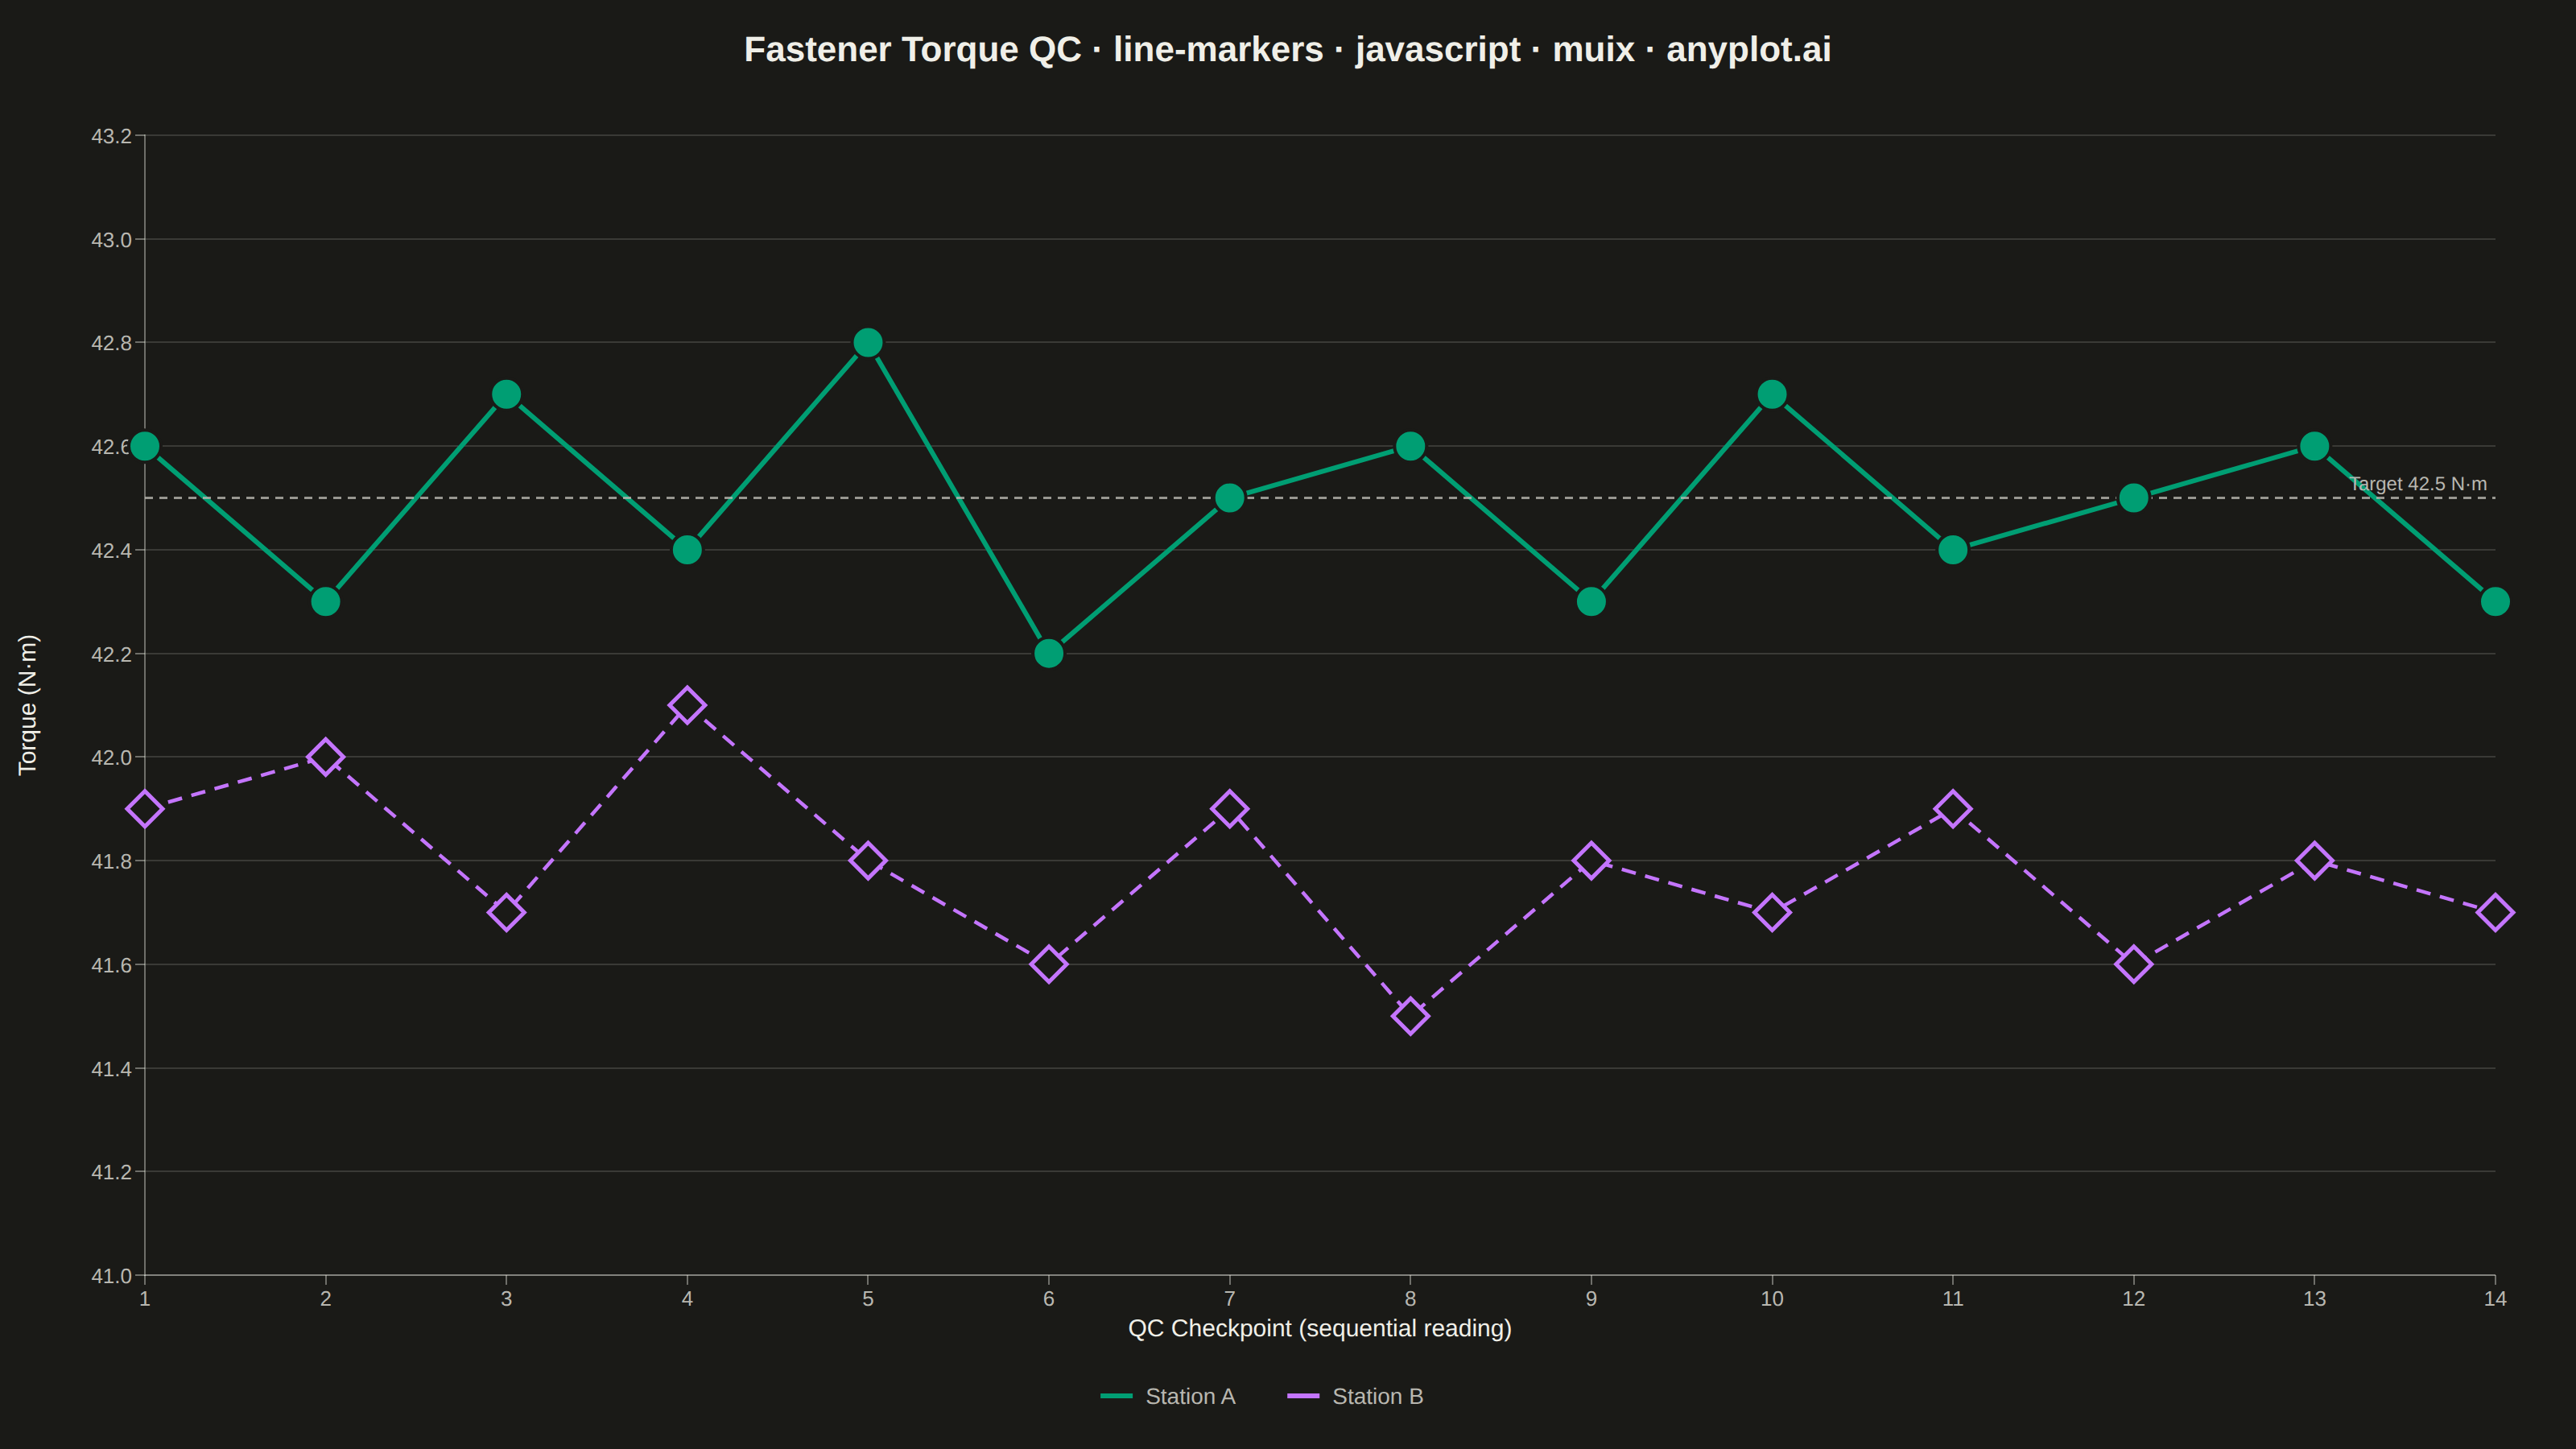
The same plot in 14 other libraries — JavaScript: Chart.js, D3.js, Apache ECharts, Highcharts; Python: Altair, Bokeh, lets-plot, Matplotlib, Plotly, plotnine, Pygal, Seaborn; R: ggplot2; Julia: Makie.jl. Compare all 15 side by side: Line Plot with Markers in Python, R, Julia and JavaScript.
A line plot with visible markers at each data point, combining line and scatter plot features. This is particularly useful for sparse data where individual observations are significant.
// anyplot.ai
// line-markers: Line Plot with Markers
// Library: muix 7.29.1 | JavaScript 22.23.2
// Quality: 91/100 | Created: 2026-09-05
import { LineChart } from "@mui/x-charts/LineChart";
import { ChartsReferenceLine } from "@mui/x-charts/ChartsReferenceLine";
import { ChartsText } from "@mui/x-charts/ChartsText";
import {
  useXScale,
  useYScale,
  useDrawingArea,
  getValueToPositionMapper,
} from "@mui/x-charts/hooks";
import Box from "@mui/material/Box";
import Typography from "@mui/material/Typography";

const t = window.ANYPLOT_TOKENS;

// --- Data (in-memory, deterministic) ----------------------------------------
// Torque-wrench QC readings at 14 sequential fastener checkpoints on two
// assembly stations — sparse enough that each individual reading matters,
// which is exactly why the markers (not just the trend line) carry meaning.
const checkpoints = [1, 2, 3, 4, 5, 6, 7, 8, 9, 10, 11, 12, 13, 14];
const stationA = [
  42.6, 42.3, 42.7, 42.4, 42.8, 42.2, 42.5, 42.6, 42.3, 42.7, 42.4, 42.5, 42.6,
  42.3,
];
const stationB = [
  41.9, 42.0, 41.7, 42.1, 41.8, 41.6, 41.9, 41.5, 41.8, 41.7, 41.9, 41.6, 41.8,
  41.7,
];
const TARGET_TORQUE = 42.5;

const TITLE =
  "Fastener Torque QC · line-markers · javascript · muix · anyplot.ai";

// Station A: solid filled circles — primary series, drawn above its line.
function CircleMarks({ color }: { color: string }) {
  const xScale = useXScale("checkpoint-axis");
  const yScale = useYScale("torque-axis");
  const toX = getValueToPositionMapper(xScale);
  const r = 10;
  return (
    <g>
      {checkpoints.map((x, i) => (
        <circle
          key={x}
          cx={toX(x)}
          cy={yScale(stationA[i])}
          r={r}
          fill={color}
          stroke={t.pageBg}
          strokeWidth={2}
        />
      ))}
    </g>
  );
}

// Station B: hollow diamonds — visually distinct shape + fill for the second series.
function DiamondMarks({ color }: { color: string }) {
  const xScale = useXScale("checkpoint-axis");
  const yScale = useYScale("torque-axis");
  const toX = getValueToPositionMapper(xScale);
  const r = 11;
  return (
    <g>
      {checkpoints.map((x, i) => {
        const cx = toX(x);
        const cy = yScale(stationB[i]);
        const points = `${cx},${cy - r} ${cx + r},${cy} ${cx},${cy + r} ${cx - r},${cy}`;
        return (
          <polygon
            key={x}
            points={points}
            fill={t.pageBg}
            stroke={color}
            strokeWidth={2.5}
          />
        );
      })}
    </g>
  );
}

// Hand-rolled y-axis title: MUI X's built-in `yAxis.label` offsets itself from
// a hardcoded tickFontSize guess rather than the tick labels' real measured
// width, so a 4-digit "42.6"-style tick collides with it. A fixed-position
// label sidesteps that collision.
function YAxisTitle({ text }: { text: string }) {
  const { top, height } = useDrawingArea();
  return (
    <ChartsText
      x={22}
      y={top + height / 2}
      text={text}
      fill={t.ink}
      style={{
        fontSize: 15,
        angle: -90,
        textAnchor: "middle",
        dominantBaseline: "auto",
      }}
    />
  );
}

// --- Chart (default-exported component — the harness mounts it) ------------
export default function Chart() {
  const { width, height } = window.ANYPLOT_SIZE;
  const TITLE_H = 60;
  const titleSize =
    TITLE.length > 67 ? Math.max(16, Math.round((22 * 67) / TITLE.length)) : 22;

  return (
    <Box
      sx={{
        width,
        height,
        bgcolor: t.pageBg,
        display: "flex",
        flexDirection: "column",
        boxSizing: "border-box",
      }}
    >
      <Box
        sx={{
          height: TITLE_H,
          display: "flex",
          alignItems: "center",
          justifyContent: "center",
        }}
      >
        <Typography sx={{ color: t.ink, fontSize: titleSize, fontWeight: 600 }}>
          {TITLE}
        </Typography>
      </Box>

      <LineChart
        width={width}
        height={height - TITLE_H}
        skipAnimation
        xAxis={[
          {
            id: "checkpoint-axis",
            scaleType: "point",
            data: checkpoints,
            label: "QC Checkpoint (sequential reading)",
            tickLabelStyle: { fontSize: 13, fill: t.inkSoft },
            labelStyle: { fontSize: 15, fill: t.ink },
          },
        ]}
        yAxis={[
          {
            id: "torque-axis",
            min: 41.0,
            max: 43.2,
            valueFormatter: (v: number) => v.toFixed(1),
            tickLabelStyle: { fontSize: 13, fill: t.inkSoft },
            labelStyle: { fontSize: 15, fill: t.ink },
          },
        ]}
        series={[
          {
            id: "stationA",
            data: stationA,
            label: "Station A",
            color: t.palette[0],
            curve: "linear",
            showMark: false,
            xAxisId: "checkpoint-axis",
            yAxisId: "torque-axis",
          },
          {
            id: "stationB",
            data: stationB,
            label: "Station B",
            color: t.palette[1],
            curve: "linear",
            showMark: false,
            xAxisId: "checkpoint-axis",
            yAxisId: "torque-axis",
          },
        ]}
        grid={{ horizontal: true }}
        margin={{ top: 24, right: 50, bottom: 108, left: 90 }}
        sx={{
          "& .MuiLineElement-series-stationA": { strokeWidth: 3 },
          "& .MuiLineElement-series-stationB": {
            strokeWidth: 2.25,
            strokeDasharray: "9 6",
          },
          "& .MuiChartsAxis-line": { stroke: t.inkSoft, strokeOpacity: 0.4 },
          "& .MuiChartsAxis-tick": { stroke: t.inkSoft, strokeOpacity: 0.4 },
          "& .MuiChartsGrid-line": { stroke: t.grid },
        }}
        slotProps={{
          legend: {
            position: { vertical: "bottom", horizontal: "middle" },
            direction: "row",
            itemMarkWidth: 20,
            itemMarkHeight: 3,
            markGap: 8,
            itemGap: 32,
            labelStyle: { fontSize: 14, fill: t.inkSoft },
          },
        }}
      >
        <YAxisTitle text="Torque (N·m)" />
        <ChartsReferenceLine
          y={TARGET_TORQUE}
          label={`Target ${TARGET_TORQUE.toFixed(1)} N·m`}
          labelAlign="end"
          lineStyle={{
            stroke: t.inkSoft,
            strokeDasharray: "5 4",
            strokeWidth: 1.5,
            opacity: 0.8,
          }}
          labelStyle={{ fontSize: 12, fill: t.inkSoft }}
        />
        <CircleMarks color={t.palette[0]} />
        <DiamondMarks color={t.palette[1]} />
      </LineChart>
    </Box>
  );
}
Runnable source as JSON, for any HTTP client: https://api.anyplot.ai/specs/line-markers/muix/code. Any spec id and library id listed in llms-full.txt fit the same URL shape; every URL below is complete and callable.
{
  "spec_id": "line-markers",
  "language": "javascript",
  "library": "muix",
  "page": "https://anyplot.ai/line-markers/javascript/muix",
  "hub": "https://anyplot.ai/line-markers",
  "code_json": "https://api.anyplot.ai/specs/line-markers/muix/code",
  "spec_json": "https://api.anyplot.ai/specs/line-markers",
  "render_light_png": "https://storage.googleapis.com/anyplot-images/plots/line-markers/javascript/muix/plot-light.png",
  "render_dark_png": "https://storage.googleapis.com/anyplot-images/plots/line-markers/javascript/muix/plot-dark.png",
  "interactive_light_html": "https://storage.googleapis.com/anyplot-images/plots/line-markers/javascript/muix/plot-light.html",
  "interactive_dark_html": "https://storage.googleapis.com/anyplot-images/plots/line-markers/javascript/muix/plot-dark.html",
  "quality_score": 91.0,
  "license": "MIT",
  "guide": "https://anyplot.ai/llms.txt"
}
Part of Line Plot with Markers on anyplot.ai.