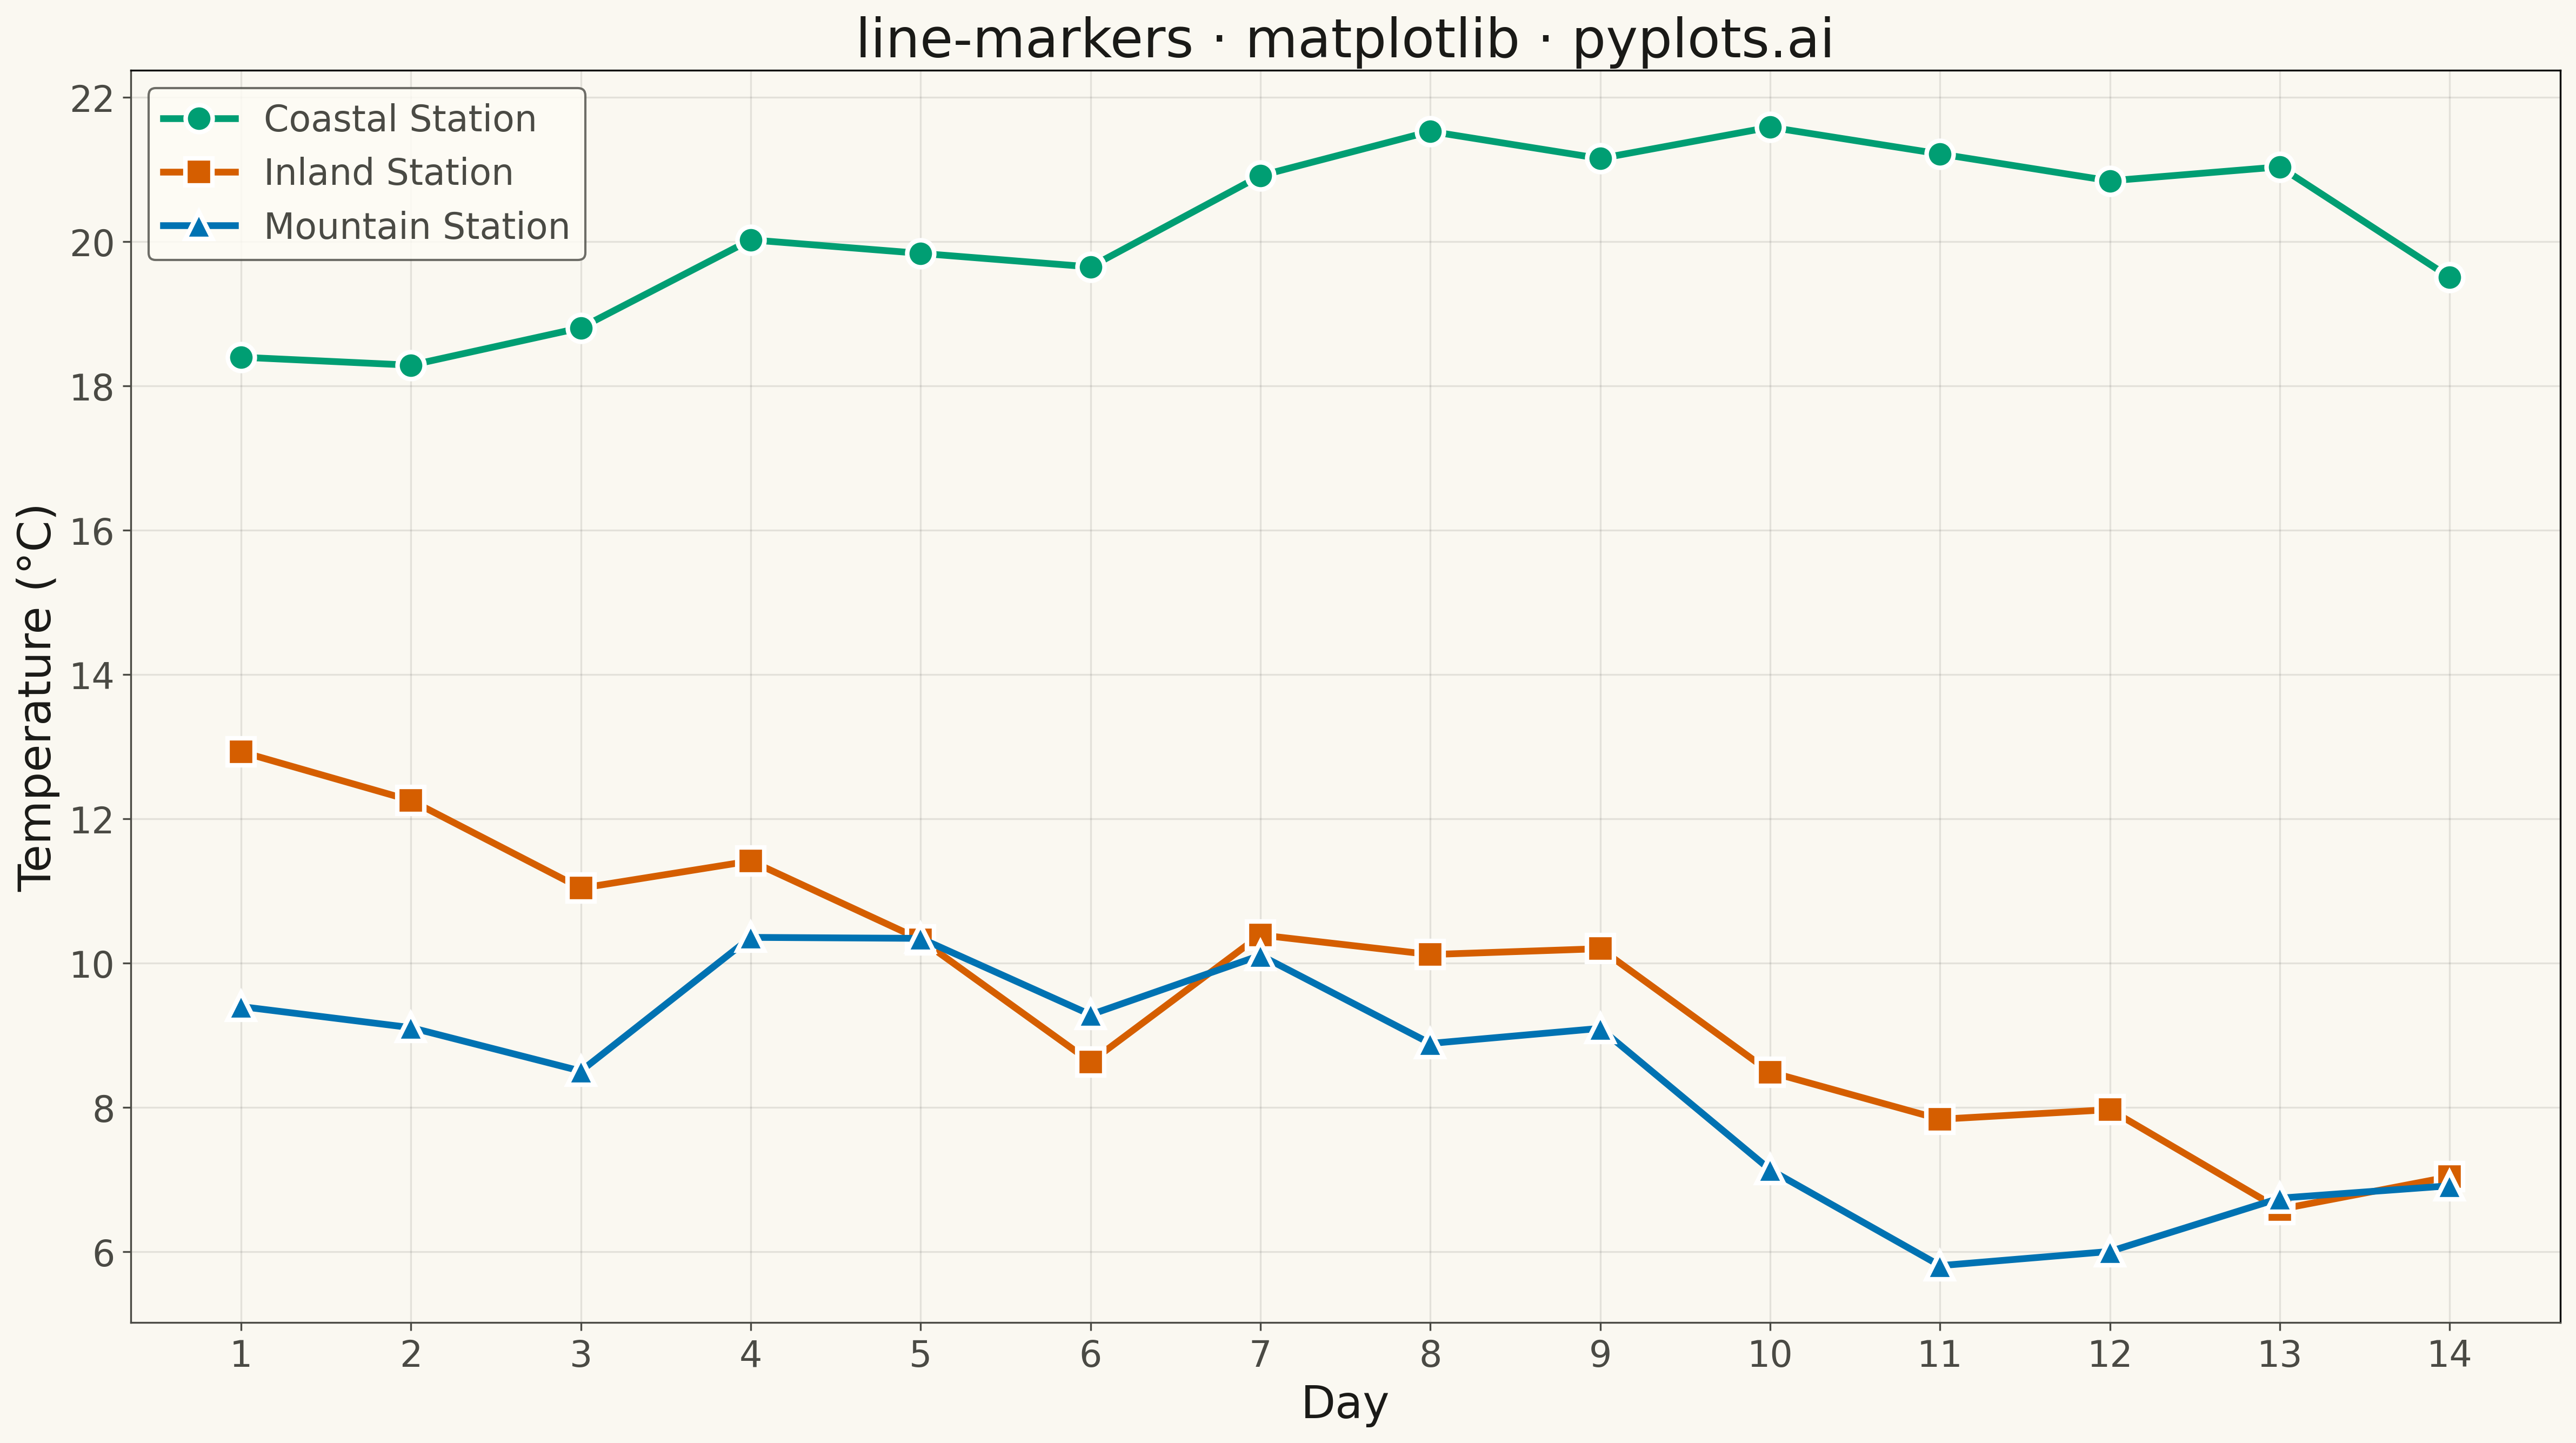
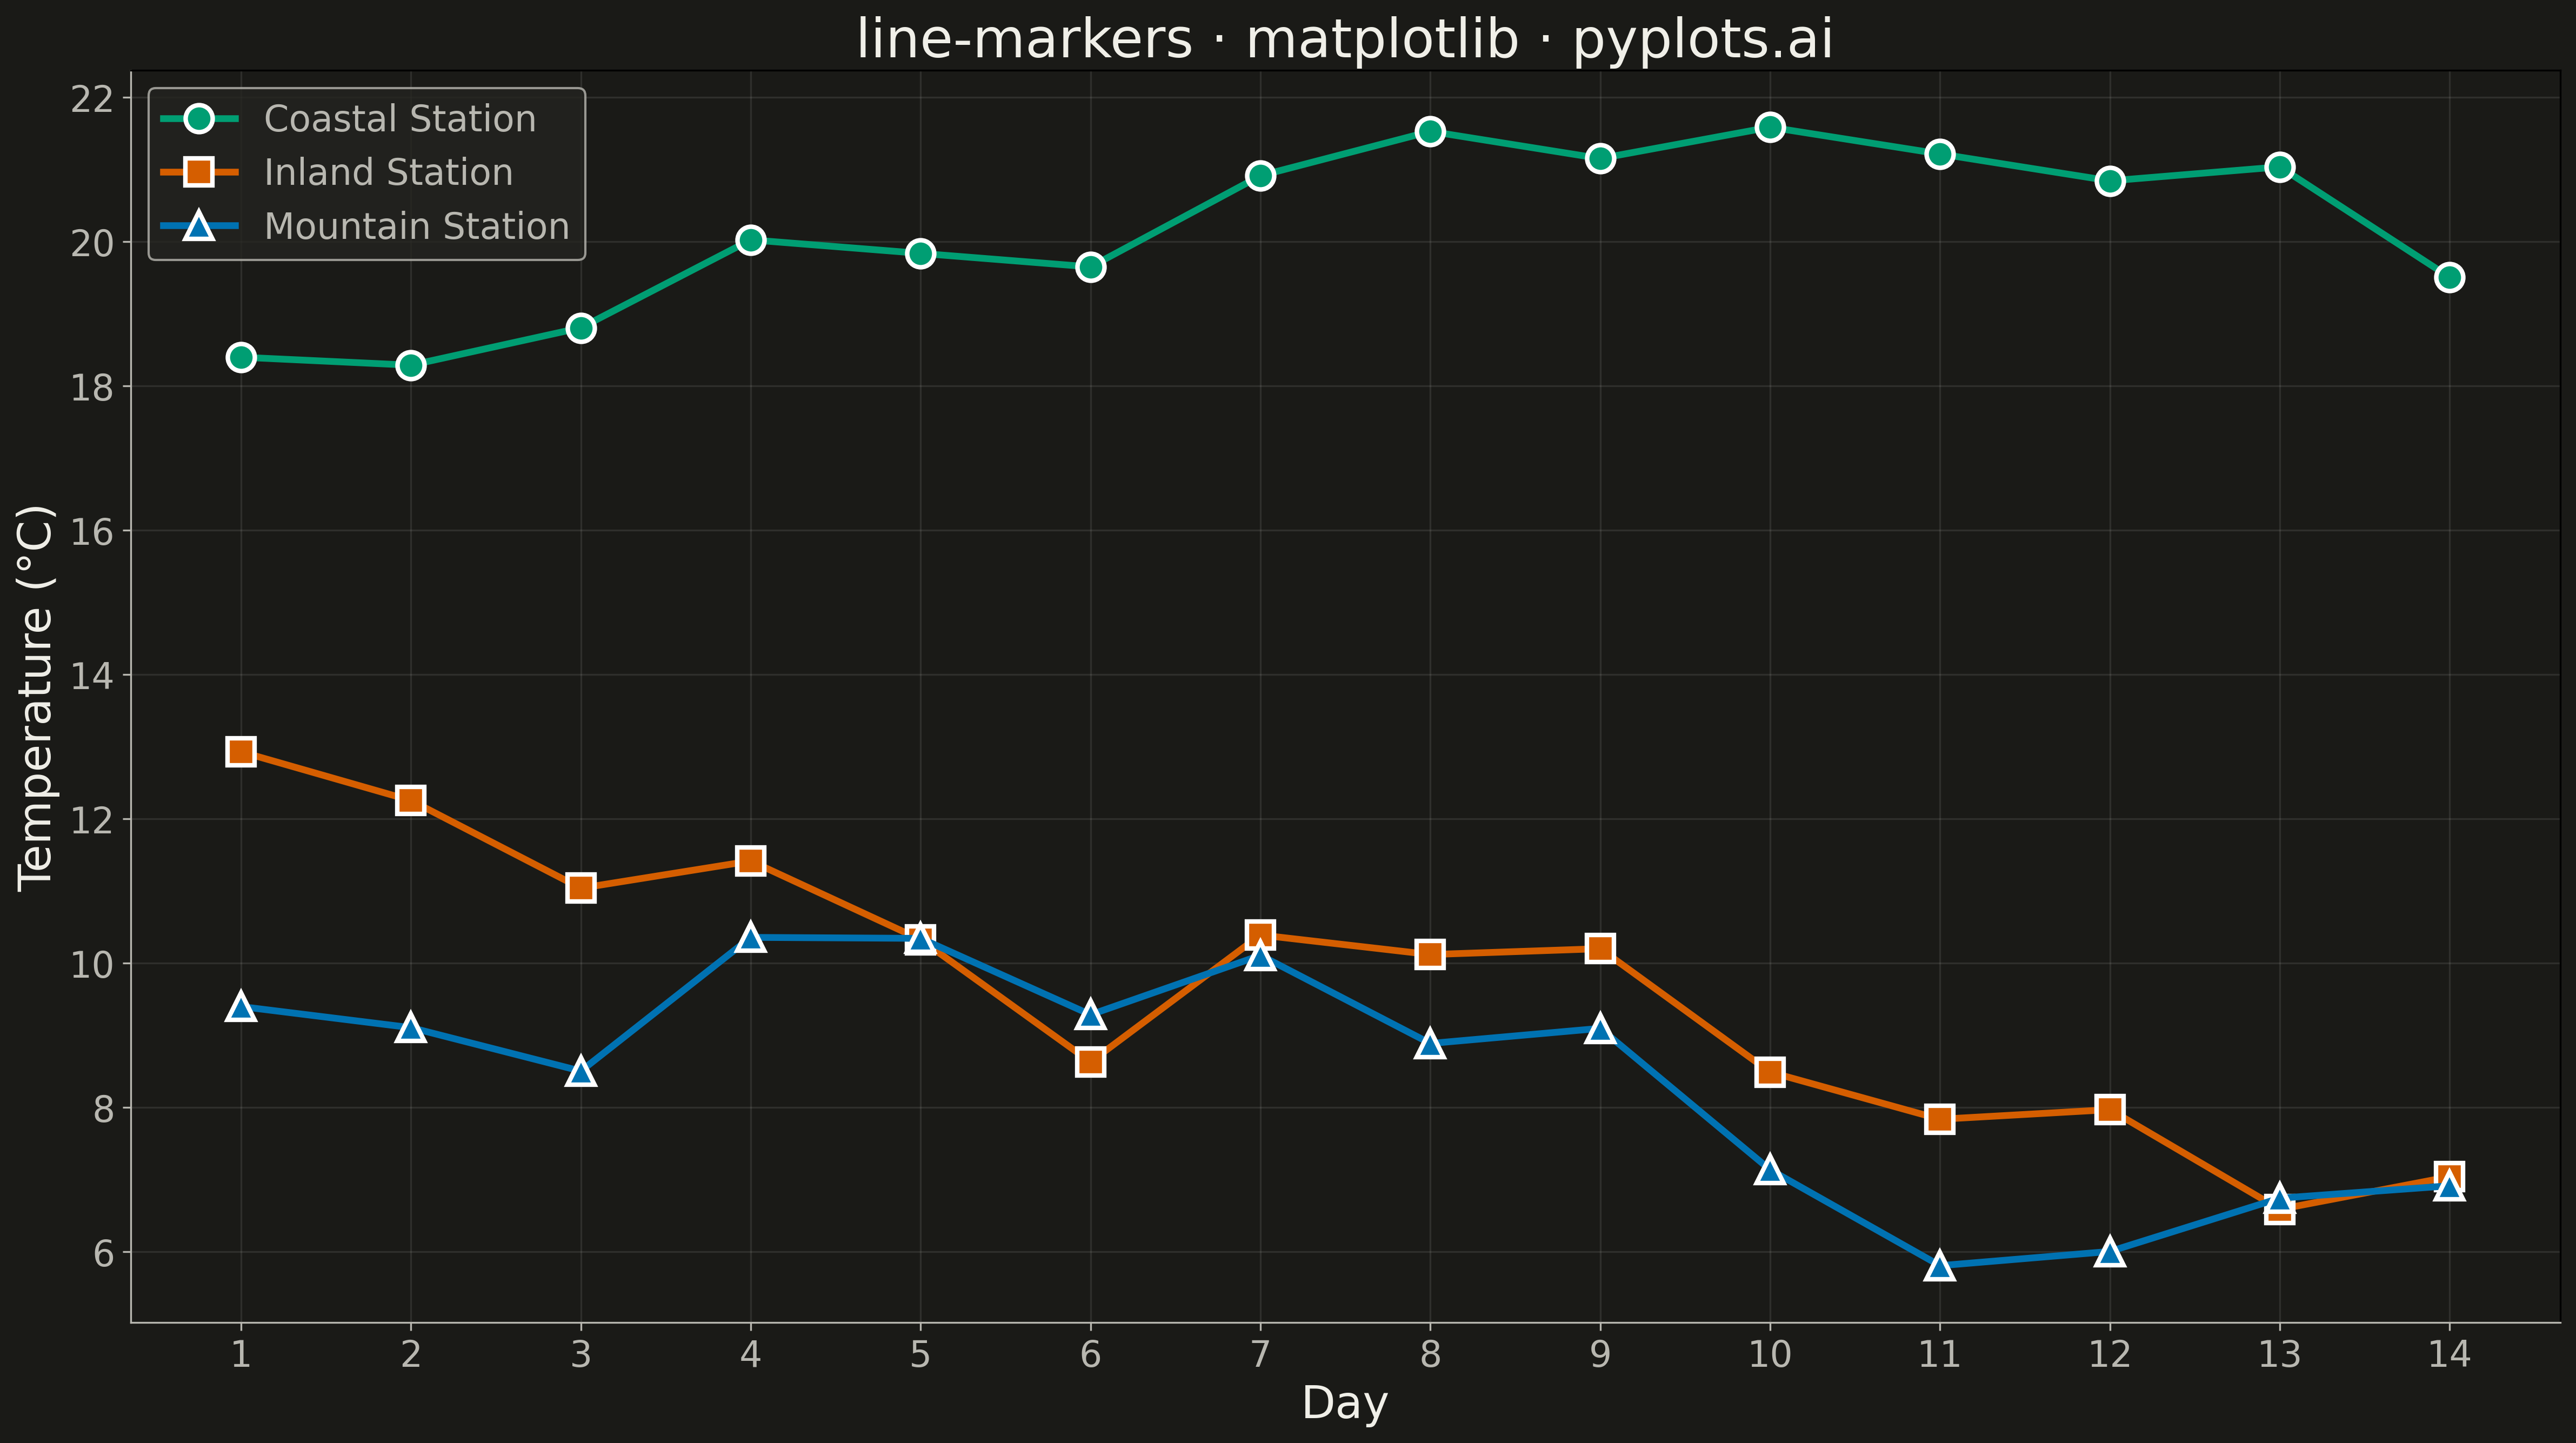
A line plot with visible markers at each data point, combining line and scatter plot features. This is particularly useful for sparse data where individual observations are significant.
""" anyplot.ai
line-markers: Line Plot with Markers
Library: matplotlib 3.10.9 | Python 3.13.13
Quality: 75/100 | Updated: 2026-05-12
"""

import matplotlib.pyplot as plt
import numpy as np


# Data - Temperature readings over 14 days from weather stations
np.random.seed(42)
days = np.arange(1, 15)

# Station A: Coastal location (moderate, stable)
station_a = 18 + np.cumsum(np.random.randn(14) * 0.8)

# Station B: Inland location (more variable)
station_b = 15 + np.cumsum(np.random.randn(14) * 1.2)

# Station C: Mountain location (cooler, different pattern)
station_c = 10 + np.cumsum(np.random.randn(14) * 1.0)

# Create plot
fig, ax = plt.subplots(figsize=(16, 9))

# Plot lines with different marker styles
ax.plot(
    days,
    station_a,
    marker="o",
    markersize=12,
    linewidth=3,
    color="#306998",
    label="Coastal Station",
    markeredgecolor="white",
    markeredgewidth=2,
)

ax.plot(
    days,
    station_b,
    marker="s",
    markersize=12,
    linewidth=3,
    color="#FFD43B",
    label="Inland Station",
    markeredgecolor="white",
    markeredgewidth=2,
)

ax.plot(
    days,
    station_c,
    marker="^",
    markersize=12,
    linewidth=3,
    color="#E74C3C",
    label="Mountain Station",
    markeredgecolor="white",
    markeredgewidth=2,
)

# Labels and styling
ax.set_xlabel("Day", fontsize=20)
ax.set_ylabel("Temperature (°C)", fontsize=20)
ax.set_title("line-markers · matplotlib · pyplots.ai", fontsize=24)
ax.tick_params(axis="both", labelsize=16)
ax.grid(True, alpha=0.3, linestyle="--")
ax.legend(fontsize=16, loc="best")

# Set x-axis to show all days
ax.set_xticks(days)

plt.tight_layout()
plt.savefig("plot.png", dpi=300, bbox_inches="tight")
Runnable source as JSON, for any HTTP client: https://api.anyplot.ai/specs/line-markers/matplotlib/code. Any spec id and library id listed in llms-full.txt fit the same URL shape; every URL below is complete and callable.
{
  "spec_id": "line-markers",
  "language": "python",
  "library": "matplotlib",
  "page": "https://anyplot.ai/line-markers/python/matplotlib",
  "hub": "https://anyplot.ai/line-markers",
  "code_json": "https://api.anyplot.ai/specs/line-markers/matplotlib/code",
  "spec_json": "https://api.anyplot.ai/specs/line-markers",
  "render_light_png": "https://storage.googleapis.com/anyplot-images/plots/line-markers/python/matplotlib/plot-light.png",
  "render_dark_png": "https://storage.googleapis.com/anyplot-images/plots/line-markers/python/matplotlib/plot-dark.png",
  "quality_score": 75.0,
  "license": "MIT",
  "guide": "https://anyplot.ai/llms.txt"
}
Part of Line Plot with Markers on anyplot.ai.