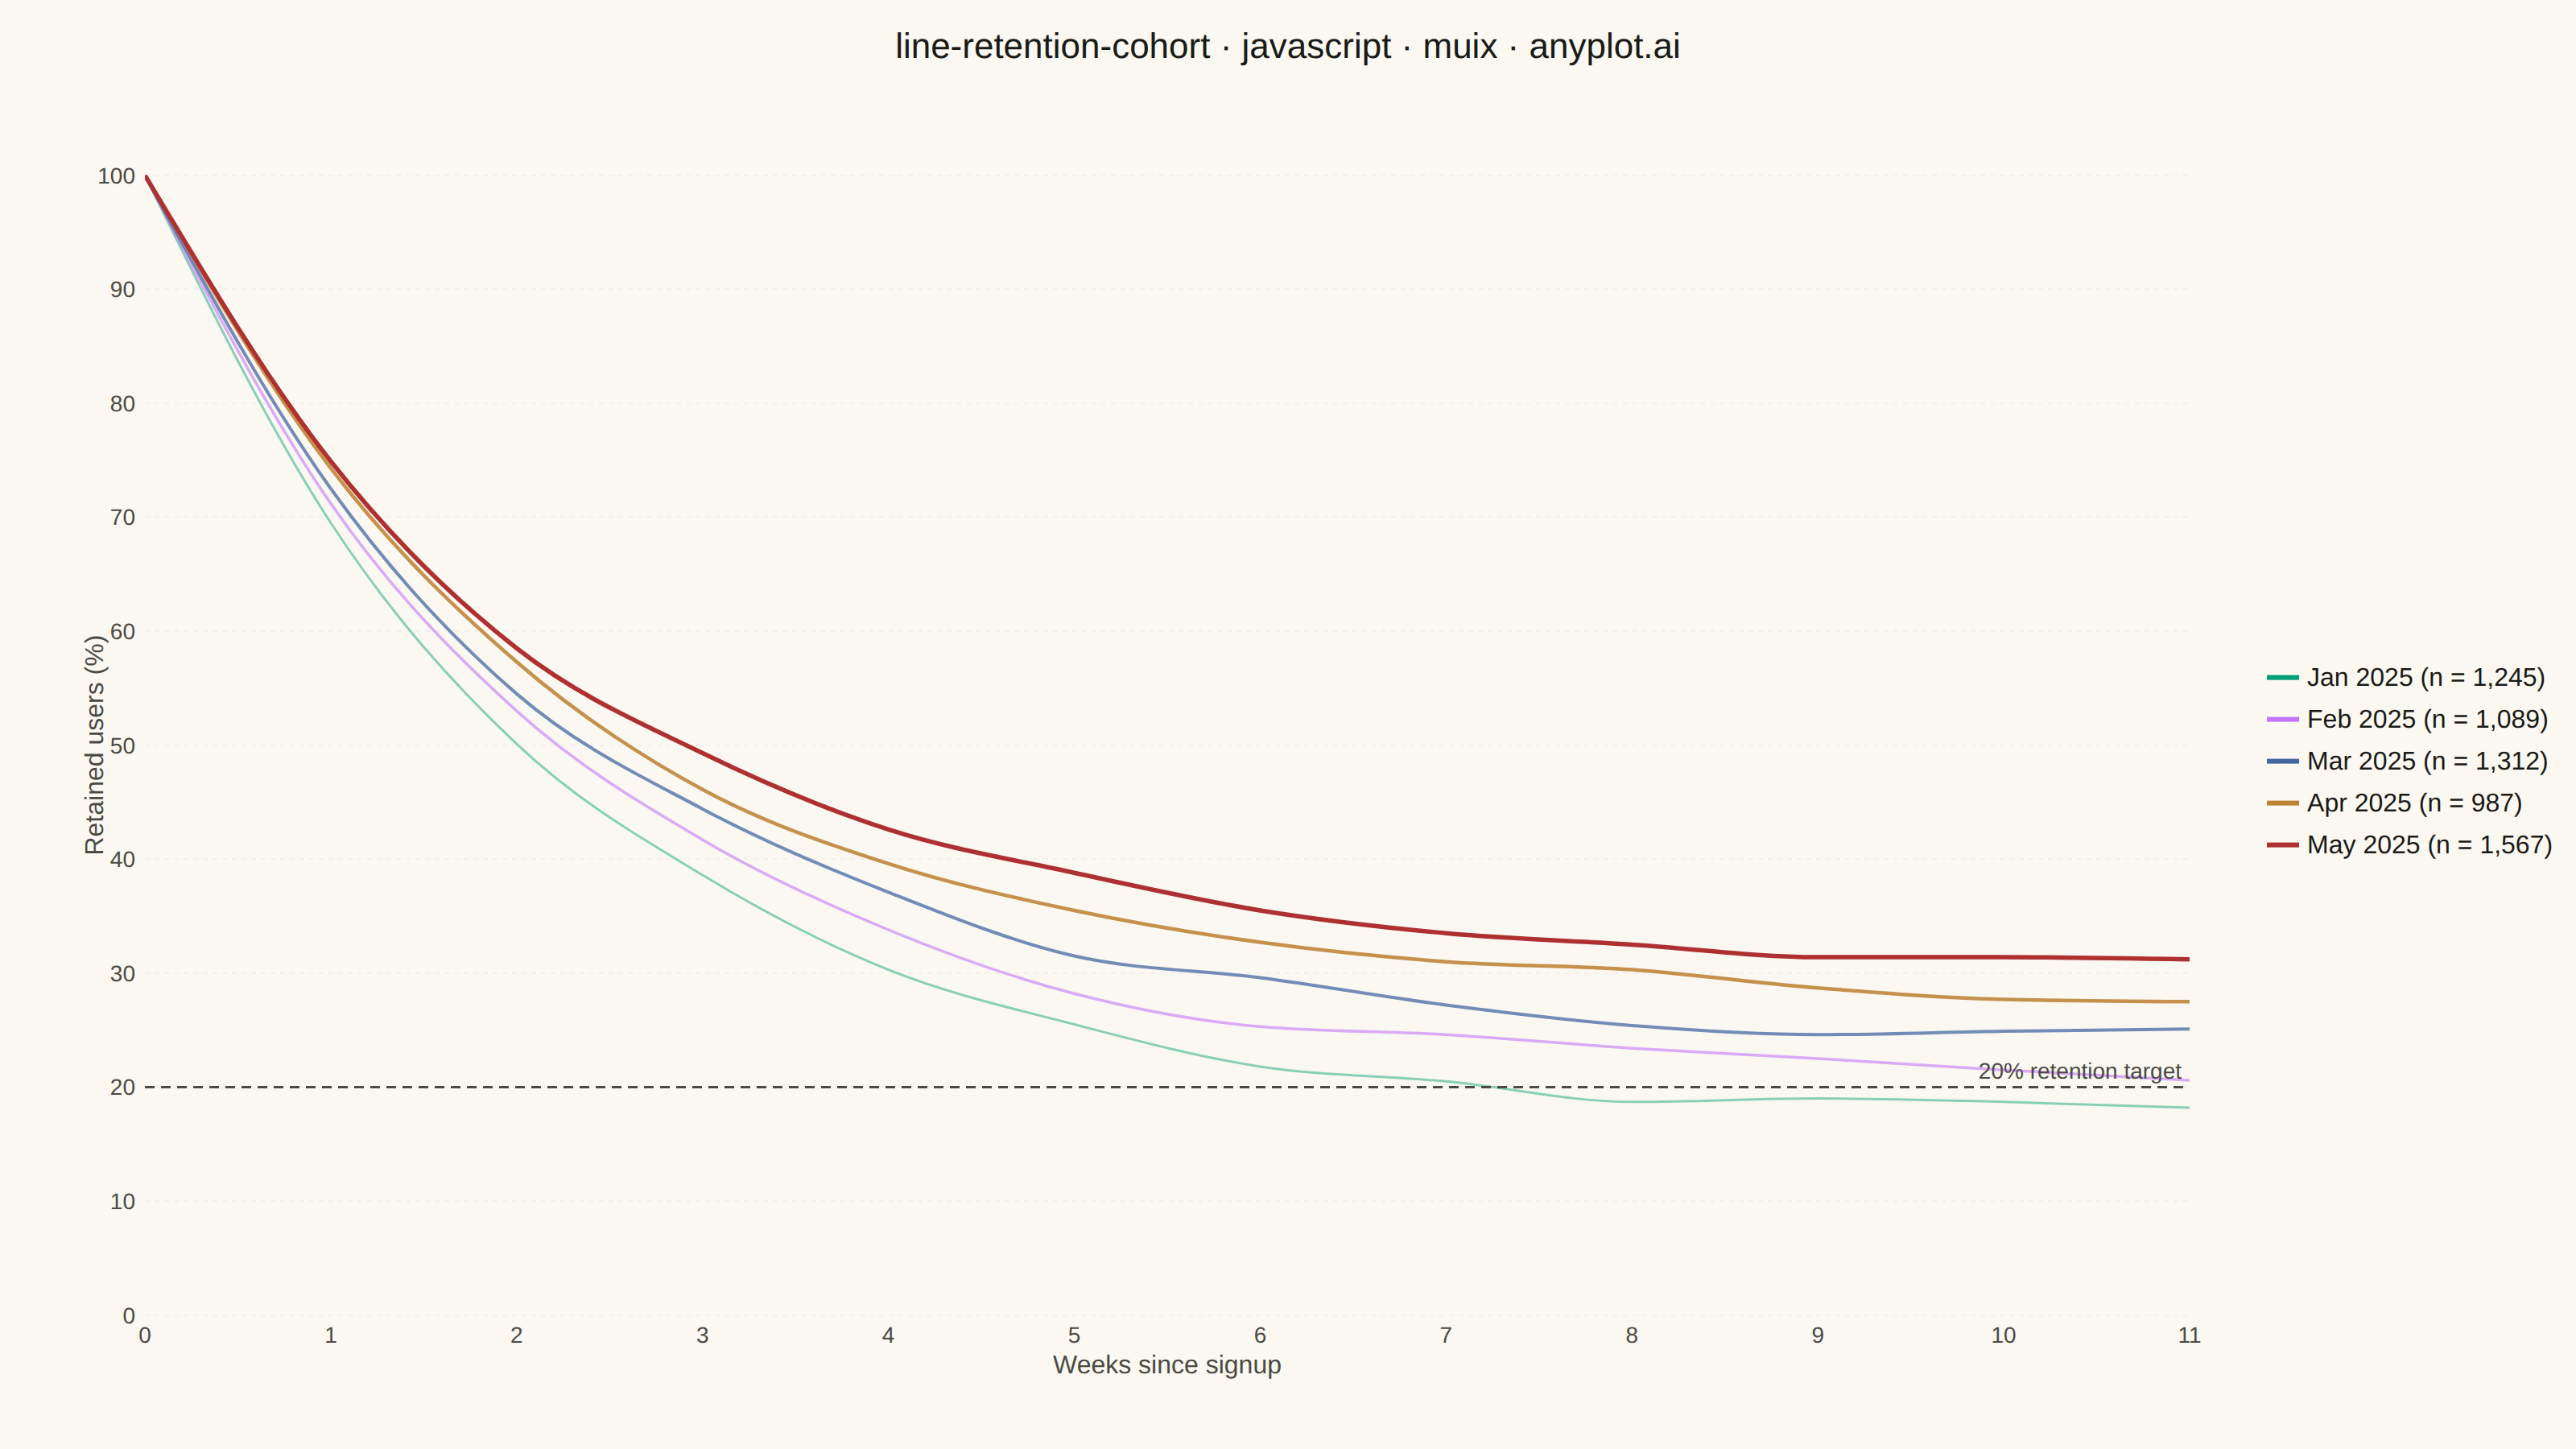
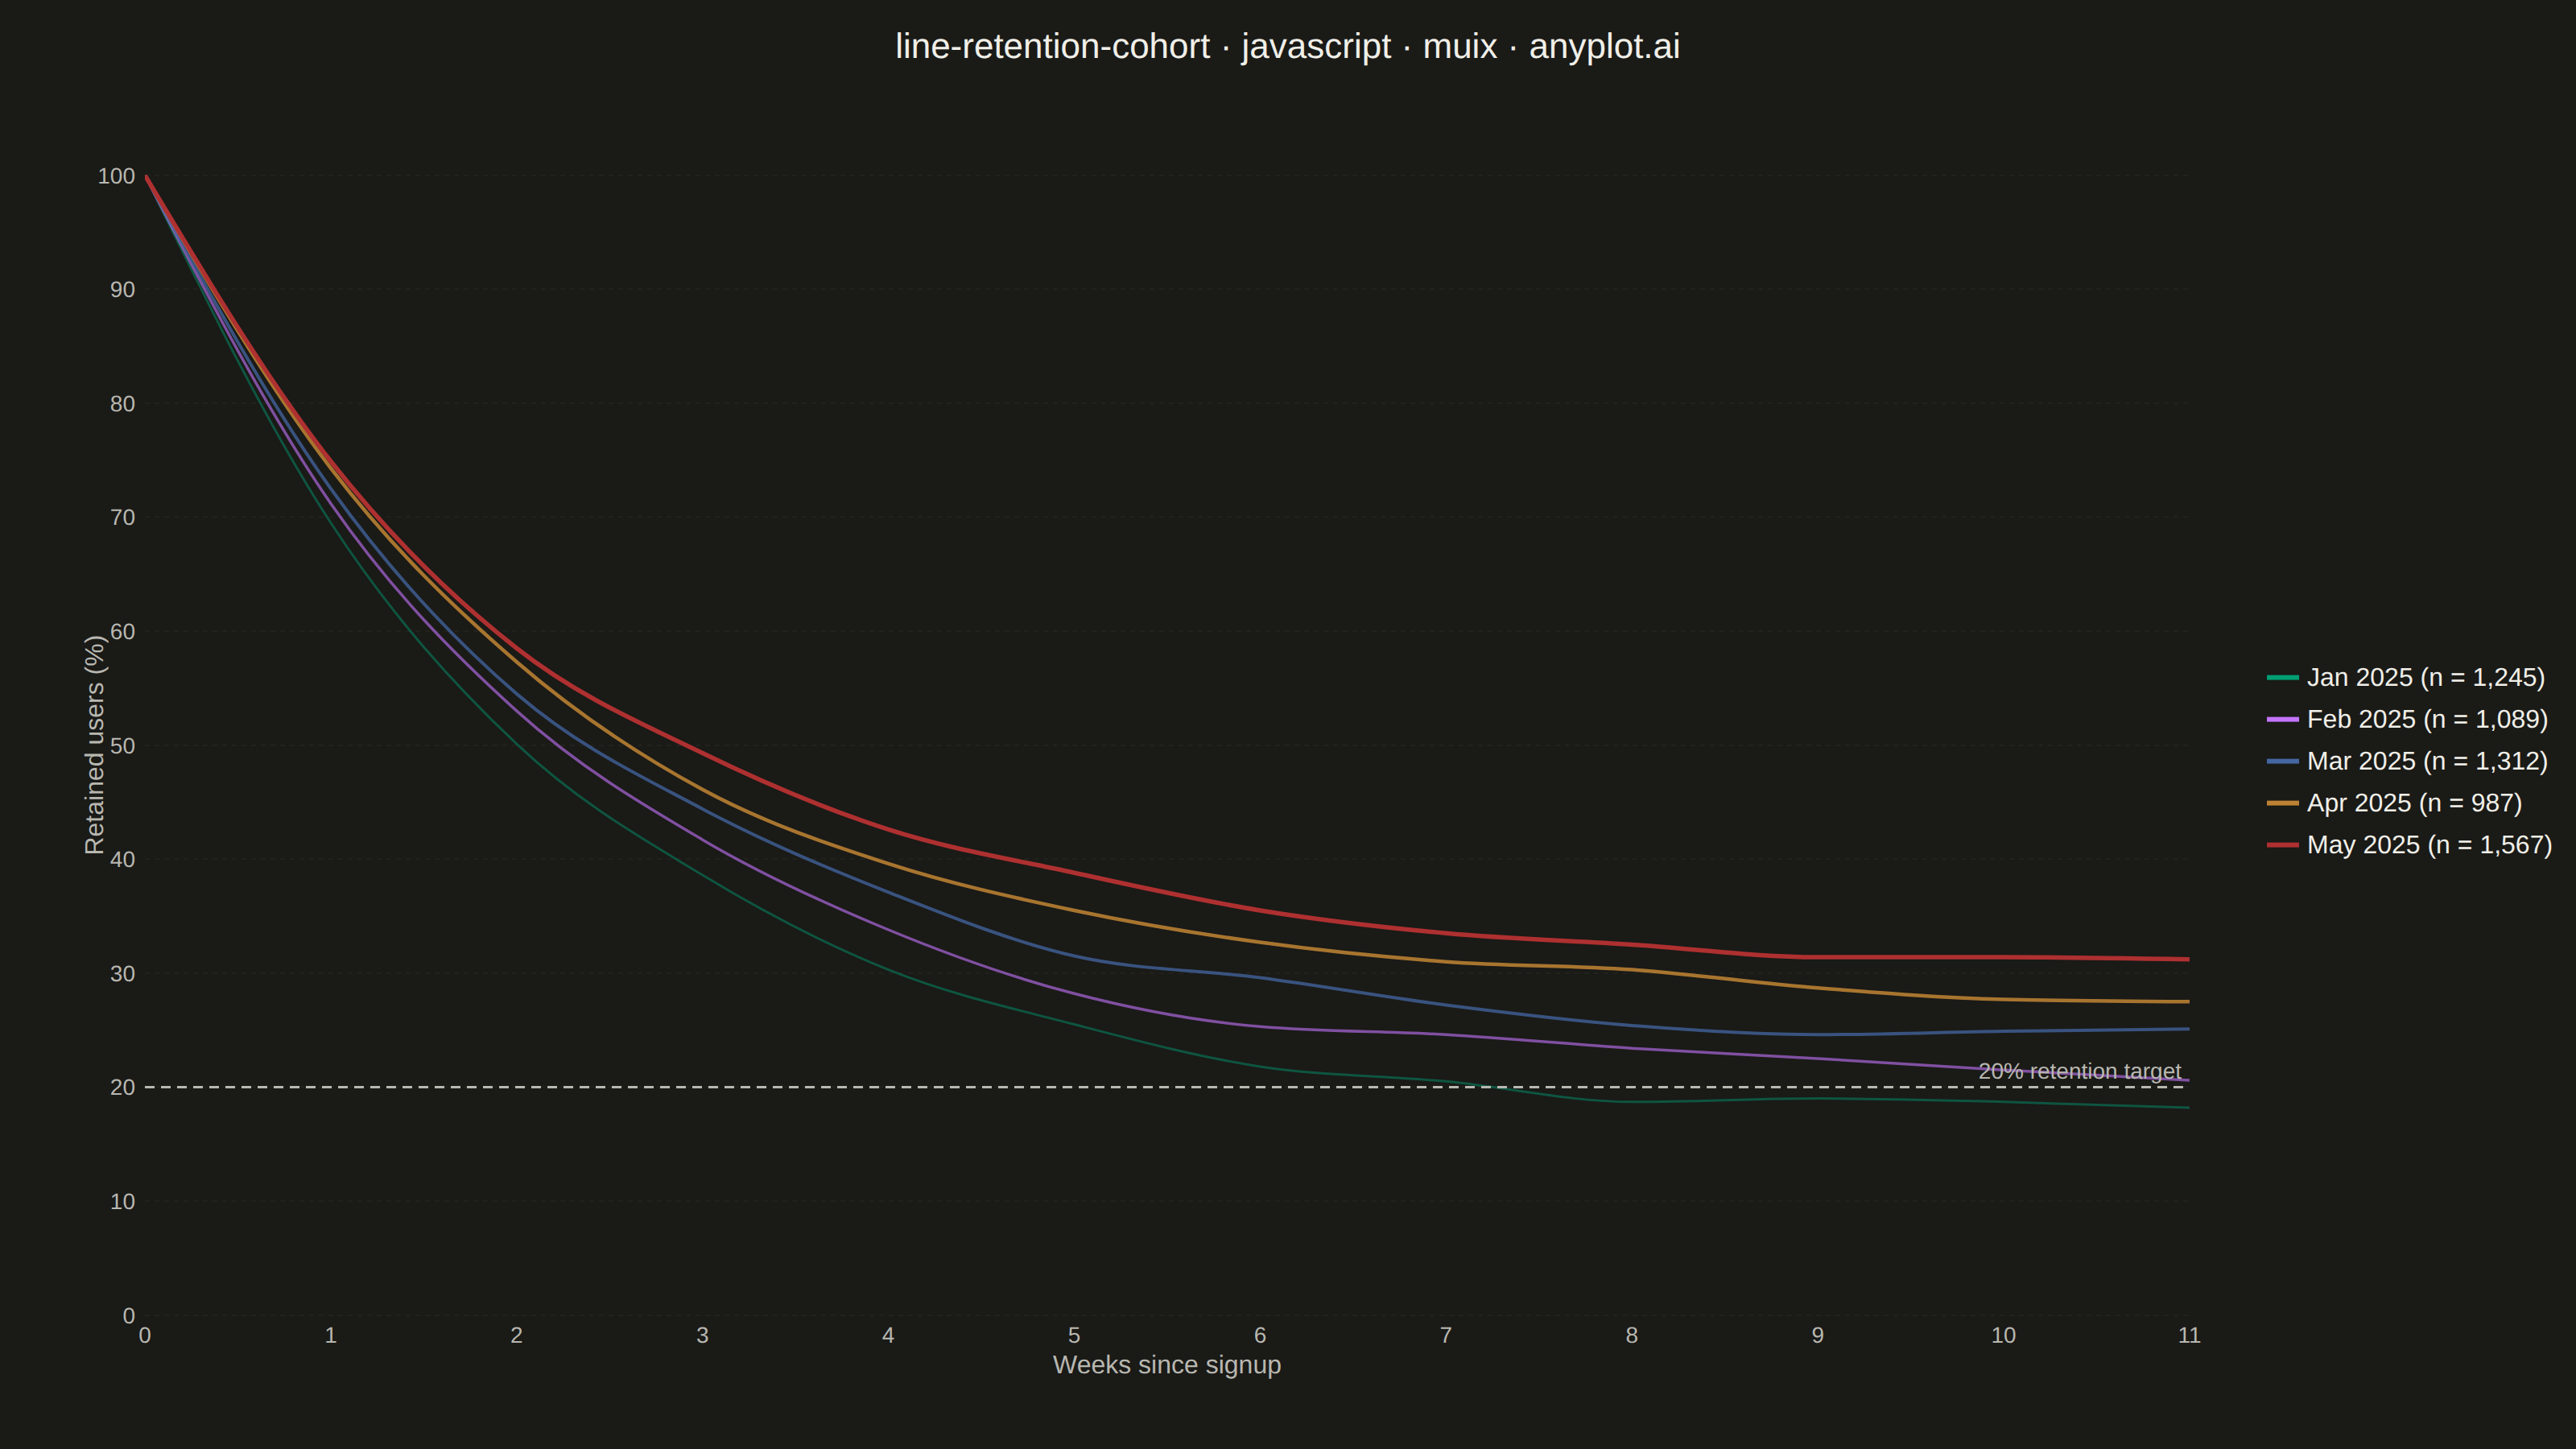
A line chart showing the percentage of retained users over time since signup, with separate curves for different cohorts. All curves start at 100% at time zero and typically exhibit exponential decay, revealing how well a product retains users over their lifecycle. By overlaying multiple cohorts, teams can visually compare whether retention is improving or degrading across signup periods.
// anyplot.ai
// line-retention-cohort: User Retention Curve by Cohort
// Library: muix 7.29.1 | JavaScript 22.22.3
// Quality: 89/100 | Created: 2026-06-20
//# anyplot-orientation: landscape
// anyplot.ai
// line-retention-cohort: User Retention Curve by Cohort
// Library: MUI X Charts | React | Node 22
// License: @mui/x-charts — MIT (community). Pro/Premium are out of scope.
// Quality: pending | Created: 2026-06-20

import Box from "@mui/material/Box";
import Typography from "@mui/material/Typography";
import { LineChart } from "@mui/x-charts/LineChart";
import { ChartsReferenceLine } from "@mui/x-charts/ChartsReferenceLine";

const t = window.ANYPLOT_TOKENS;

// Deterministic LCG — reproducible cohort noise without a seeded global RNG
function makeLcg(seed) {
  let s = seed >>> 0;
  return () => {
    s = (Math.imul(s, 1664525) + 1013904223) >>> 0;
    return s / 4294967296;
  };
}

// SaaS product: 5 monthly signup cohorts tracked weekly for 12 weeks
const COHORTS = [
  { label: "Jan 2025", size: 1245 },
  { label: "Feb 2025", size: 1089 },
  { label: "Mar 2025", size: 1312 },
  { label: "Apr 2025", size:  987 },
  { label: "May 2025", size: 1567 },
];

const WEEKS = Array.from({ length: 12 }, (_, i) => i);

// Exponential decay toward a long-term retention floor, with small realistic jitter
function buildCurve(rng, floor) {
  return WEEKS.map((w) => {
    if (w === 0) return 100;
    const smooth = floor + (100 - floor) * Math.exp(-0.45 * w);
    const jitter = (rng() - 0.5) * 1.6;
    return Math.round(Math.max(floor - 2, smooth + jitter) * 10) / 10;
  });
}

const rng = makeLcg(42);
// Newer cohorts retain better — product improving month over month
const retentionData = COHORTS.map((_, i) => buildCurve(rng, 17 + i * 3.5));

// Visual hierarchy: older cohorts fade back, newer stand out
const LINE_WIDTHS   = [1.5, 1.75, 2.0, 2.25, 2.75];
const LINE_OPACITIES = [0.45, 0.6, 0.75, 0.875, 1.0];

// Imprint palette: first series (#009E73) through position 5 via t.palette
const SERIES = COHORTS.map((c, i) => ({
  id: `cohort-${i}`,
  data: retentionData[i],
  label: `${c.label}  (n = ${c.size.toLocaleString()})`,
  color: t.palette[i],
  showMark: false,
  curve: "monotoneX",
}));

export default function Chart() {
  const { width, height } = window.ANYPLOT_SIZE;
  const titleHeight = 52;
  return (
    <Box sx={{ width, height, display: "flex", flexDirection: "column", pt: "16px" }}>
      <Typography
        sx={{
          color: t.ink,
          fontSize: 22,
          fontWeight: 500,
          textAlign: "center",
          lineHeight: 1.2,
          mb: "4px",
          fontFamily: "inherit",
        }}
      >
        line-retention-cohort · javascript · muix · anyplot.ai
      </Typography>
      <LineChart
        width={width}
        height={height - titleHeight}
        skipAnimation
        series={SERIES}
        xAxis={[{
          data: WEEKS,
          label: "Weeks since signup",
          tickMinStep: 1,
          labelStyle: { fontSize: 16, fill: t.inkSoft },
          tickLabelStyle: { fontSize: 14, fill: t.inkSoft },
          disableLine: true,
          disableTicks: true,
        }]}
        yAxis={[{
          min: 0,
          max: 100,
          label: "Retained users (%)",
          labelStyle: { fontSize: 16, fill: t.inkSoft },
          tickLabelStyle: { fontSize: 14, fill: t.inkSoft },
          tickMinStep: 10,
          disableLine: true,
          disableTicks: true,
        }]}
        grid={{ horizontal: true }}
        margin={{ top: 60, right: 240, bottom: 80, left: 90 }}
        sx={{
          "& .MuiLineElement-series-cohort-0": { strokeWidth: LINE_WIDTHS[0], opacity: LINE_OPACITIES[0] },
          "& .MuiLineElement-series-cohort-1": { strokeWidth: LINE_WIDTHS[1], opacity: LINE_OPACITIES[1] },
          "& .MuiLineElement-series-cohort-2": { strokeWidth: LINE_WIDTHS[2], opacity: LINE_OPACITIES[2] },
          "& .MuiLineElement-series-cohort-3": { strokeWidth: LINE_WIDTHS[3], opacity: LINE_OPACITIES[3] },
          "& .MuiLineElement-series-cohort-4": { strokeWidth: LINE_WIDTHS[4], opacity: LINE_OPACITIES[4] },
          "& .MuiChartsGrid-line": { opacity: 0.22, strokeDasharray: "3 3" },
        }}
        slotProps={{
          legend: {
            position: { vertical: "middle", horizontal: "right" },
            direction: "column",
            padding: { left: 16, top: 0 },
            itemMarkWidth: 20,
            itemMarkHeight: 3,
          },
        }}
      >
        <ChartsReferenceLine
          y={20}
          label="20% retention target"
          lineStyle={{ stroke: t.inkSoft, strokeDasharray: "6 4", strokeWidth: 1.5 }}
          labelStyle={{ fill: t.inkSoft, fontSize: 14 }}
          labelAlign="end"
        />
      </LineChart>
    </Box>
  );
}
Runnable source as JSON, for any HTTP client: https://api.anyplot.ai/specs/line-retention-cohort/muix/code. Any spec id and library id listed in llms-full.txt fit the same URL shape; every URL below is complete and callable.
{
  "spec_id": "line-retention-cohort",
  "language": "javascript",
  "library": "muix",
  "page": "https://anyplot.ai/line-retention-cohort/javascript/muix",
  "hub": "https://anyplot.ai/line-retention-cohort",
  "code_json": "https://api.anyplot.ai/specs/line-retention-cohort/muix/code",
  "spec_json": "https://api.anyplot.ai/specs/line-retention-cohort",
  "render_light_png": "https://storage.googleapis.com/anyplot-images/plots/line-retention-cohort/javascript/muix/plot-light.png",
  "render_dark_png": "https://storage.googleapis.com/anyplot-images/plots/line-retention-cohort/javascript/muix/plot-dark.png",
  "interactive_light_html": "https://storage.googleapis.com/anyplot-images/plots/line-retention-cohort/javascript/muix/plot-light.html",
  "interactive_dark_html": "https://storage.googleapis.com/anyplot-images/plots/line-retention-cohort/javascript/muix/plot-dark.html",
  "quality_score": 89.0,
  "license": "MIT",
  "guide": "https://anyplot.ai/llms.txt"
}
Part of User Retention Curve by Cohort on anyplot.ai.