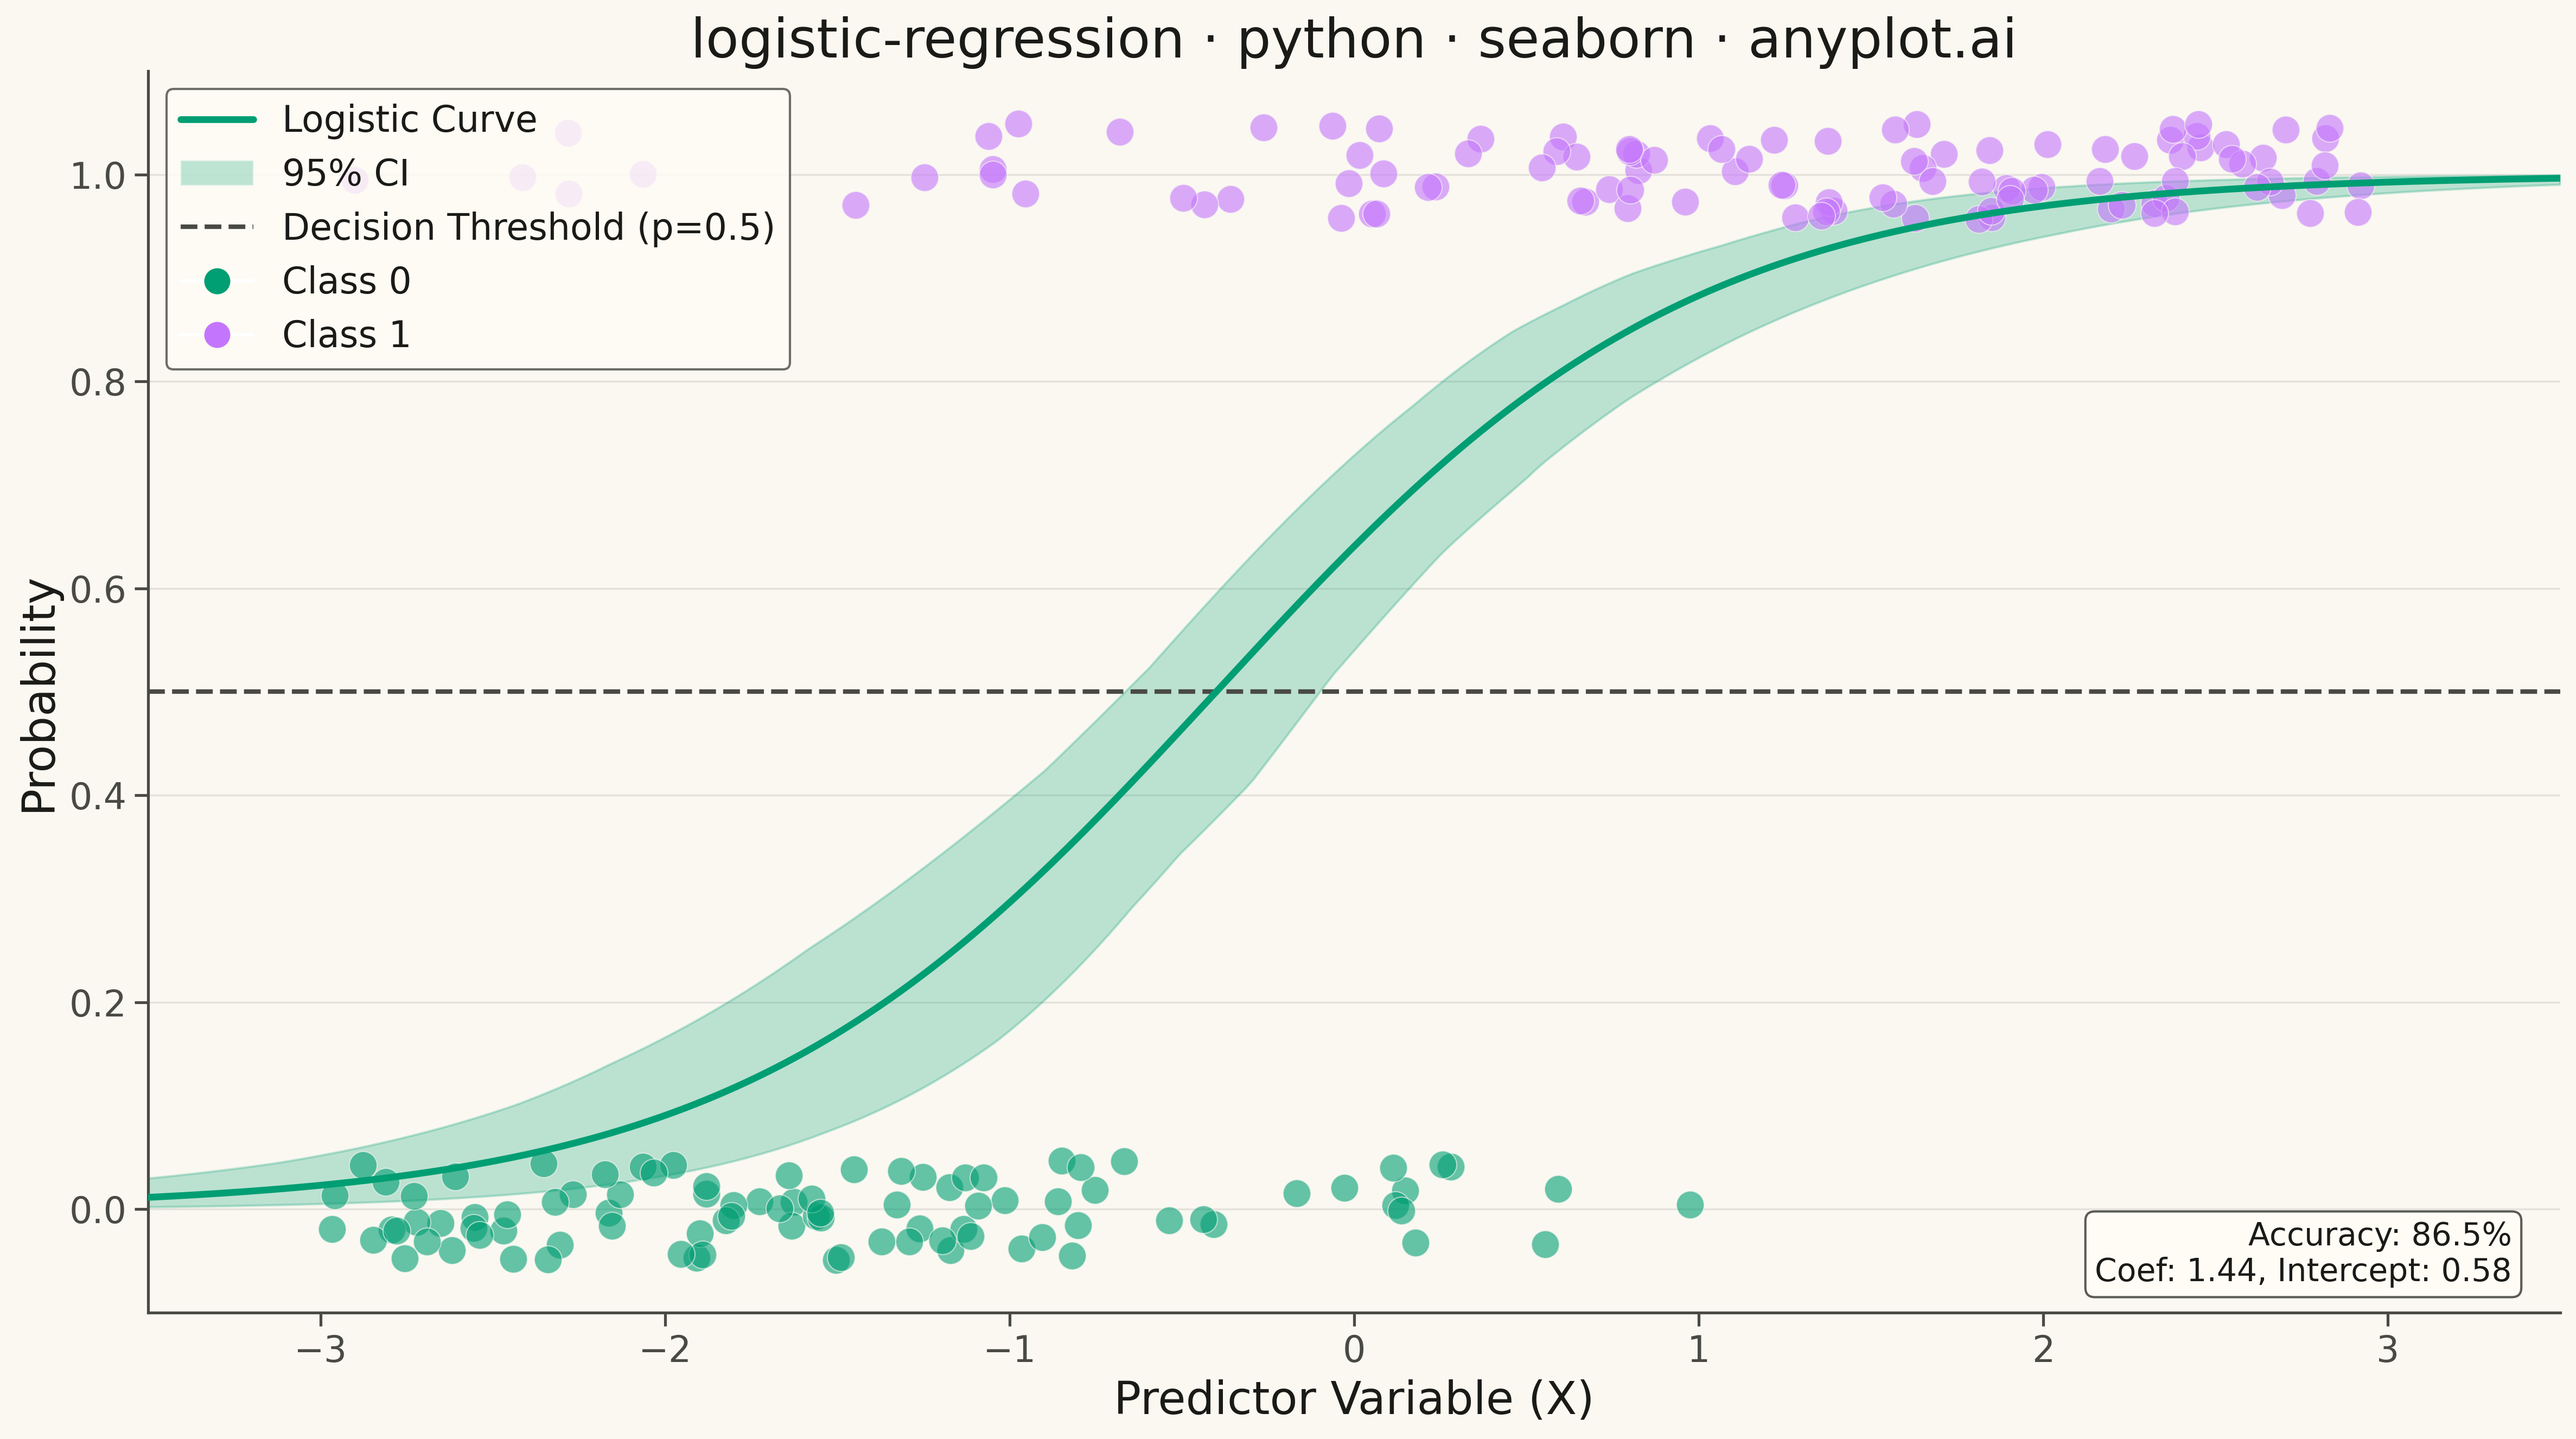
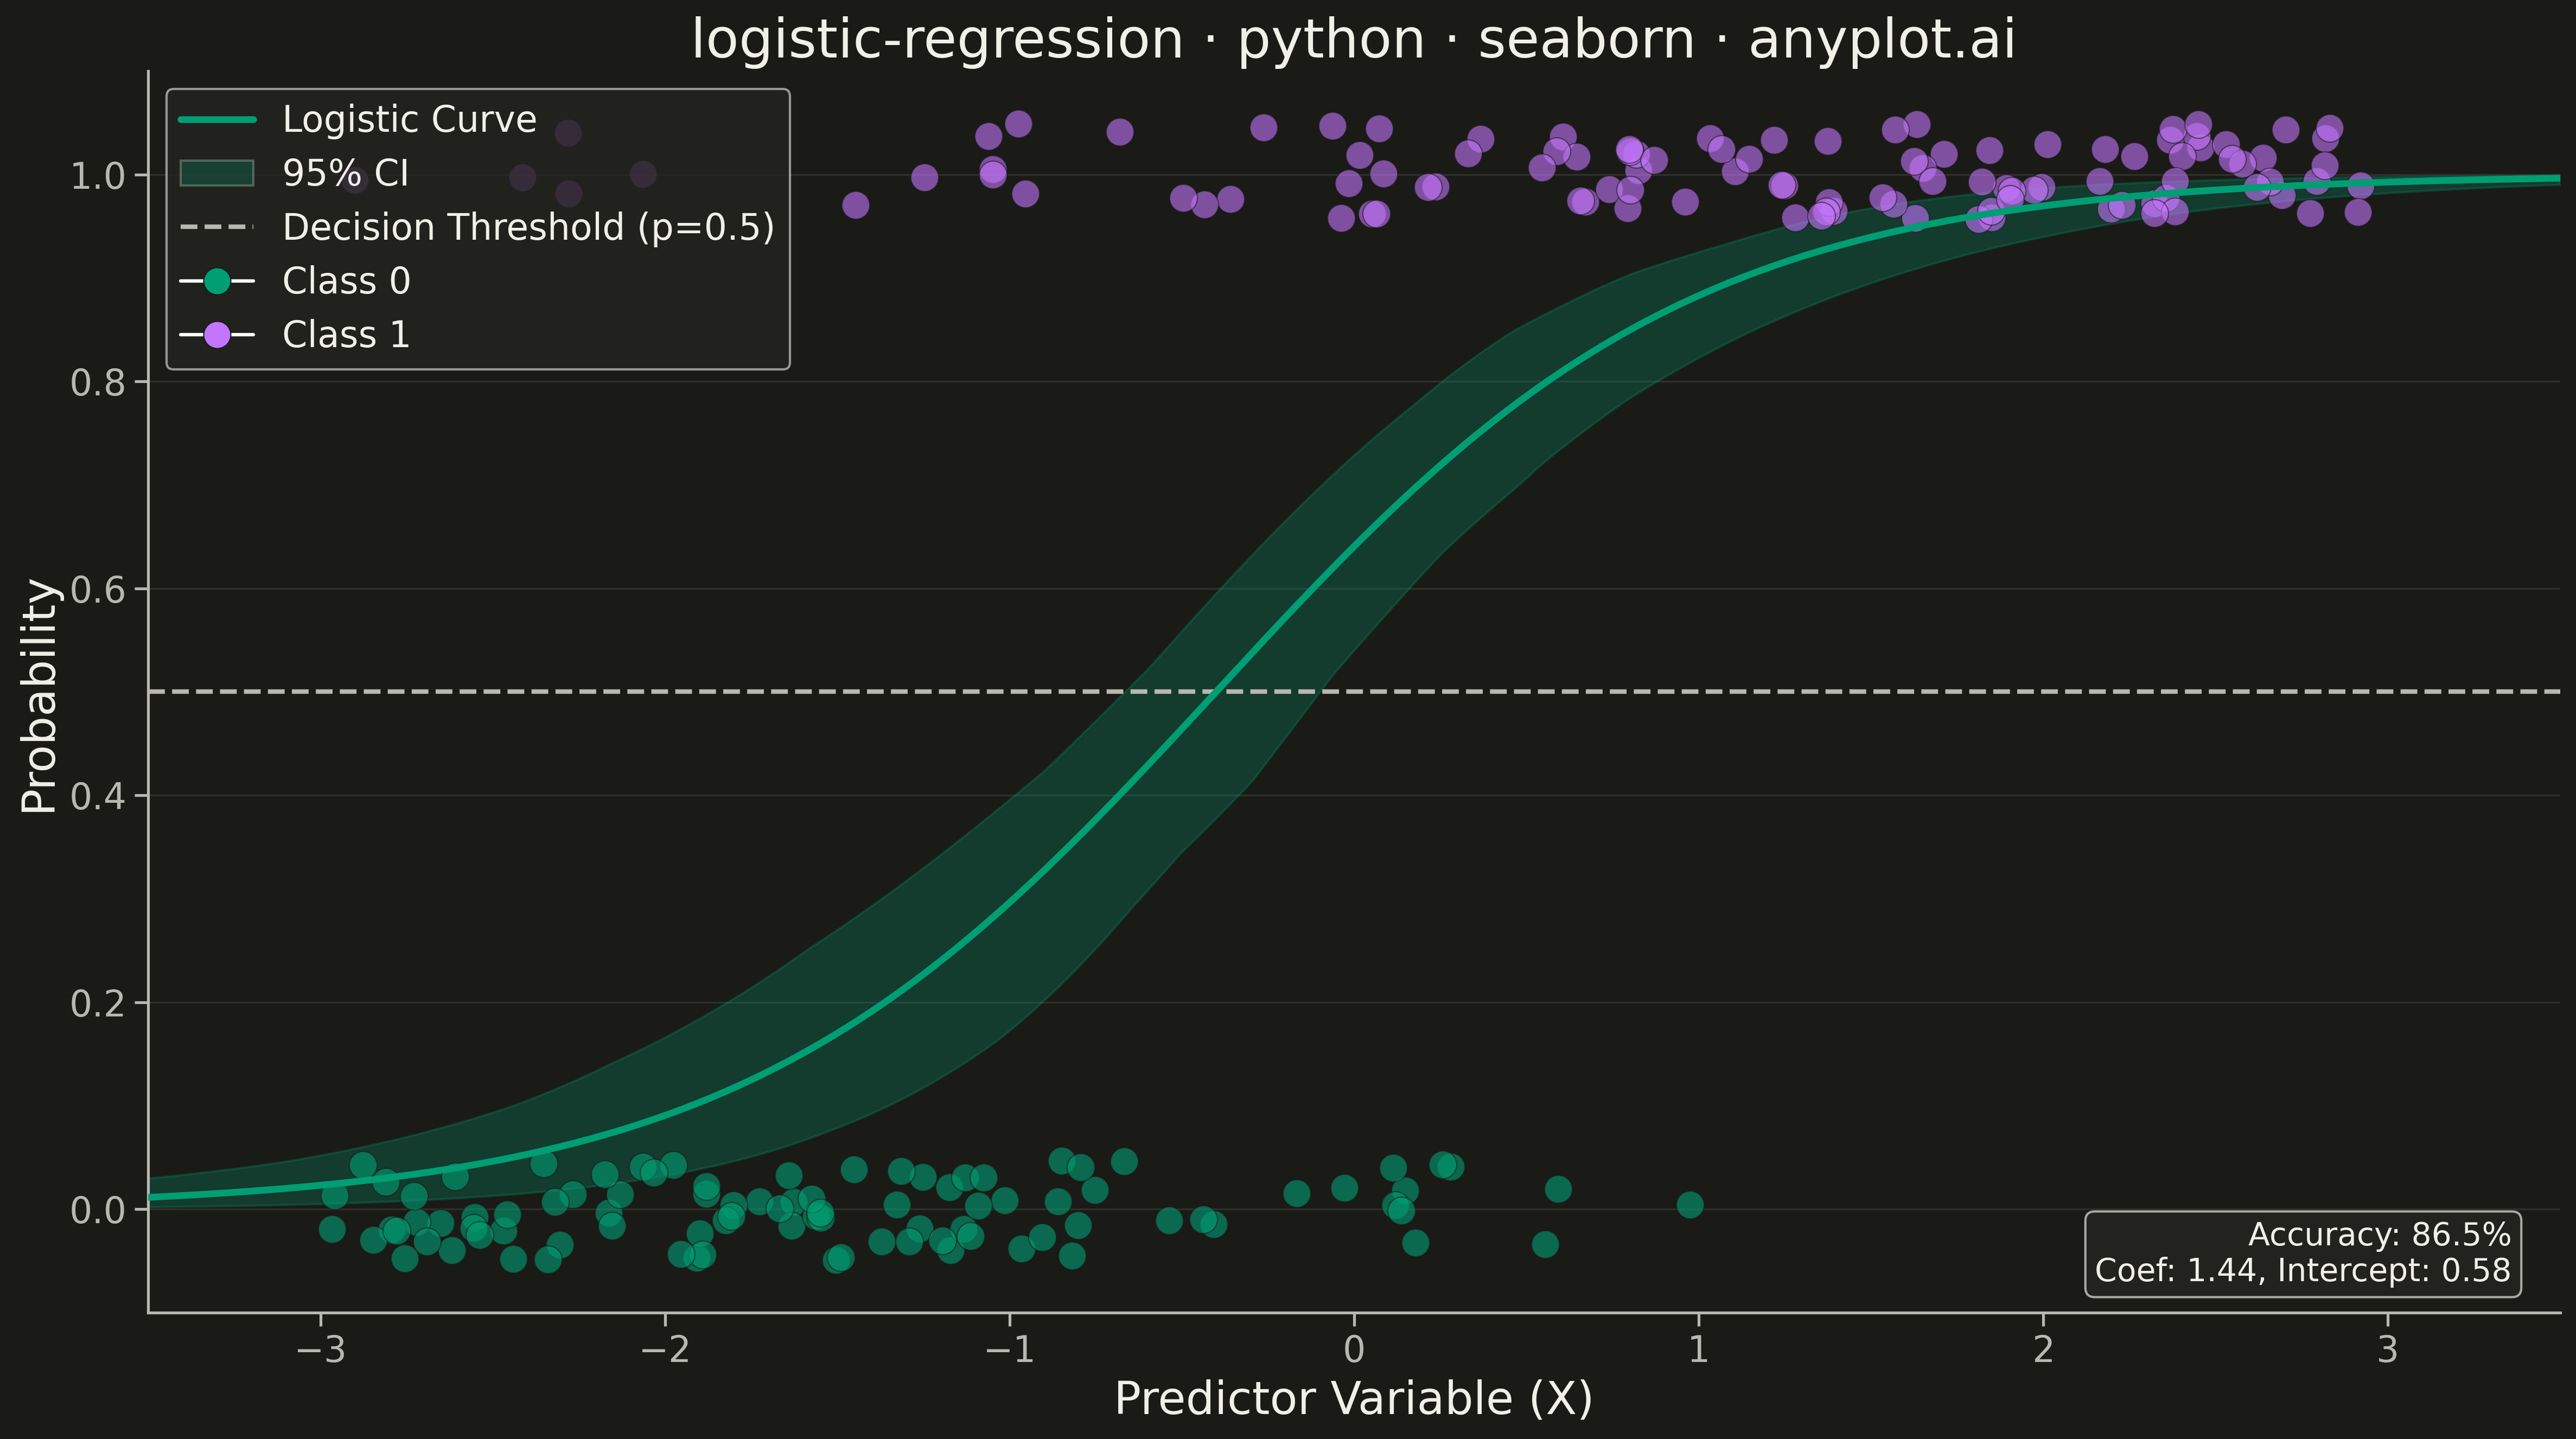
A logistic regression visualization showing the characteristic S-shaped (sigmoid) probability curve for binary classification. The plot displays data points colored by their binary class, the fitted logistic curve representing predicted probabilities, confidence intervals around the curve, and an optional decision threshold line. This visualization is essential for understanding how a logistic model maps continuous input features to class probabilities.
Preview render from the Seaborn implementation.