The same plot in 14 other libraries — JavaScript: D3.js, Apache ECharts, Highcharts, MUI X Charts; Python: Altair, Bokeh, lets-plot, Matplotlib, Plotly, plotnine, Pygal, Seaborn; R: ggplot2; Julia: Makie.jl. Compare all 15 side by side: Logistic Regression Curve Plot in Python, R, Julia and JavaScript.
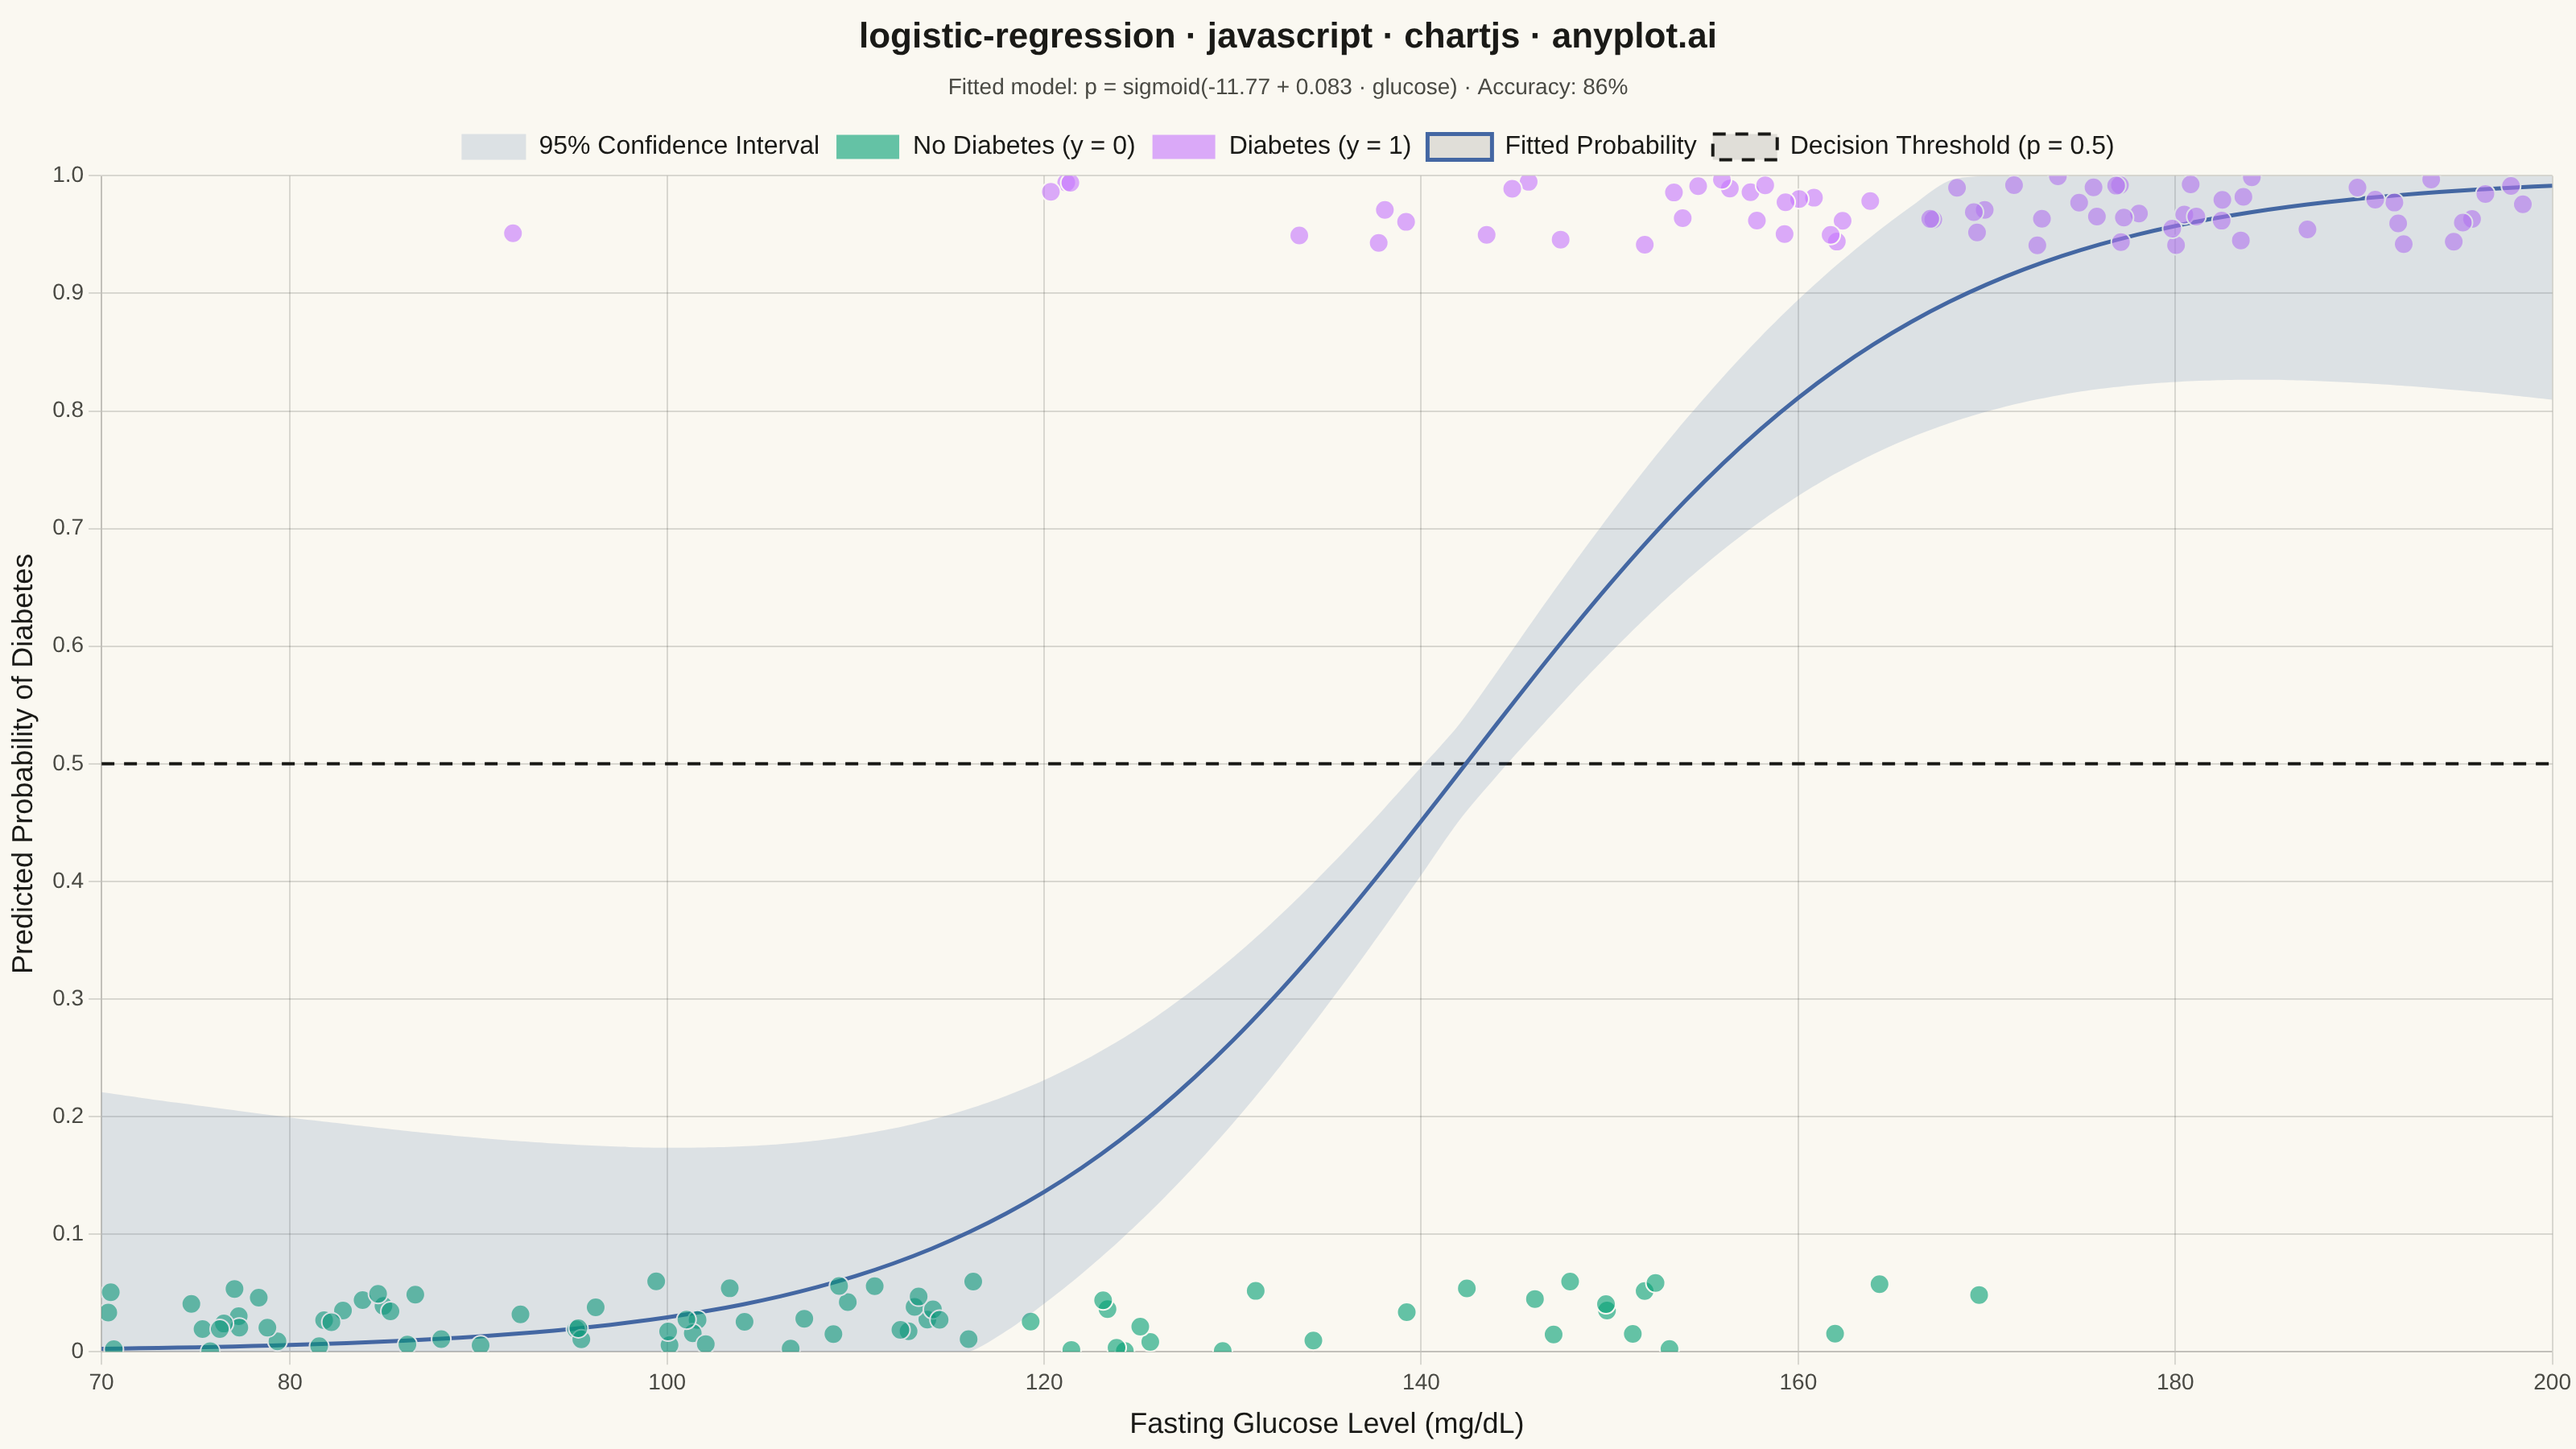
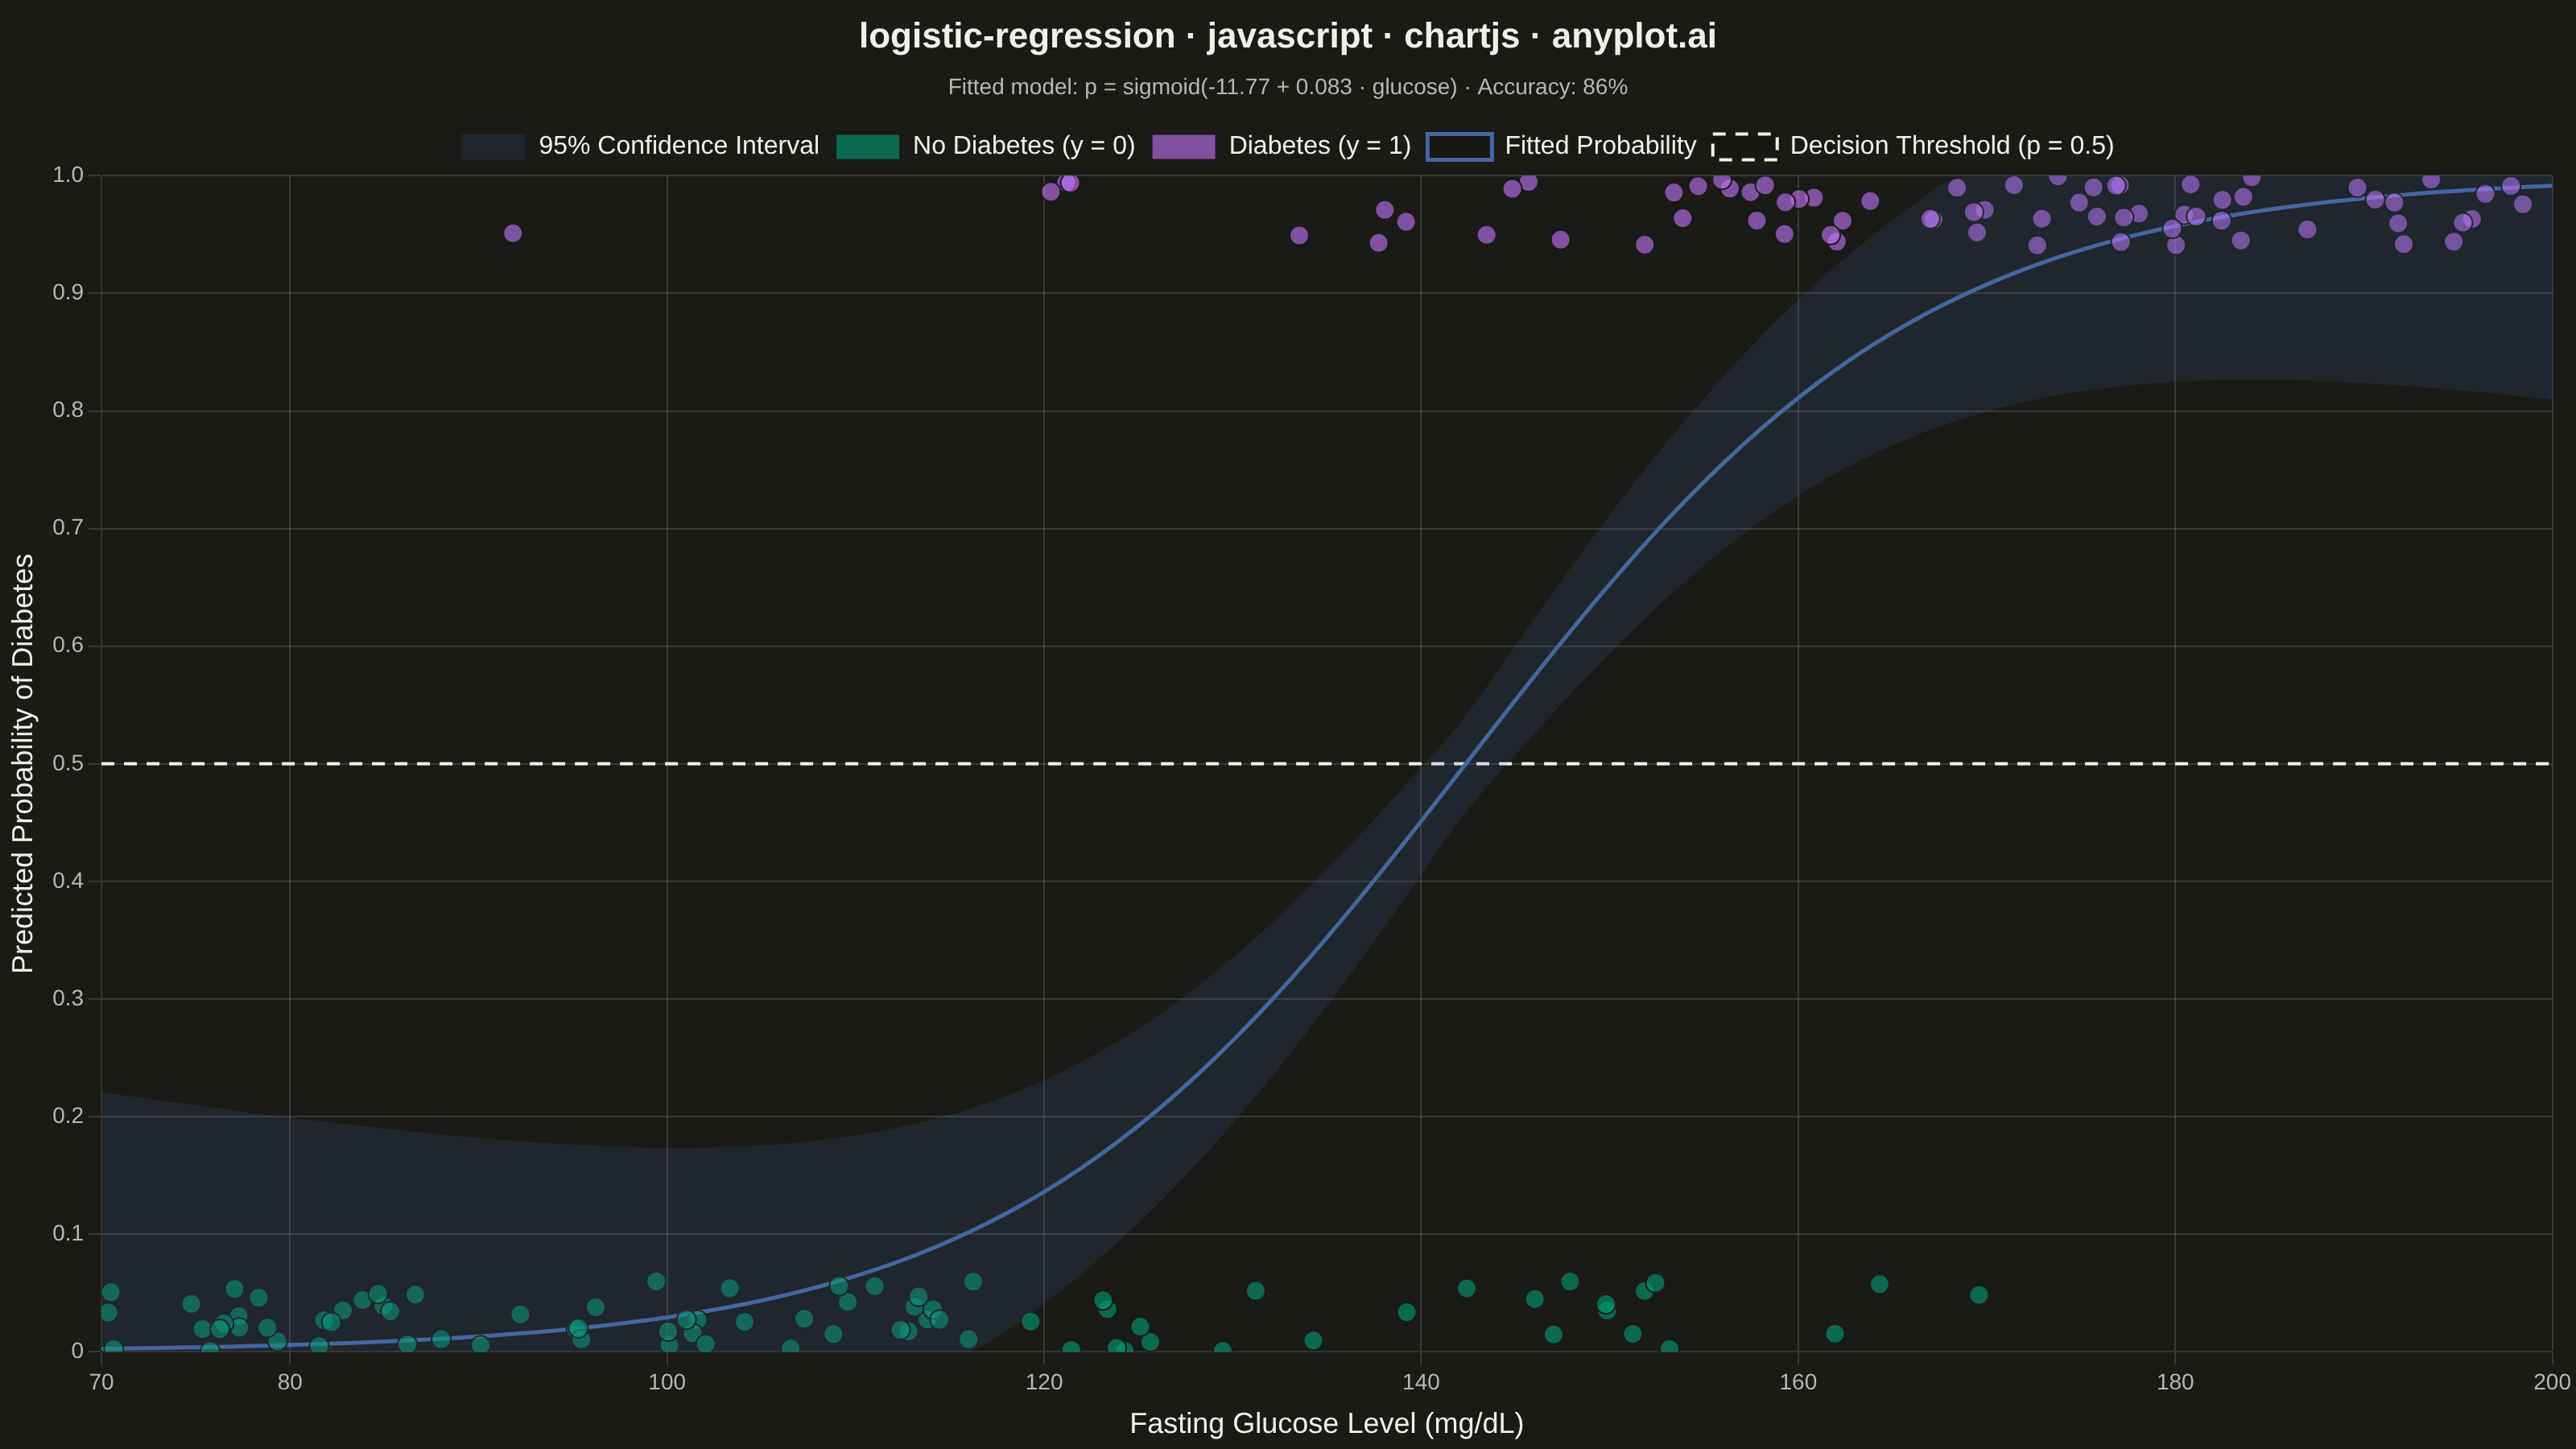
A logistic regression visualization showing the characteristic S-shaped (sigmoid) probability curve for binary classification. The plot displays data points colored by their binary class, the fitted logistic curve representing predicted probabilities, confidence intervals around the curve, and a dashed decision threshold line at probability 0.5. This visualization is essential for understanding how a logistic model maps continuous input features to class probabilities.
// anyplot.ai
// logistic-regression: Logistic Regression Curve Plot
// Library: chartjs 4.4.7 | JavaScript 22.23.2
// Quality: 93/100 | Created: 2026-09-02

const t = window.ANYPLOT_TOKENS;

// --- Data (in-memory, deterministic fixed-seed LCG) -------------------------
let seed = 42;
function rand() {
  seed = (seed * 1103515245 + 12345) & 0x7fffffff;
  return seed / 0x7fffffff;
}

const MIDPOINT = 140; // fasting glucose level (mg/dL) at 50% predicted probability
const SLOPE = 0.08;
const X_MIN = 70;
const X_MAX = 200;

function sigmoid(x) {
  return 1 / (1 + Math.exp(-SLOPE * (x - MIDPOINT)));
}

const classZero = [];
const classOne = [];
const samples = [];
const n = 150;
for (let i = 0; i < n; i++) {
  const glucose = X_MIN + rand() * (X_MAX - X_MIN);
  const trueProbability = sigmoid(glucose);
  const label = rand() < trueProbability ? 1 : 0;
  samples.push({ x: glucose, label });
  if (label === 1) {
    classOne.push({ x: glucose, y: 0.94 + rand() * 0.06 });
  } else {
    classZero.push({ x: glucose, y: rand() * 0.06 });
  }
}

// --- Fit: gradient-descent logistic regression on the plotted points -------
// (fit on standardized x for stable convergence, then rescale coefficients
// back to the original glucose units)
function fitLogisticRegression(points) {
  const xMean = points.reduce((sum, p) => sum + p.x, 0) / points.length;
  const xStd = Math.sqrt(points.reduce((sum, p) => sum + (p.x - xMean) ** 2, 0) / points.length);

  let b0 = 0;
  let b1 = 0;
  const learningRate = 0.5;
  const epochs = 1500;
  for (let epoch = 0; epoch < epochs; epoch++) {
    let grad0 = 0;
    let grad1 = 0;
    for (const p of points) {
      const xStd_ = (p.x - xMean) / xStd;
      const pred = 1 / (1 + Math.exp(-(b0 + b1 * xStd_)));
      const err = pred - p.label;
      grad0 += err;
      grad1 += err * xStd_;
    }
    b0 -= (learningRate * grad0) / points.length;
    b1 -= (learningRate * grad1) / points.length;
  }

  const slope = b1 / xStd;
  const intercept = b0 - (b1 * xMean) / xStd;
  return { slope, intercept };
}

const fit = fitLogisticRegression(samples);
function fittedSigmoid(x) {
  return 1 / (1 + Math.exp(-(fit.intercept + fit.slope * x)));
}

const correct = samples.filter((p) => (fittedSigmoid(p.x) >= 0.5 ? 1 : 0) === p.label).length;
const accuracyPct = Math.round((100 * correct) / samples.length);
const fittedMidpoint = -fit.intercept / fit.slope;

const curvePoints = [];
const bandUpperPoints = [];
const bandLowerPoints = [];
const halfRange = (X_MAX - X_MIN) / 2;
for (let glucose = X_MIN; glucose <= X_MAX; glucose += 2) {
  const p = fittedSigmoid(glucose);
  const width = 0.04 + 0.16 * (Math.abs(glucose - fittedMidpoint) / halfRange);
  curvePoints.push({ x: glucose, y: p });
  bandUpperPoints.push({ x: glucose, y: Math.min(1, p + width) });
  bandLowerPoints.push({ x: glucose, y: Math.max(0, p - width) });
}

const thresholdPoints = [
  { x: X_MIN, y: 0.5 },
  { x: X_MAX, y: 0.5 },
];

// --- Helpers -----------------------------------------------------------------
function hexToRgba(hex, alpha) {
  const r = parseInt(hex.slice(1, 3), 16);
  const g = parseInt(hex.slice(3, 5), 16);
  const b = parseInt(hex.slice(5, 7), 16);
  return `rgba(${r}, ${g}, ${b}, ${alpha})`;
}

const curveColor = t.palette[2]; // #4467A3 blue — the fitted model, distinct from class colors

// --- Mount ---------------------------------------------------------------
const canvas = document.createElement("canvas");
document.getElementById("container").appendChild(canvas);

// --- Chart -----------------------------------------------------------------
new Chart(canvas, {
  type: "scatter",
  data: {
    datasets: [
      {
        type: "line",
        data: bandUpperPoints,
        borderWidth: 0,
        pointRadius: 0,
        fill: false,
        tension: 0.3,
      },
      {
        type: "line",
        label: "95% Confidence Interval",
        data: bandLowerPoints,
        borderWidth: 0,
        pointRadius: 0,
        fill: 0,
        backgroundColor: hexToRgba(curveColor, 0.16),
        tension: 0.3,
      },
      {
        type: "scatter",
        label: "No Diabetes (y = 0)",
        data: classZero,
        backgroundColor: hexToRgba(t.palette[0], 0.6),
        borderColor: t.pageBg,
        borderWidth: 1,
        pointRadius: 6,
      },
      {
        type: "scatter",
        label: "Diabetes (y = 1)",
        data: classOne,
        backgroundColor: hexToRgba(t.palette[1], 0.6),
        borderColor: t.pageBg,
        borderWidth: 1,
        pointRadius: 6,
      },
      {
        type: "line",
        label: "Fitted Probability",
        data: curvePoints,
        borderColor: curveColor,
        borderWidth: 2.5,
        pointRadius: 0,
        fill: false,
        tension: 0.3,
      },
      {
        type: "line",
        label: "Decision Threshold (p = 0.5)",
        data: thresholdPoints,
        borderColor: t.ink,
        borderWidth: 2,
        borderDash: [8, 6],
        pointRadius: 0,
        fill: false,
      },
    ],
  },
  options: {
    responsive: true,
    maintainAspectRatio: false,
    animation: false,
    plugins: {
      title: {
        display: true,
        text: "logistic-regression · javascript · chartjs · anyplot.ai",
        color: t.ink,
        font: { size: 22 },
      },
      subtitle: {
        display: true,
        text: `Fitted model: p = sigmoid(${fit.intercept.toFixed(2)} + ${fit.slope.toFixed(3)} · glucose) · Accuracy: ${accuracyPct}%`,
        color: t.inkSoft,
        font: { size: 14 },
        padding: { bottom: 10 },
      },
      legend: {
        labels: {
          color: t.ink,
          font: { size: 16 },
          filter: (legendItem) => legendItem.text !== undefined,
        },
      },
    },
    scales: {
      x: {
        type: "linear",
        min: X_MIN,
        max: X_MAX,
        ticks: { color: t.inkSoft, font: { size: 14 } },
        grid: { color: t.grid },
        title: { display: true, text: "Fasting Glucose Level (mg/dL)", color: t.ink, font: { size: 18 } },
      },
      y: {
        min: 0,
        max: 1,
        ticks: { color: t.inkSoft, font: { size: 14 } },
        grid: { color: t.grid },
        title: { display: true, text: "Predicted Probability of Diabetes", color: t.ink, font: { size: 18 } },
      },
    },
  },
});
Runnable source as JSON, for any HTTP client: https://api.anyplot.ai/specs/logistic-regression/chartjs/code. Any spec id and library id listed in llms-full.txt fit the same URL shape; every URL below is complete and callable.
{
  "spec_id": "logistic-regression",
  "language": "javascript",
  "library": "chartjs",
  "page": "https://anyplot.ai/logistic-regression/javascript/chartjs",
  "hub": "https://anyplot.ai/logistic-regression",
  "code_json": "https://api.anyplot.ai/specs/logistic-regression/chartjs/code",
  "spec_json": "https://api.anyplot.ai/specs/logistic-regression",
  "render_light_png": "https://storage.googleapis.com/anyplot-images/plots/logistic-regression/javascript/chartjs/plot-light.png",
  "render_dark_png": "https://storage.googleapis.com/anyplot-images/plots/logistic-regression/javascript/chartjs/plot-dark.png",
  "interactive_light_html": "https://storage.googleapis.com/anyplot-images/plots/logistic-regression/javascript/chartjs/plot-light.html",
  "interactive_dark_html": "https://storage.googleapis.com/anyplot-images/plots/logistic-regression/javascript/chartjs/plot-dark.html",
  "quality_score": 93.0,
  "license": "MIT",
  "guide": "https://anyplot.ai/llms.txt"
}
Part of Logistic Regression Curve Plot on anyplot.ai.