The same plot in 14 other libraries — JavaScript: Chart.js, D3.js, Highcharts, MUI X Charts; Python: Altair, Bokeh, lets-plot, Matplotlib, Plotly, plotnine, Pygal, Seaborn; R: ggplot2; Julia: Makie.jl. Compare all 15 side by side: MA Plot for Differential Expression in Python, R, Julia and JavaScript.
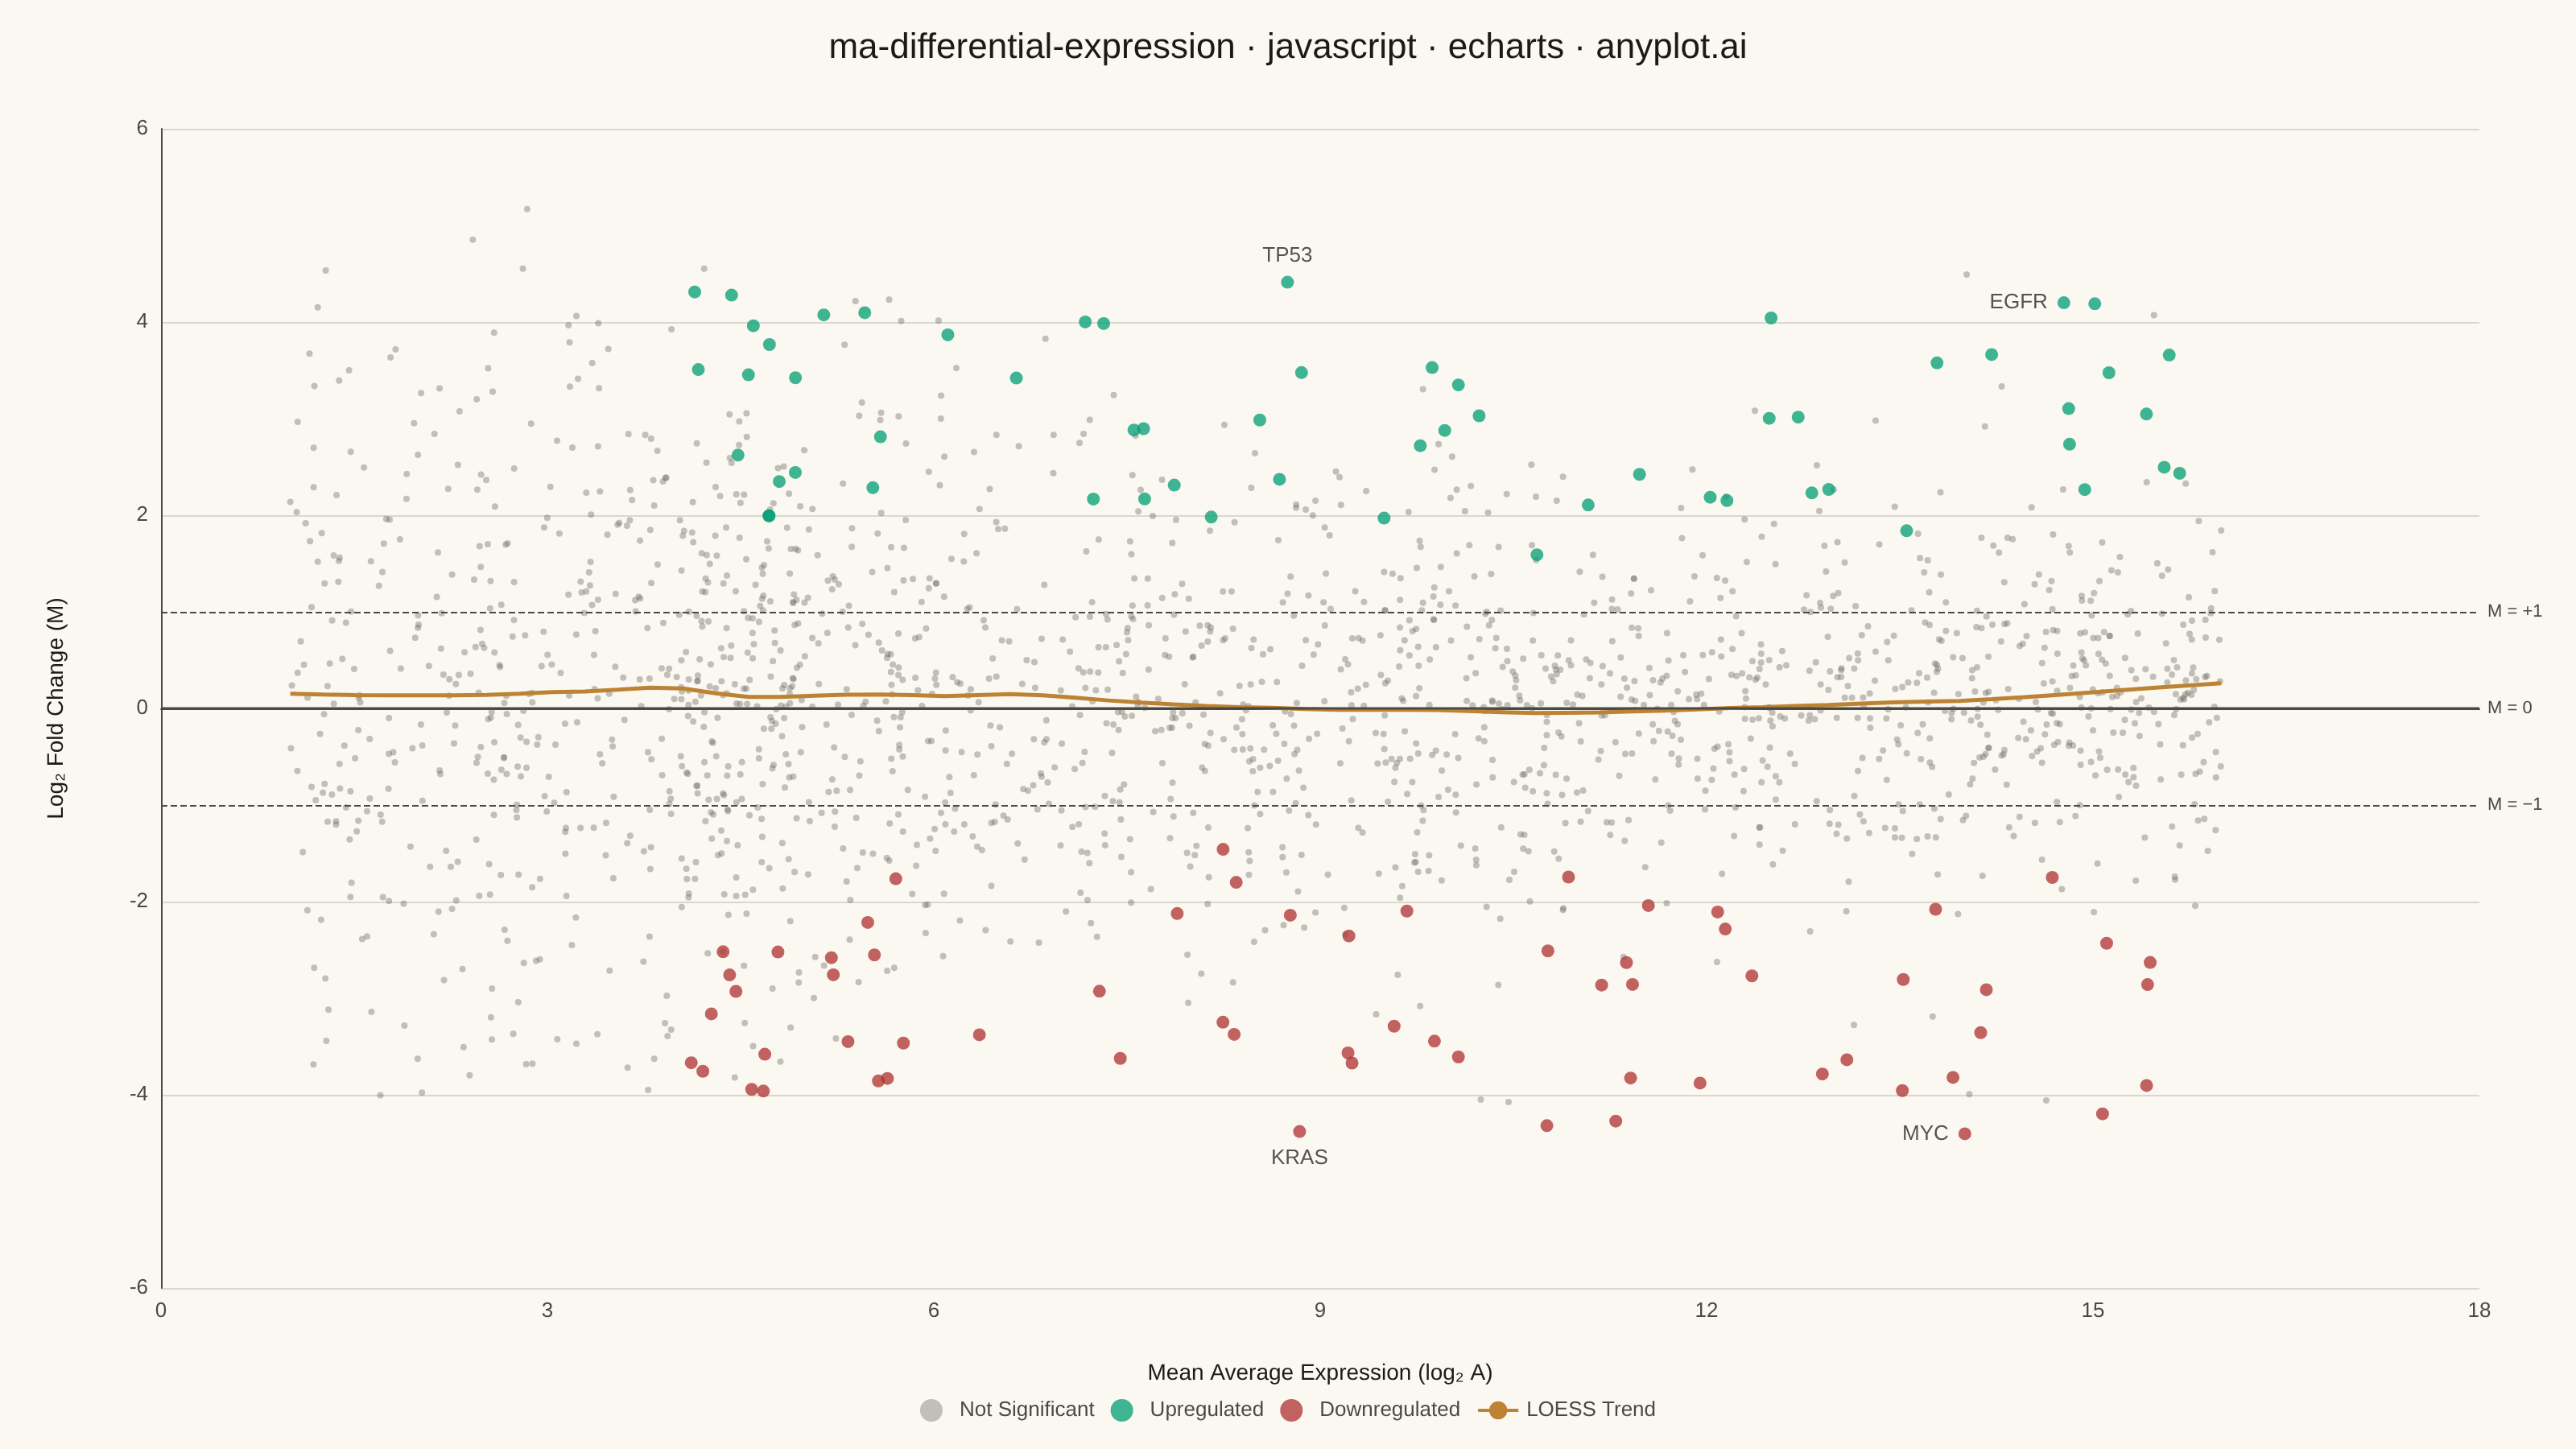
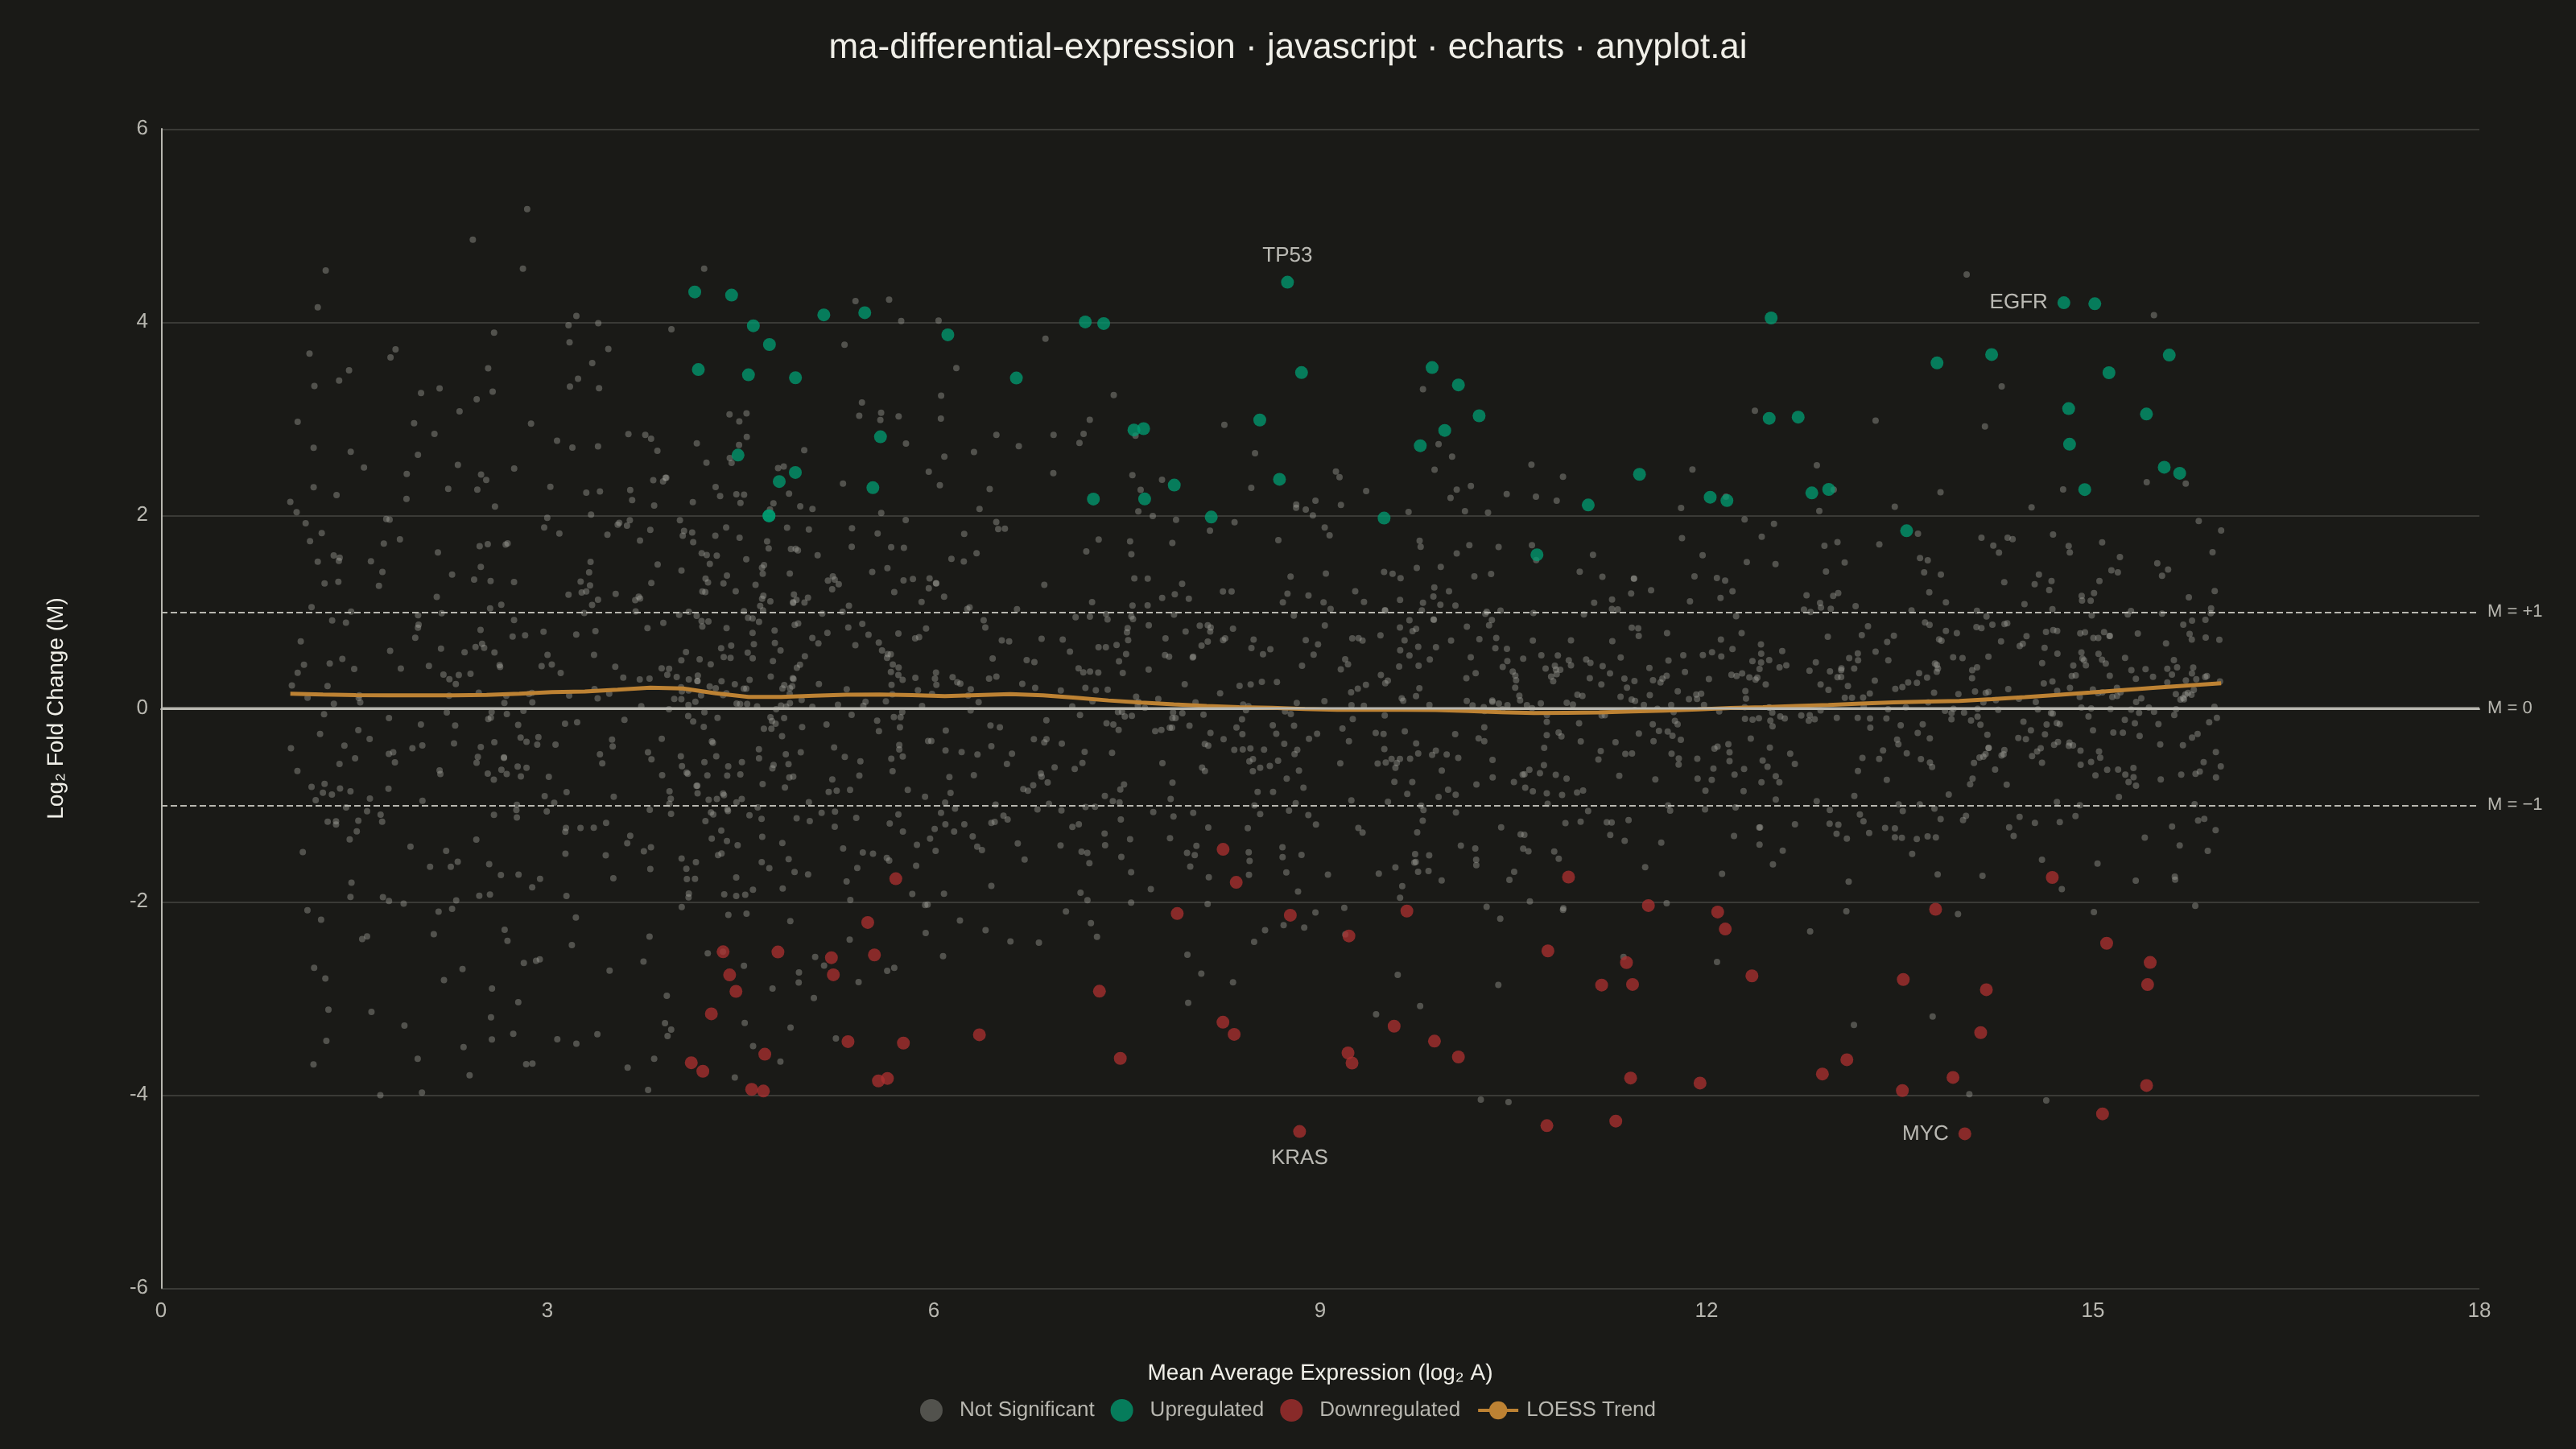
An MA plot (M-versus-A plot) visualizes the relationship between log fold change (M) and mean average expression (A) when comparing two experimental conditions. Each point represents a gene or feature, with significantly differentially expressed genes highlighted. This plot is a standard diagnostic tool in RNA-seq and microarray analysis for assessing differential expression results and detecting systematic expression-dependent bias.
// anyplot.ai
// ma-differential-expression: MA Plot for Differential Expression
// Library: echarts 5.5.1 | JavaScript 22.22.3
// Quality: 83/100 | Created: 2026-06-21

const t = window.ANYPLOT_TOKENS;

// LCG RNG (seed 42) — deterministic, no Math.random seeding in browser
let _s = 42;
function rand() { _s = (_s * 1664525 + 1013904223) >>> 0; return _s / 4294967296; }
function randn() { return Math.sqrt(-2 * Math.log(rand() || 1e-15)) * Math.cos(2 * Math.PI * rand()); }

// Data — RNA-seq drug treatment vs. control, cancer cell line (n=2000 genes)
const N = 2000;
const GENE_NAMES = ['TP53', 'EGFR', 'KRAS', 'MYC', 'BRCA1', 'MDM2', 'CDK4', 'PTEN', 'RB1', 'VEGFA'];
const meanArr = [], lfcArr = [], sigArr = [];

for (let i = 0; i < N; i++) {
  // A: mean average expression (log2), bimodal — some lowly-expressed genes
  const a = rand() < 0.25 ? 1 + rand() * 4 : 4 + rand() * 12;
  // M: LFC with expression-dependent variance + subtle low-expression bias
  const sigma = 2.0 / (1 + a * 0.08);
  const bias  = 0.35 * Math.exp(-a * 0.25);
  const isDE  = rand() < 0.10;
  const dir   = rand() < 0.5 ? 1 : -1;
  const m     = isDE
    ? dir * (1.8 + rand() * 2.5) + randn() * 0.25 + bias
    : randn() * sigma + bias;
  // Significance: DE genes at adequate expression with |LFC| > 1
  const sig = isDE && a > 4 && Math.abs(m) > 1.0 && rand() < 0.80;
  meanArr.push(a); lfcArr.push(m); sigArr.push(sig);
}

// Select 1 top gene per spatial quadrant to eliminate label collision
const sigIdx = sigArr.map((s, i) => s ? i : -1).filter(i => i >= 0);
const sigAVals = sigIdx.map(i => meanArr[i]).sort((a, b) => a - b);
const medA = sigAVals[Math.floor(sigAVals.length / 2)];

const quads = [
  i => lfcArr[i] > 0 && meanArr[i] < medA,   // upper-left
  i => lfcArr[i] > 0 && meanArr[i] >= medA,  // upper-right
  i => lfcArr[i] < 0 && meanArr[i] < medA,   // lower-left
  i => lfcArr[i] < 0 && meanArr[i] >= medA,  // lower-right
];

const labelMap = new Map();
quads.forEach((pred, qi) => {
  const best = sigIdx.filter(pred).sort((a, b) => Math.abs(lfcArr[b]) - Math.abs(lfcArr[a]))[0];
  if (best !== undefined) labelMap.set(best, GENE_NAMES[qi]);
});

// Label position: away from the data cloud center to avoid obstructing points
function labelPos(i) {
  if (meanArr[i] >= medA * 1.5) return 'left';  // far-right genes label leftward
  return lfcArr[i] > 0 ? 'top' : 'bottom';
}

// Partition into scatter series
const nsData = [], upData = [], dnData = [];
for (let i = 0; i < N; i++) {
  const name = labelMap.get(i) || '';
  const pt = { value: [+meanArr[i].toFixed(3), +lfcArr[i].toFixed(4)], name };
  if (name) pt.label = { show: true, position: labelPos(i) };
  if (!sigArr[i]) nsData.push(pt);
  else if (lfcArr[i] >= 0) upData.push(pt);
  else dnData.push(pt);
}

// LOESS trend — 25% bandwidth, local linear regression (tricube kernel), 60 query points
const sorted = meanArr.map((x, i) => [x, lfcArr[i]]).sort((a, b) => a[0] - b[0]);
const span   = Math.floor(N * 0.25);

function bsearch(x) {
  let lo = 0, hi = sorted.length - 1;
  while (lo < hi) { const m = (lo + hi) >> 1; if (sorted[m][0] < x) lo = m + 1; else hi = m; }
  return lo;
}

function loessAt(qx) {
  const n = sorted.length;
  let lo = bsearch(qx), hi = lo;
  while (hi - lo + 1 < span && (lo > 0 || hi < n - 1)) {
    const dL = lo > 0     ? Math.abs(sorted[lo - 1][0] - qx) : Infinity;
    const dR = hi < n - 1 ? Math.abs(sorted[hi + 1][0] - qx) : Infinity;
    if (dL <= dR) lo--; else hi++;
  }
  const maxD = Math.max(Math.abs(sorted[lo][0] - qx), Math.abs(sorted[hi][0] - qx)) + 1e-10;
  let sw = 0, swy = 0, swx = 0, swxy = 0, swx2 = 0;
  for (let j = lo; j <= hi; j++) {
    const u = Math.abs(sorted[j][0] - qx) / maxD;
    const w = (1 - u * u * u) ** 3; // tricube kernel
    sw += w; swy += w * sorted[j][1]; swx += w * sorted[j][0];
    swxy += w * sorted[j][0] * sorted[j][1]; swx2 += w * sorted[j][0] * sorted[j][0];
  }
  const det = sw * swx2 - swx * swx;
  if (Math.abs(det) < 1e-10) return swy / sw;
  return ((swx2 * swy - swx * swxy) + (sw * swxy - swx * swy) * qx) / det;
}

const xMin = sorted[0][0], xMax = sorted[sorted.length - 1][0];
const loessData = Array.from({ length: 60 }, (_, q) => {
  const qx = xMin + (xMax - xMin) * q / 59;
  return [+qx.toFixed(3), +loessAt(qx).toFixed(4)];
});

// Imprint "muted" semantic anchor — non-significant genes sit behind the data
const MUTED = window.ANYPLOT_THEME === 'light' ? '#6B6A63' : '#A8A79F';

// Chart
const chart = echarts.init(document.getElementById('container'));
chart.setOption({
  animation: false,
  color: t.palette,
  backgroundColor: 'transparent',
  title: {
    text: 'ma-differential-expression · javascript · echarts · anyplot.ai',
    left: 'center',
    top: 14,
    textStyle: { color: t.ink, fontSize: 22, fontWeight: '500' }
  },
  tooltip: {
    trigger: 'item',
    formatter: params => {
      if (params.seriesName === 'LOESS Trend') return '';
      const { value: [x, y], name } = params.data;
      return `<strong>${params.seriesName}</strong>${name ? ': ' + name : ''}<br/>` +
             `Mean Expr: ${x.toFixed(2)}<br/>log₂FC: ${y.toFixed(3)}`;
    }
  },
  legend: {
    bottom: 12,
    textStyle: { color: t.inkSoft, fontSize: 13 },
    data: ['Not Significant', 'Upregulated', 'Downregulated', 'LOESS Trend']
  },
  grid: { left: 100, right: 60, top: 80, bottom: 100 },
  xAxis: {
    type: 'value',
    name: 'Mean Average Expression (log₂ A)',
    nameLocation: 'center',
    nameGap: 46,
    nameTextStyle: { color: t.ink, fontSize: 14 },
    axisLabel: { color: t.inkSoft, fontSize: 13 },
    axisLine: { lineStyle: { color: t.inkSoft } },
    axisTick: { show: false },
    splitLine: { show: false }
  },
  yAxis: {
    type: 'value',
    name: 'Log₂ Fold Change (M)',
    nameLocation: 'center',
    nameGap: 58,
    nameTextStyle: { color: t.ink, fontSize: 14 },
    axisLabel: { color: t.inkSoft, fontSize: 13 },
    axisLine: { lineStyle: { color: t.inkSoft } },
    axisTick: { show: false },
    splitLine: { lineStyle: { color: t.grid } }
  },
  series: [
    {
      name: 'Not Significant',
      type: 'scatter',
      data: nsData,
      symbolSize: 4,
      itemStyle: { color: MUTED, opacity: 0.4 },
      emphasis: { disabled: true },
      label: { show: false },
      markLine: {
        silent: true,
        symbol: ['none', 'none'],
        label: { formatter: '{b}', color: t.inkSoft, fontSize: 11 },
        data: [
          { yAxis:  0, name: 'M = 0',  lineStyle: { color: t.inkSoft, width: 1.5, type: 'solid'  } },
          { yAxis:  1, name: 'M = +1', lineStyle: { color: t.inkSoft, width: 1.0, type: 'dashed' } },
          { yAxis: -1, name: 'M = −1', lineStyle: { color: t.inkSoft, width: 1.0, type: 'dashed' } }
        ]
      }
    },
    {
      name: 'Upregulated',
      type: 'scatter',
      data: upData,
      symbolSize: 8,
      itemStyle: { color: t.palette[0], opacity: 0.75 }, // #009E73 — semantic: gain/up
      label: {
        show: false,
        formatter: p => p.data.name,
        color: t.ink,
        fontSize: 13,
        distance: 6
      }
    },
    {
      name: 'Downregulated',
      type: 'scatter',
      data: dnData,
      symbolSize: 8,
      itemStyle: { color: t.palette[4], opacity: 0.75 }, // #AE3030 — semantic: loss/down
      label: {
        show: false,
        formatter: p => p.data.name,
        color: t.ink,
        fontSize: 13,
        distance: 6
      }
    },
    {
      name: 'LOESS Trend',
      type: 'line',
      data: loessData,
      smooth: false,
      symbol: 'none',
      lineStyle: { color: t.palette[3], width: 2.5 }, // #BD8233 ochre — trend reference
      itemStyle: { color: t.palette[3] }
    }
  ]
});
Runnable source as JSON, for any HTTP client: https://api.anyplot.ai/specs/ma-differential-expression/echarts/code. Any spec id and library id listed in llms-full.txt fit the same URL shape; every URL below is complete and callable.
{
  "spec_id": "ma-differential-expression",
  "language": "javascript",
  "library": "echarts",
  "page": "https://anyplot.ai/ma-differential-expression/javascript/echarts",
  "hub": "https://anyplot.ai/ma-differential-expression",
  "code_json": "https://api.anyplot.ai/specs/ma-differential-expression/echarts/code",
  "spec_json": "https://api.anyplot.ai/specs/ma-differential-expression",
  "render_light_png": "https://storage.googleapis.com/anyplot-images/plots/ma-differential-expression/javascript/echarts/plot-light.png",
  "render_dark_png": "https://storage.googleapis.com/anyplot-images/plots/ma-differential-expression/javascript/echarts/plot-dark.png",
  "interactive_light_html": "https://storage.googleapis.com/anyplot-images/plots/ma-differential-expression/javascript/echarts/plot-light.html",
  "interactive_dark_html": "https://storage.googleapis.com/anyplot-images/plots/ma-differential-expression/javascript/echarts/plot-dark.html",
  "quality_score": 83.0,
  "license": "MIT",
  "guide": "https://anyplot.ai/llms.txt"
}
Part of MA Plot for Differential Expression on anyplot.ai.