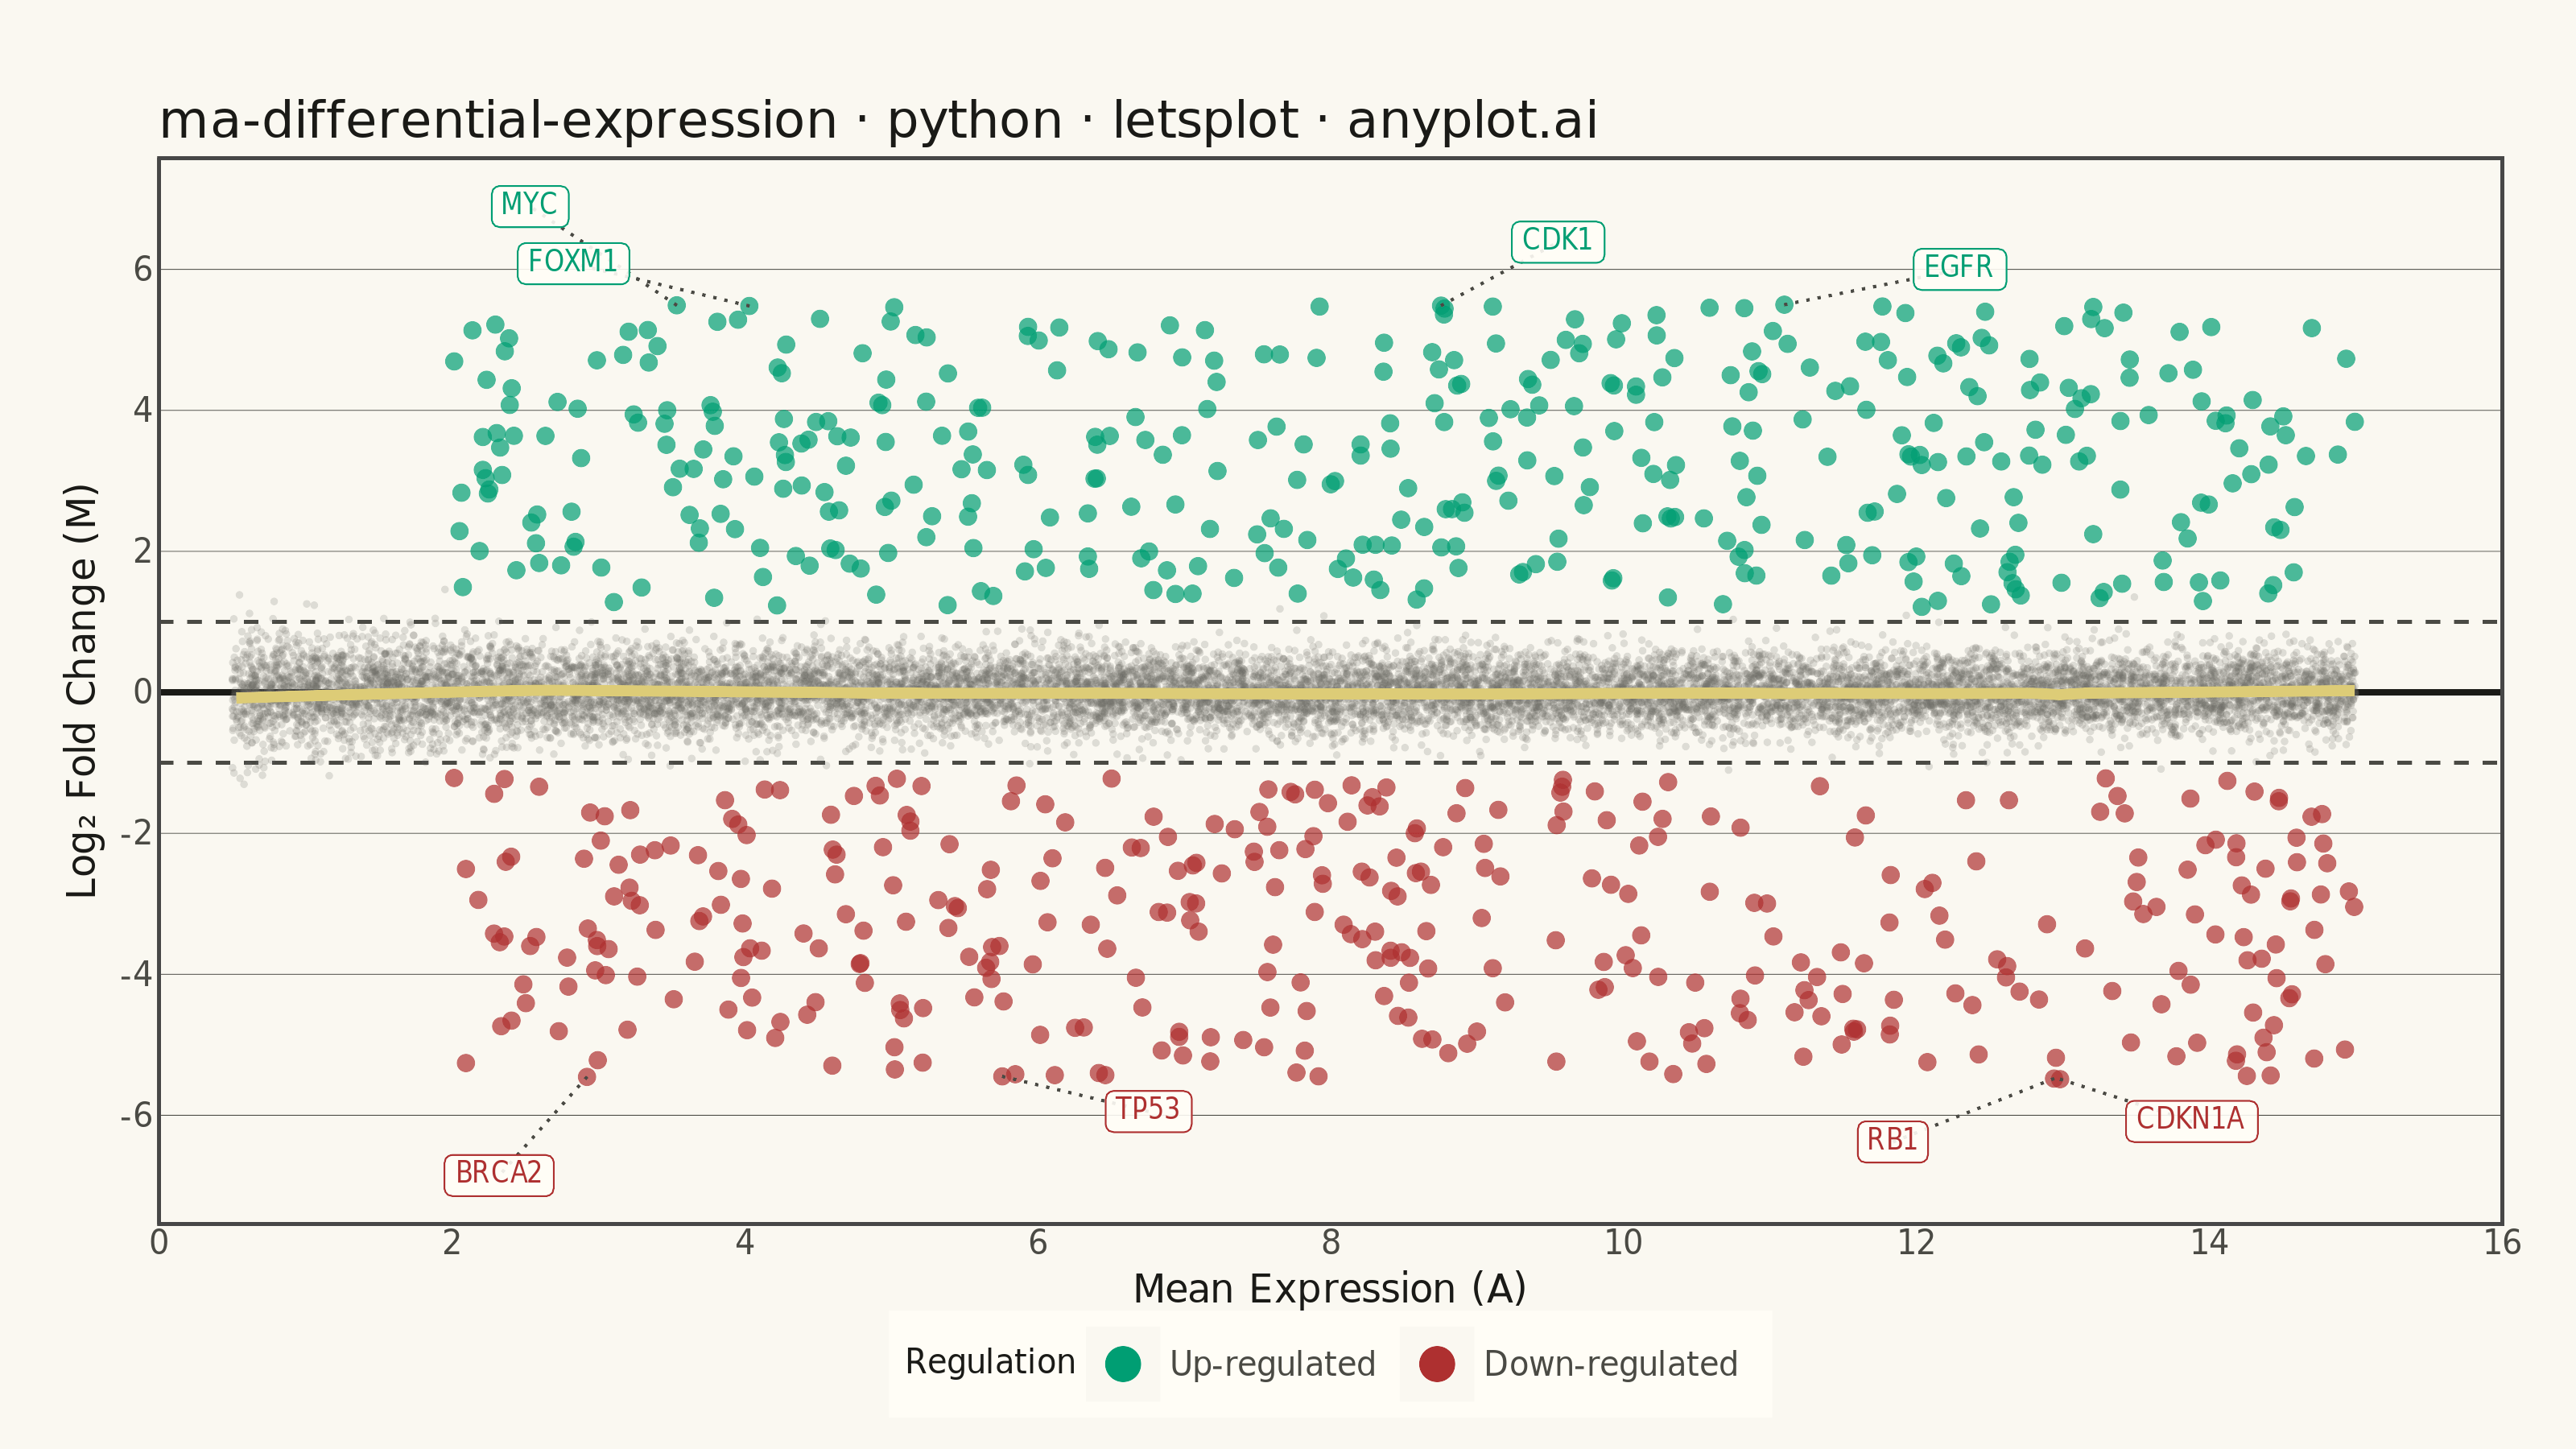
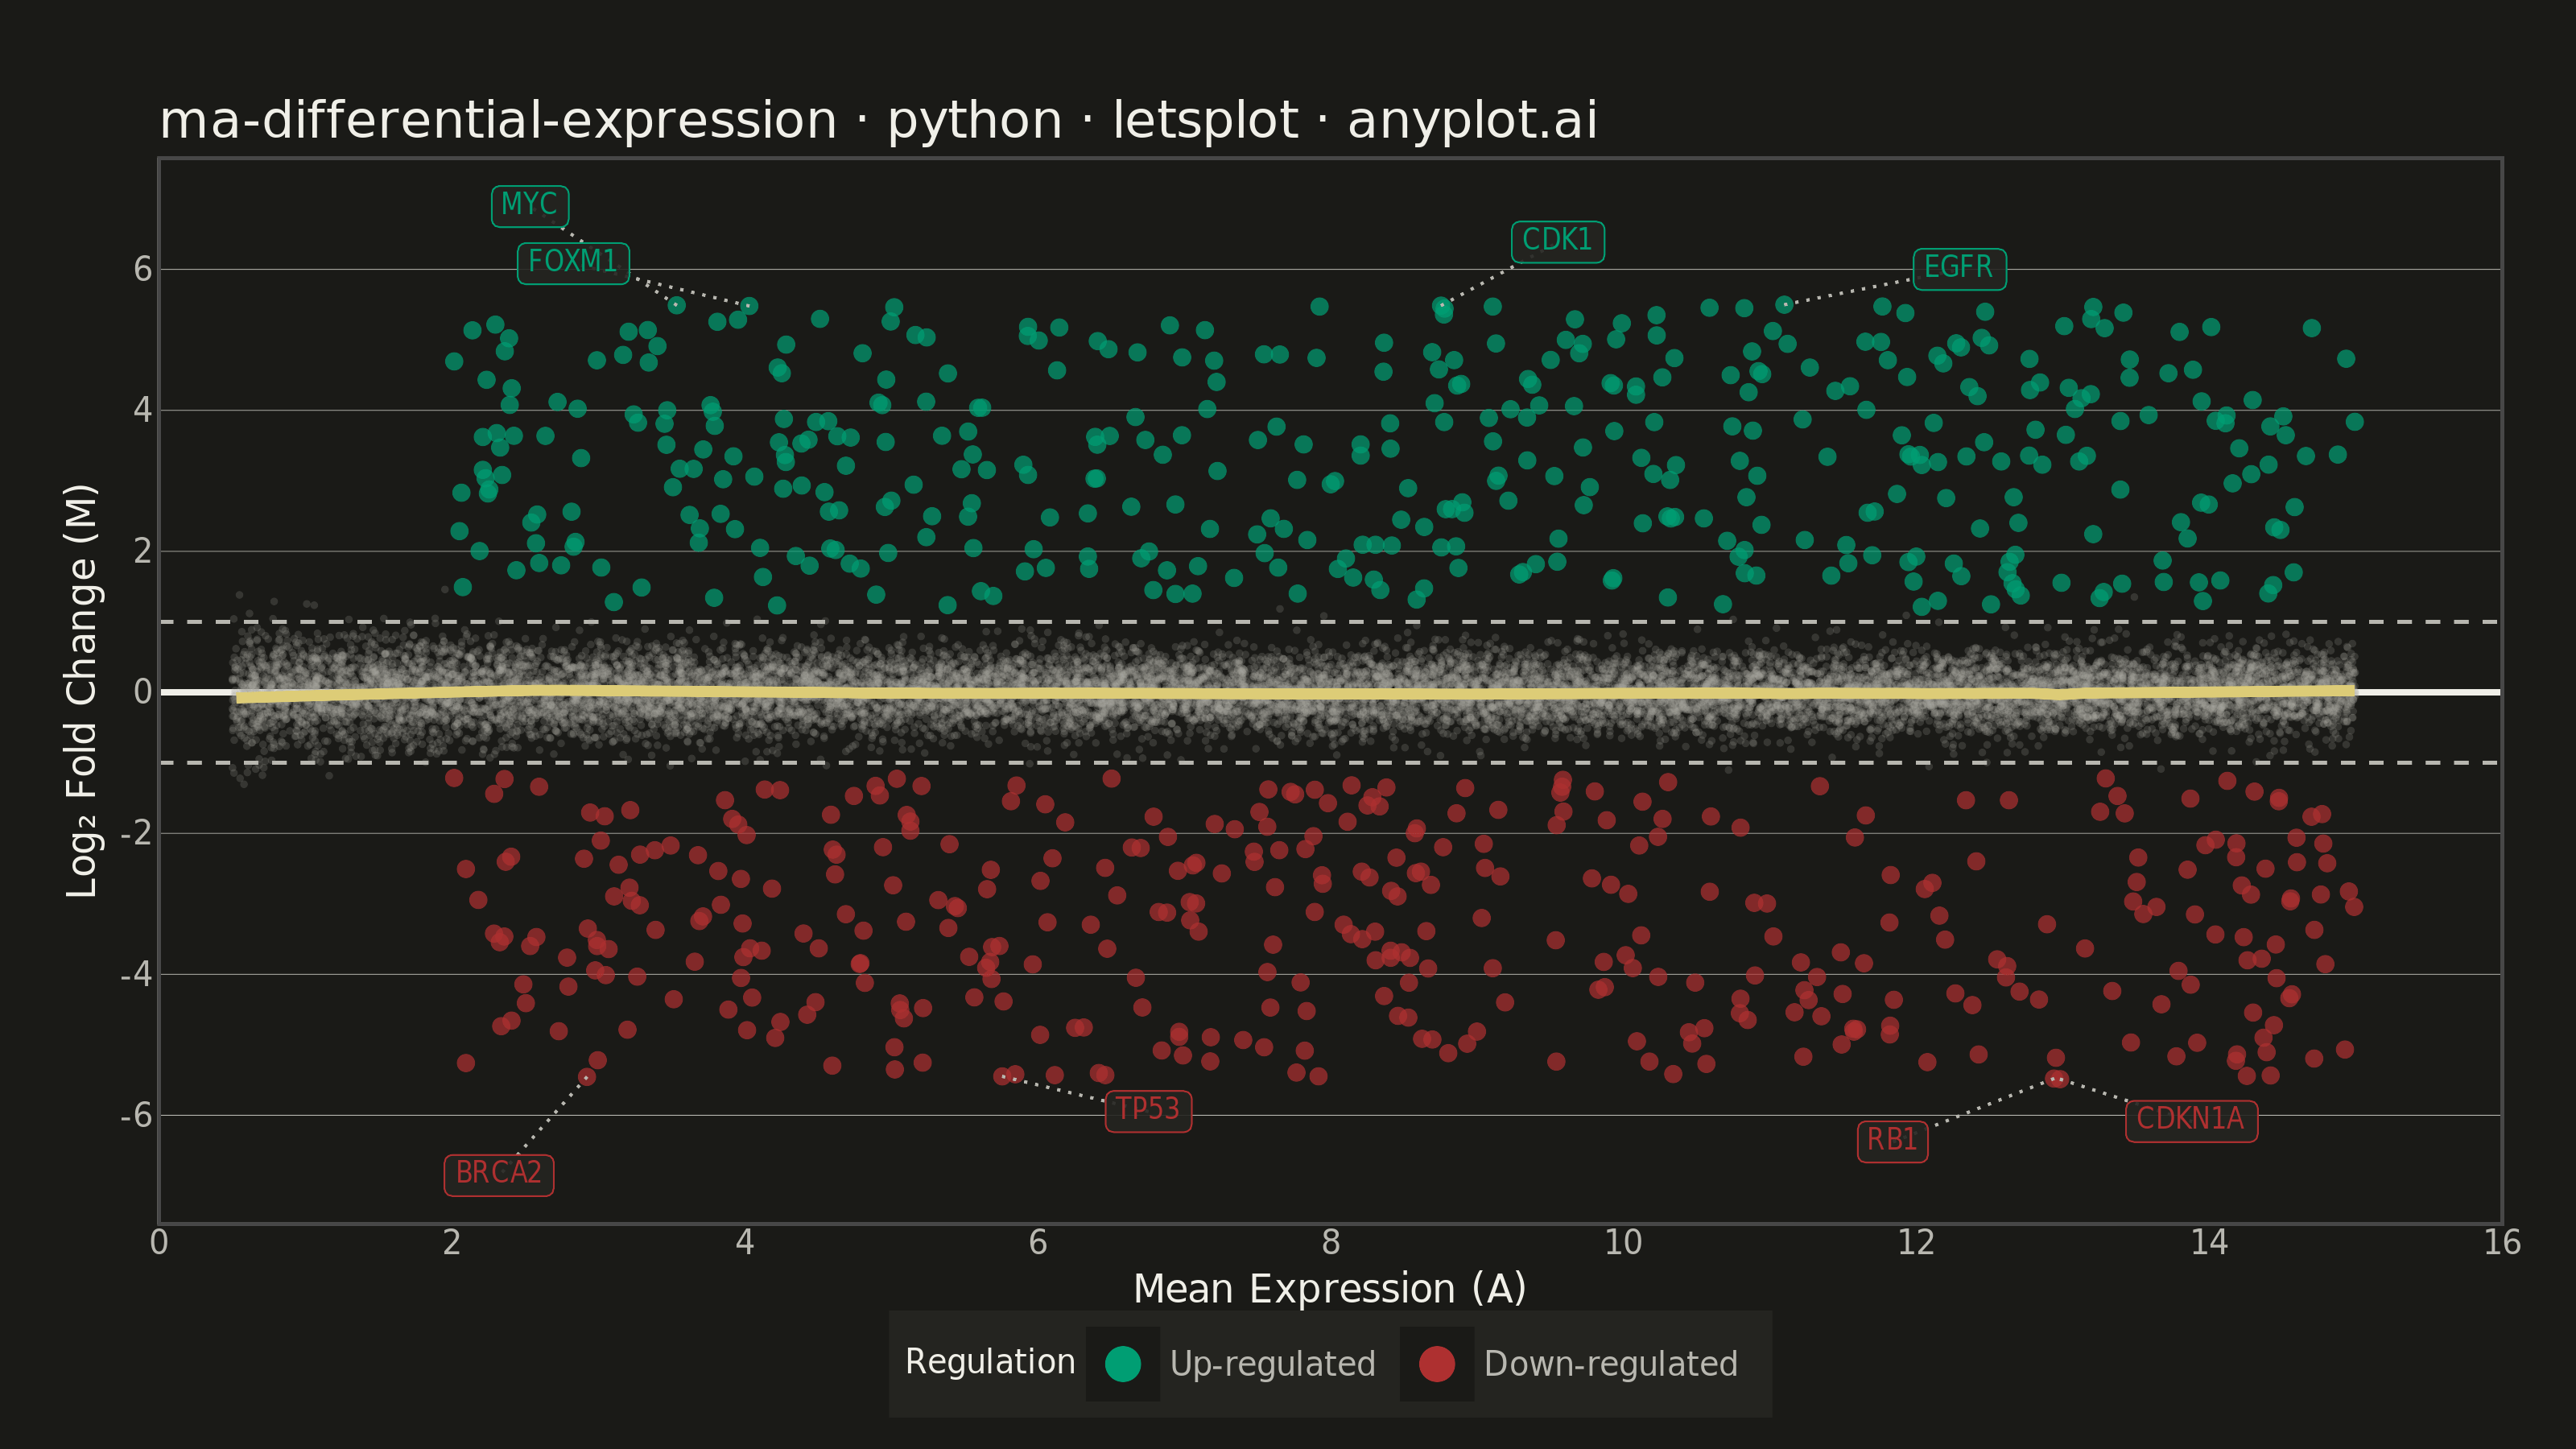
An MA plot (M-versus-A plot) visualizes the relationship between log fold change (M) and mean average expression (A) when comparing two experimental conditions. Each point represents a gene or feature, with significantly differentially expressed genes highlighted. This plot is a standard diagnostic tool in RNA-seq and microarray analysis for assessing differential expression results and detecting systematic expression-dependent bias.
""" anyplot.ai
ma-differential-expression: MA Plot for Differential Expression
Library: letsplot 4.10.1 | Python 3.13.14
Quality: 91/100 | Updated: 2026-06-21
"""

import os

import numpy as np
import pandas as pd
from lets_plot import (
    LetsPlot,
    aes,
    coord_cartesian,
    element_blank,
    element_line,
    element_rect,
    element_text,
    geom_hline,
    geom_label,
    geom_point,
    geom_segment,
    geom_smooth,
    ggplot,
    ggsize,
    labs,
    layer_tooltips,
    scale_color_manual,
    theme,
    theme_minimal,
)
from lets_plot.export import ggsave


LetsPlot.setup_html()

# Theme tokens (see prompts/default-style-guide.md "Theme-adaptive Chrome")
THEME = os.getenv("ANYPLOT_THEME", "light")
PAGE_BG = "#FAF8F1" if THEME == "light" else "#1A1A17"
ELEVATED_BG = "#FFFDF6" if THEME == "light" else "#242420"
INK = "#1A1A17" if THEME == "light" else "#F0EFE8"
INK_SOFT = "#4A4A44" if THEME == "light" else "#B8B7B0"
INK_MUTED = "#6B6A63" if THEME == "light" else "#A8A79F"

# Imprint palette — semantic: green = gain/up-regulated, red = loss/down-regulated
UP_COLOR = "#009E73"  # Imprint position 1: brand green (growth/gain)
DOWN_COLOR = "#AE3030"  # Imprint position 5: matte red (loss/error)
ANYPLOT_AMBER = "#DDCC77"  # caution anchor — LOESS bias indicator

# Data
np.random.seed(42)
n_genes = 15000

mean_expression = np.random.uniform(0.5, 15, n_genes)

# Expression-dependent variance creates funnel shape (wider spread at low expression)
log_fold_change = np.random.normal(0, 0.3, n_genes)
low_expr_bias = 0.4 * np.exp(-0.3 * mean_expression)
log_fold_change += np.random.normal(0, low_expr_bias)

# Differentially expressed genes — only among moderately expressed genes
n_up, n_down = 420, 380
up_idx = np.random.choice(np.where(mean_expression > 2)[0], n_up, replace=False)
down_idx = np.random.choice(np.setdiff1d(np.where(mean_expression > 2)[0], up_idx), n_down, replace=False)
log_fold_change[up_idx] = np.random.uniform(1.2, 5.5, n_up)
log_fold_change[down_idx] = np.random.uniform(-5.5, -1.2, n_down)

p_values = np.ones(n_genes)
p_values[up_idx] = np.random.uniform(1e-20, 0.01, n_up)
p_values[down_idx] = np.random.uniform(1e-20, 0.01, n_down)

significant = p_values < 0.05
status = np.where(~significant, "Not significant", np.where(log_fold_change > 0, "Up-regulated", "Down-regulated"))

df = pd.DataFrame(
    {
        "A": mean_expression,
        "M": log_fold_change,
        "status": pd.Categorical(status, categories=["Down-regulated", "Not significant", "Up-regulated"]),
    }
)
df_nonsig = df[df["status"] == "Not significant"]
df_sig = df[df["status"] != "Not significant"]

# Top gene labels — real cancer biology gene names
real_names_up = ["FOXM1", "CDK1", "MYC", "EGFR"]
real_names_down = ["CDKN1A", "RB1", "BRCA2", "TP53"]
top_up = up_idx[np.argsort(log_fold_change[up_idx])[-4:]]
top_down = down_idx[np.argsort(log_fold_change[down_idx])[:4]]
top_idx = np.concatenate([top_up, top_down])

nudges = [(-1.2, 0.6), (0.8, 0.9), (-1.0, 1.4), (1.2, 0.5), (0.9, -0.6), (-1.1, -0.9), (-0.6, -1.4), (1.0, -0.5)]
df_labels = pd.DataFrame(
    {
        "A": mean_expression[top_idx],
        "M": log_fold_change[top_idx],
        "gene": real_names_up + real_names_down,
        "label_x": mean_expression[top_idx] + [n[0] for n in nudges],
        "label_y": log_fold_change[top_idx] + [n[1] for n in nudges],
        "regulation": ["Up-regulated"] * 4 + ["Down-regulated"] * 4,
    }
)

# Plot — ggplot(df) as base for idiomatic single-data approach
plot = (
    ggplot(df, aes(x="A", y="M"))
    + geom_hline(yintercept=0, color=INK, size=0.8)
    + geom_hline(yintercept=1, color=INK_SOFT, size=0.5, linetype="dashed")
    + geom_hline(yintercept=-1, color=INK_SOFT, size=0.5, linetype="dashed")
    + geom_point(data=df_nonsig, color=INK_MUTED, size=1.0, alpha=0.20)
    + geom_point(
        aes(color="status"),
        data=df_sig,
        size=2.5,
        alpha=0.70,
        tooltips=layer_tooltips()
        .line("@status")
        .line("Mean expr: @A")
        .line("Log₂FC: @M")
        .format("A", ".1f")
        .format("M", ".2f"),
    )
    + geom_smooth(color=ANYPLOT_AMBER, size=1.5, se=False, method="loess", span=0.3)
    + geom_segment(
        aes(x="A", y="M", xend="label_x", yend="label_y"), data=df_labels, color=INK_SOFT, size=0.4, linetype="dotted"
    )
    + geom_label(
        aes(x="label_x", y="label_y", label="gene", color="regulation"),
        data=df_labels,
        size=4,
        fill=ELEVATED_BG,
        alpha=0.90,
        label_padding=0.3,
        label_r=0.2,
        label_size=0.5,
        show_legend=False,
    )
    + scale_color_manual(values={"Up-regulated": UP_COLOR, "Down-regulated": DOWN_COLOR}, name="Regulation")
    + labs(
        x="Mean Expression (A)",
        y="Log₂ Fold Change (M)",
        title="ma-differential-expression · python · letsplot · anyplot.ai",
    )
    + coord_cartesian(xlim=[0, 16])
    + ggsize(800, 450)
    + theme_minimal()
    + theme(
        plot_background=element_rect(fill=PAGE_BG, color=PAGE_BG),
        panel_background=element_rect(fill=PAGE_BG),
        panel_grid_major=element_line(color=INK_SOFT, size=0.2),
        panel_grid_major_x=element_blank(),
        panel_grid_minor=element_blank(),
        axis_title=element_text(color=INK, size=12),
        axis_text=element_text(color=INK_SOFT, size=10),
        axis_line=element_line(color=INK_SOFT),
        plot_title=element_text(color=INK, size=16),
        legend_background=element_rect(fill=ELEVATED_BG, color=INK_SOFT),
        legend_text=element_text(color=INK_SOFT, size=10),
        legend_title=element_text(color=INK, size=10),
        legend_position="bottom",
        plot_margin=[30, 20, 10, 20],
    )
)

# Save
ggsave(plot, f"plot-{THEME}.png", path=".", scale=4)
ggsave(plot, f"plot-{THEME}.html", path=".")
Runnable source as JSON, for any HTTP client: https://api.anyplot.ai/specs/ma-differential-expression/letsplot/code. Any spec id and library id listed in llms-full.txt fit the same URL shape; every URL below is complete and callable.
{
  "spec_id": "ma-differential-expression",
  "language": "python",
  "library": "letsplot",
  "page": "https://anyplot.ai/ma-differential-expression/python/letsplot",
  "hub": "https://anyplot.ai/ma-differential-expression",
  "code_json": "https://api.anyplot.ai/specs/ma-differential-expression/letsplot/code",
  "spec_json": "https://api.anyplot.ai/specs/ma-differential-expression",
  "render_light_png": "https://storage.googleapis.com/anyplot-images/plots/ma-differential-expression/python/letsplot/plot-light.png",
  "render_dark_png": "https://storage.googleapis.com/anyplot-images/plots/ma-differential-expression/python/letsplot/plot-dark.png",
  "interactive_light_html": "https://storage.googleapis.com/anyplot-images/plots/ma-differential-expression/python/letsplot/plot-light.html",
  "interactive_dark_html": "https://storage.googleapis.com/anyplot-images/plots/ma-differential-expression/python/letsplot/plot-dark.html",
  "quality_score": 91.0,
  "license": "MIT",
  "guide": "https://anyplot.ai/llms.txt"
}
Part of MA Plot for Differential Expression on anyplot.ai.