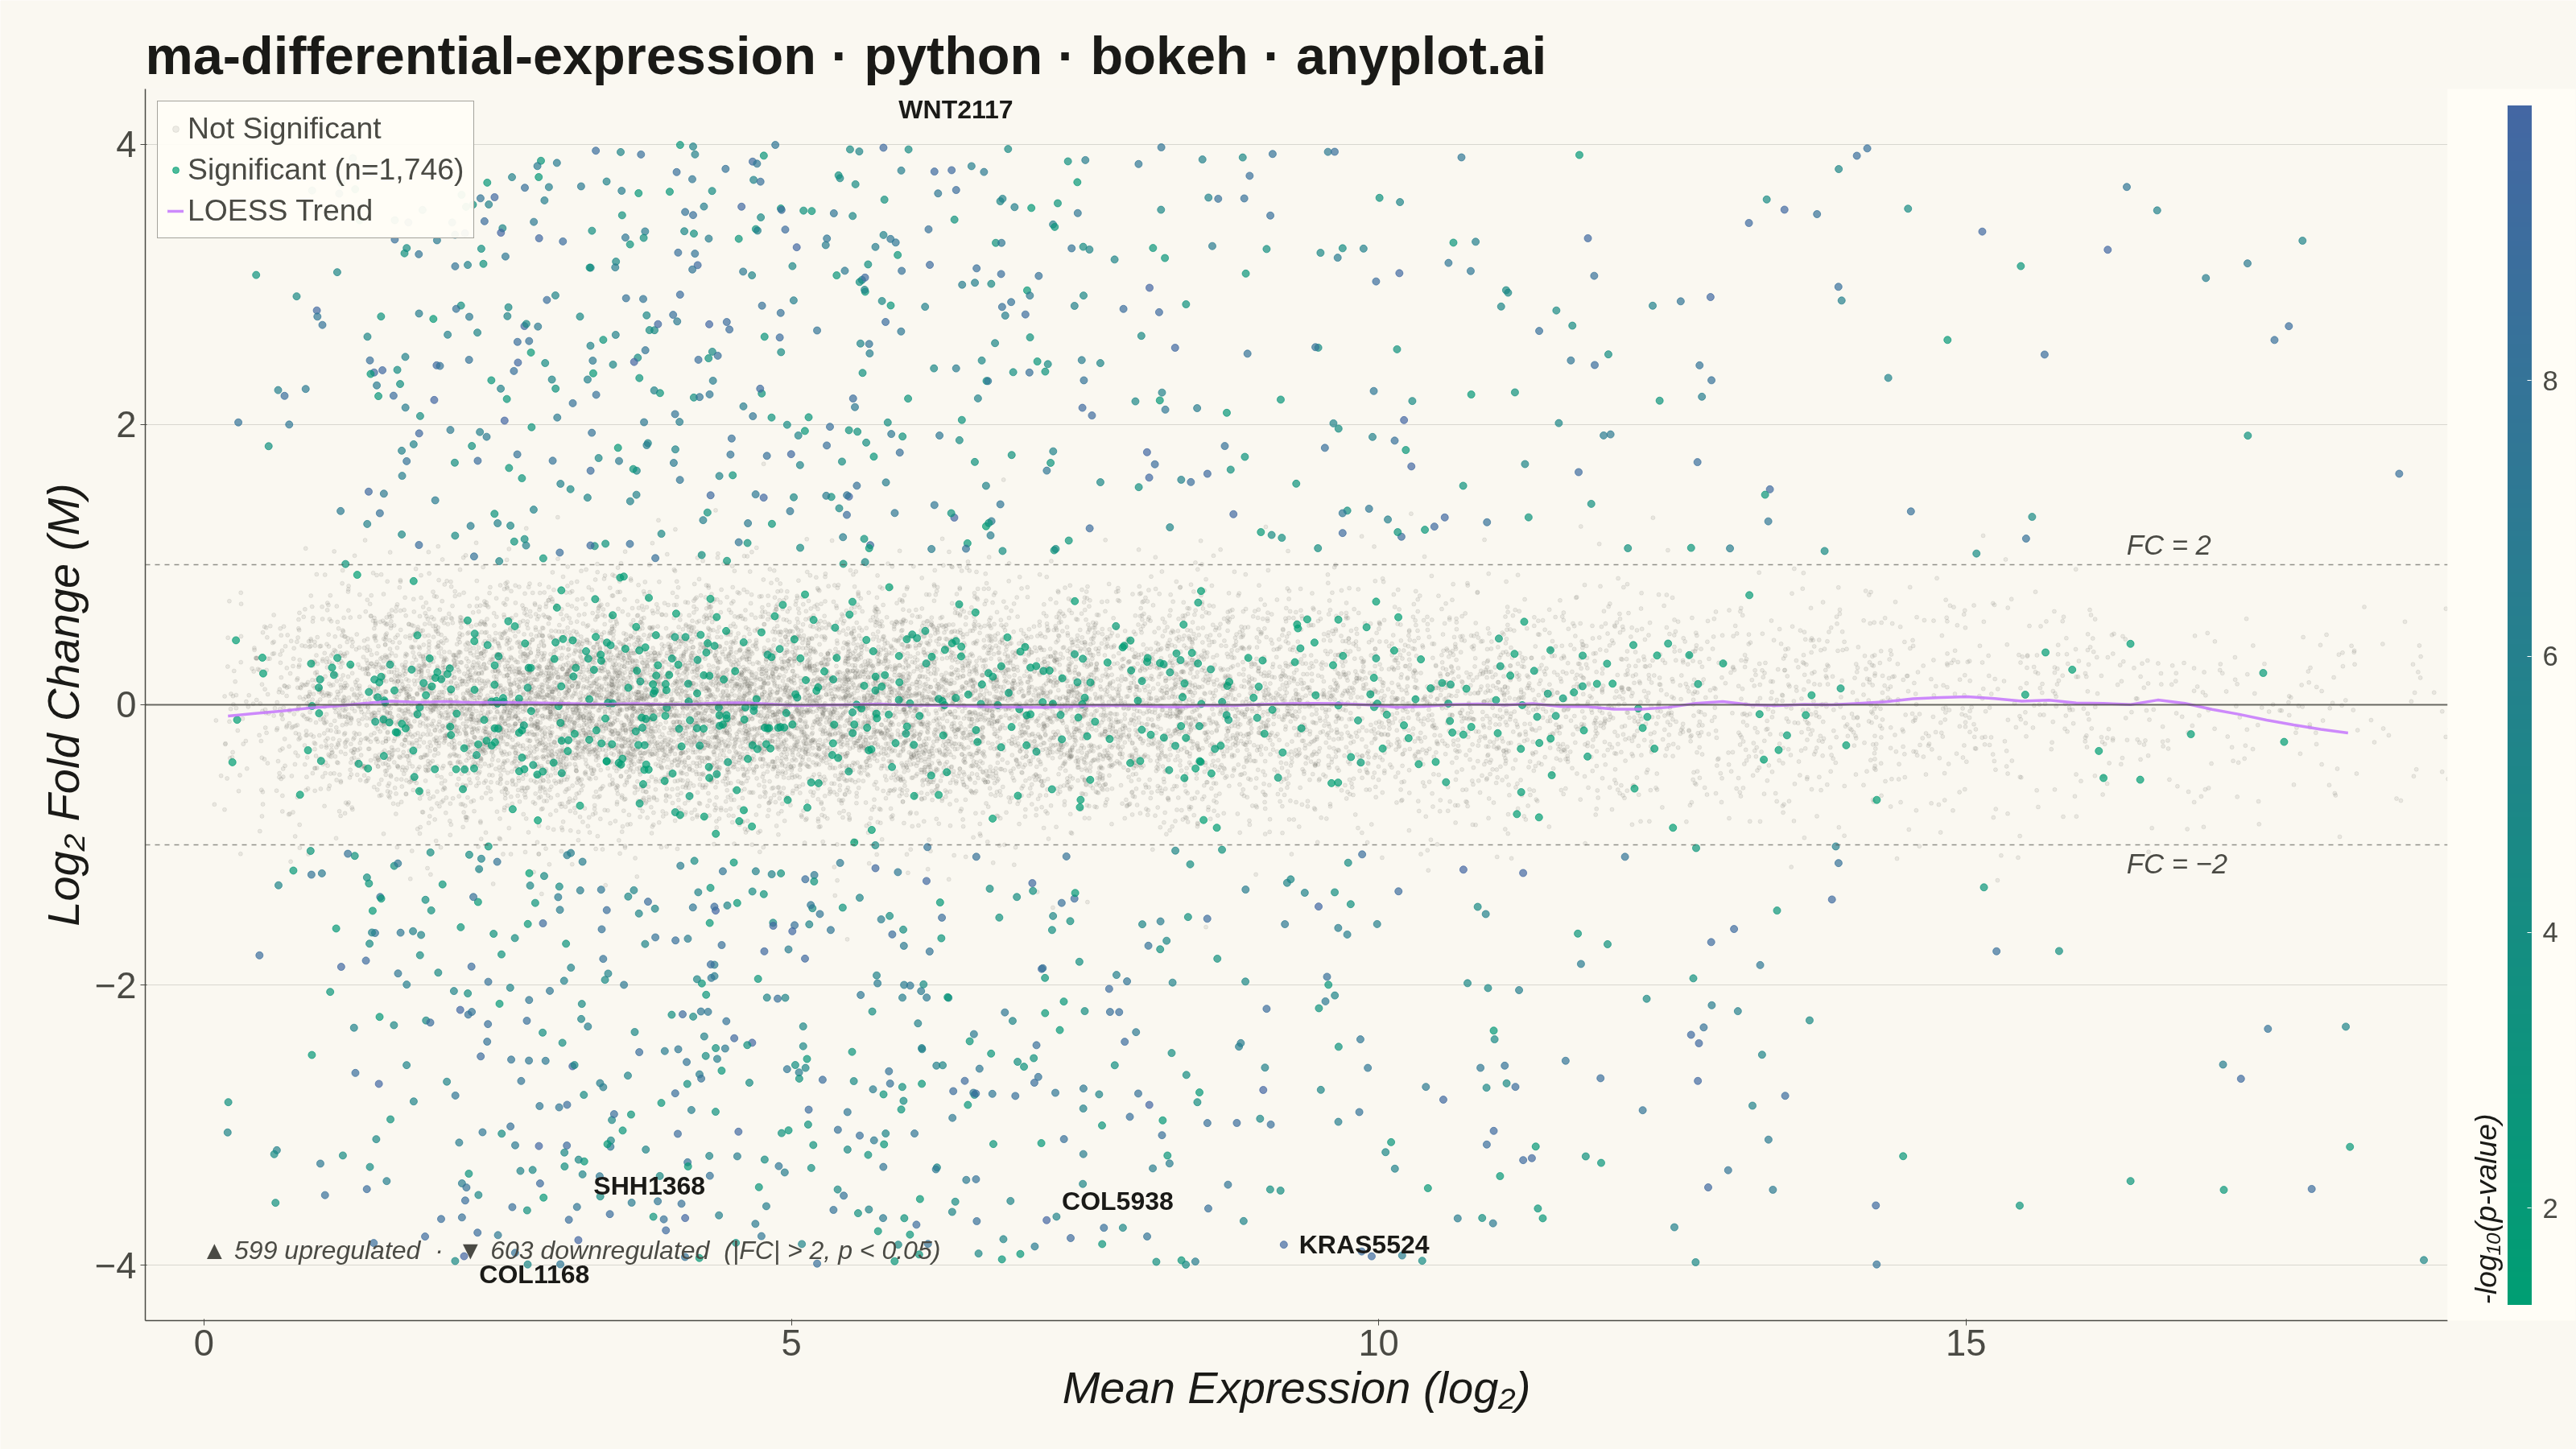
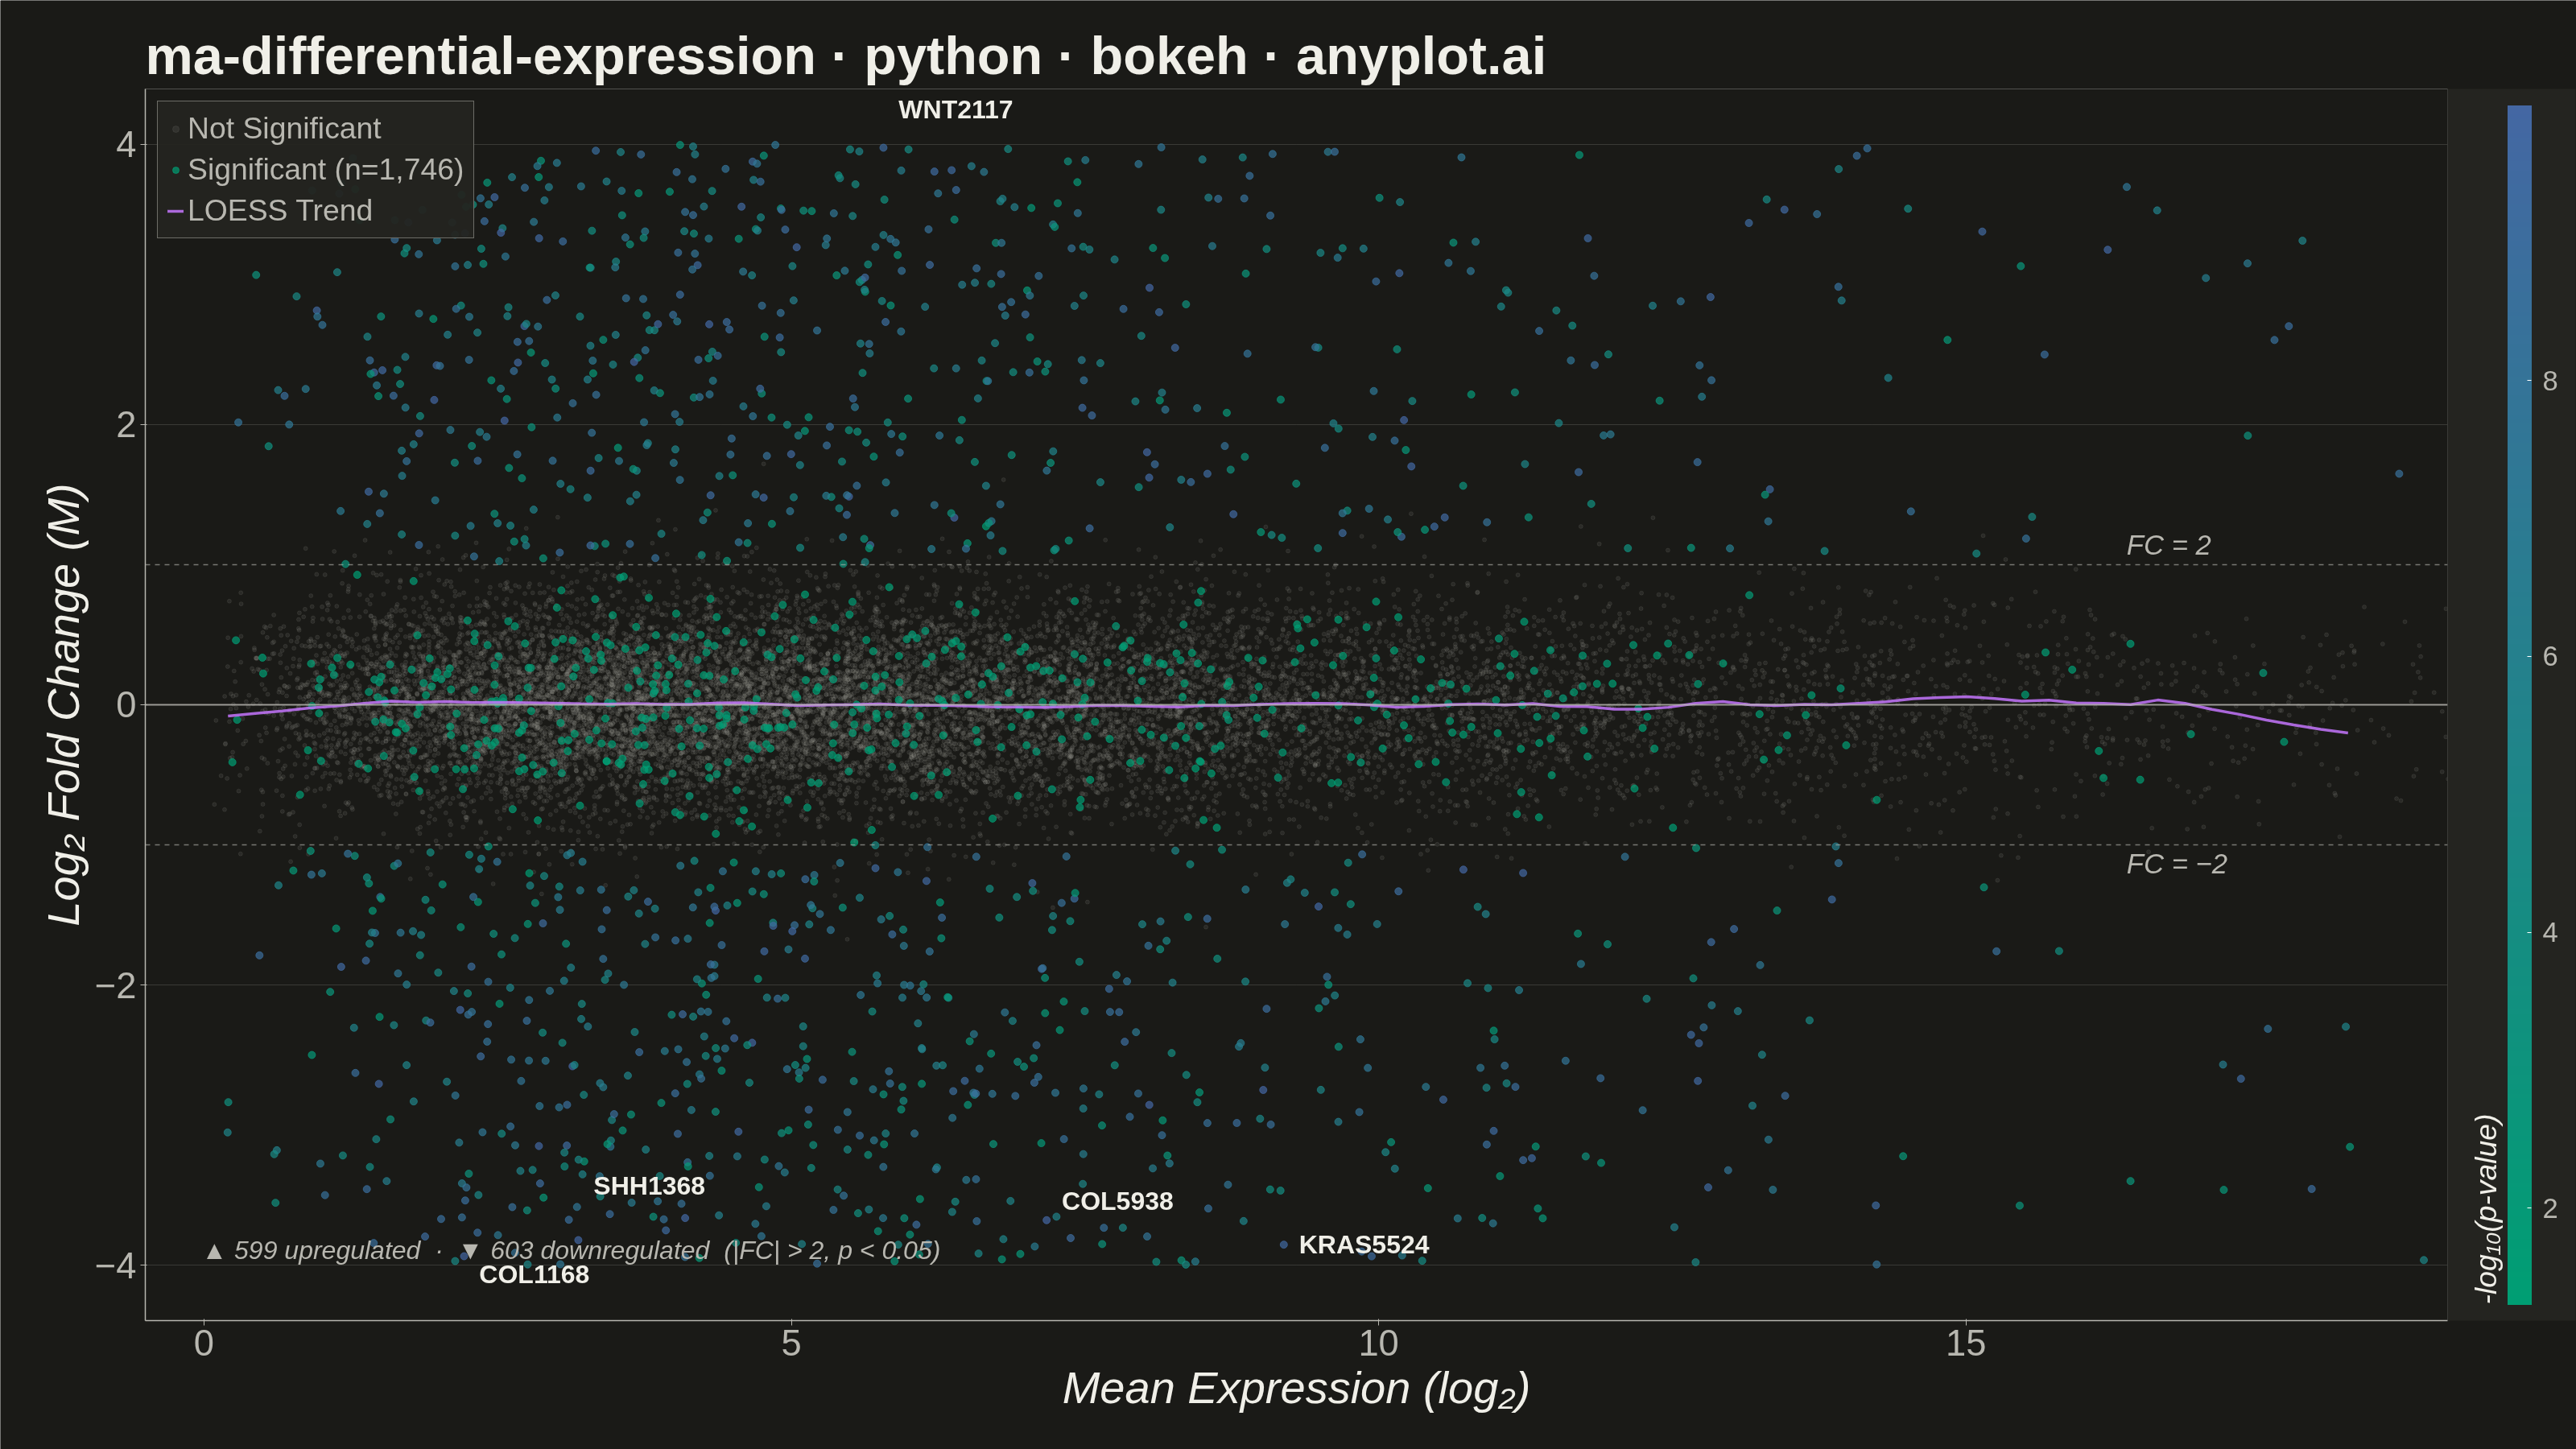
An MA plot (M-versus-A plot) visualizes the relationship between log fold change (M) and mean average expression (A) when comparing two experimental conditions. Each point represents a gene or feature, with significantly differentially expressed genes highlighted. This plot is a standard diagnostic tool in RNA-seq and microarray analysis for assessing differential expression results and detecting systematic expression-dependent bias.
""" anyplot.ai
ma-differential-expression: MA Plot for Differential Expression
Library: bokeh 3.9.1 | Python 3.13.14
Quality: 89/100 | Updated: 2026-06-21
"""

# Remove the script's own directory from sys.path so "bokeh.py" doesn't shadow the package
import os as _os
import sys as _sys


_sys.path = [p for p in _sys.path if _os.path.abspath(p) != _os.path.dirname(_os.path.abspath(__file__))]

import os
import time
from pathlib import Path

import numpy as np
from bokeh.io import output_file, save
from bokeh.models import BasicTicker, ColorBar, ColumnDataSource, HoverTool, Label, LinearColorMapper, Range1d, Span
from bokeh.plotting import figure
from bokeh.resources import CDN
from bokeh.transform import transform
from selenium import webdriver
from selenium.webdriver.chrome.options import Options


THEME = os.getenv("ANYPLOT_THEME", "light")

# Theme-adaptive chrome tokens
PAGE_BG = "#FAF8F1" if THEME == "light" else "#1A1A17"
ELEVATED_BG = "#FFFDF6" if THEME == "light" else "#242420"
INK = "#1A1A17" if THEME == "light" else "#F0EFE8"
INK_SOFT = "#4A4A44" if THEME == "light" else "#B8B7B0"
INK_MUTED = "#6B6A63" if THEME == "light" else "#A8A79F"


# Imprint sequential colormap (green → blue) for significance strength
def _lerp_hex(c0, c1, t):
    r0, g0, b0 = (int(c0[i : i + 2], 16) for i in (1, 3, 5))
    r1, g1, b1 = (int(c1[i : i + 2], 16) for i in (1, 3, 5))
    r = int(round(r0 + (r1 - r0) * t))
    g = int(round(g0 + (g1 - g0) * t))
    b = int(round(b0 + (b1 - b0) * t))
    return f"#{r:02X}{g:02X}{b:02X}"


IMPRINT_SEQ256 = [_lerp_hex("#009E73", "#4467A3", t / 255.0) for t in range(256)]

# Data: Simulated RNA-seq differential expression results
np.random.seed(42)
n_genes = 15000

gene_prefixes = [
    "BRCA",
    "TP",
    "MYC",
    "EGFR",
    "KRAS",
    "PTEN",
    "AKT",
    "MAPK",
    "STAT",
    "JAK",
    "CDK",
    "RB",
    "VEGF",
    "HIF",
    "TNF",
    "IL",
    "NOTCH",
    "WNT",
    "SHH",
    "FGF",
    "SOX",
    "PAX",
    "HOX",
    "GATA",
    "FOXP",
    "RUNX",
    "ETS",
    "MMP",
    "COL",
    "FN",
]
gene_names = [f"{gene_prefixes[i % len(gene_prefixes)]}{i}" for i in range(n_genes)]

mean_expression = np.random.gamma(shape=2.5, scale=2.5, size=n_genes)
log_fold_change = np.random.normal(0, 0.4, n_genes)

n_de = int(n_genes * 0.08)
de_indices = np.random.choice(n_genes, n_de, replace=False)
log_fold_change[de_indices] = np.random.choice([-1, 1], n_de) * np.random.uniform(1.0, 4.0, n_de)

p_values = np.ones(n_genes)
p_values[de_indices] = 10 ** (-np.random.uniform(2, 10, n_de))
p_values[~np.isin(np.arange(n_genes), de_indices)] = np.random.uniform(0.01, 1.0, n_genes - n_de)

significant = p_values < 0.05
neg_log10_p = -np.log10(np.clip(p_values, 1e-15, 1.0))

sig_mask = significant
nonsig_mask = ~significant

source_nonsig = ColumnDataSource(
    data={
        "x": mean_expression[nonsig_mask],
        "y": log_fold_change[nonsig_mask],
        "gene": [gene_names[i] for i in np.where(nonsig_mask)[0]],
        "pval": p_values[nonsig_mask],
    }
)

source_sig = ColumnDataSource(
    data={
        "x": mean_expression[sig_mask],
        "y": log_fold_change[sig_mask],
        "gene": [gene_names[i] for i in np.where(sig_mask)[0]],
        "pval": p_values[sig_mask],
        "neg_log10_p": neg_log10_p[sig_mask],
    }
)

x_limit = np.percentile(mean_expression, 99)

plot = figure(
    width=3200,
    height=1800,
    title="ma-differential-expression · python · bokeh · anyplot.ai",
    x_axis_label="Mean Expression (log₂)",
    y_axis_label="Log₂ Fold Change (M)",
    toolbar_location=None,
    x_range=Range1d(-0.5, x_limit + 0.5),
    min_border_bottom=160,
    min_border_left=180,
    min_border_top=110,
    min_border_right=80,
)

# Imprint sequential colormap for significance strength (single-polarity continuous)
color_mapper = LinearColorMapper(
    palette=IMPRINT_SEQ256,
    low=neg_log10_p[sig_mask].min() if sig_mask.sum() > 0 else 0,
    high=neg_log10_p[sig_mask].max() if sig_mask.sum() > 0 else 10,
)

# Non-significant genes (muted, behind)
r_nonsig = plot.scatter(
    x="x", y="y", source=source_nonsig, size=5, color=INK_MUTED, alpha=0.12, legend_label="Not Significant"
)

# Significant genes with color mapped by -log10(p) using Imprint sequential cmap
r_sig = plot.scatter(
    x="x",
    y="y",
    source=source_sig,
    size=9,
    color=transform("neg_log10_p", color_mapper),
    alpha=0.7,
    legend_label=f"Significant (n={sig_mask.sum():,})",
)

hover = HoverTool(
    renderers=[r_sig],
    tooltips=[("Gene", "@gene"), ("Mean Expr", "@x{0.2f}"), ("Log₂ FC", "@y{0.2f}"), ("p-value", "@pval{0.2e}")],
)
plot.add_tools(hover)

# Reference lines: M=0 (solid) and M=±1 (dashed fold-change thresholds)
zero_line = Span(location=0, dimension="width", line_color=INK_SOFT, line_width=2, line_alpha=0.8)
plot.add_layout(zero_line)

upper_fc = Span(location=1, dimension="width", line_color=INK_SOFT, line_width=1.5, line_dash="dashed", line_alpha=0.6)
plot.add_layout(upper_fc)

lower_fc = Span(location=-1, dimension="width", line_color=INK_SOFT, line_width=1.5, line_dash="dashed", line_alpha=0.6)
plot.add_layout(lower_fc)

# LOESS approximation via binned moving average
sort_idx = np.argsort(mean_expression)
x_sorted = mean_expression[sort_idx]
y_sorted = log_fold_change[sort_idx]

vis_mask = x_sorted <= x_limit
x_vis = x_sorted[vis_mask]
y_vis = y_sorted[vis_mask]

n_bins = 80
bin_edges = np.linspace(x_vis.min(), x_vis.max(), n_bins + 1)
bin_centers = []
bin_means = []
for i in range(n_bins):
    in_bin = (x_vis >= bin_edges[i]) & (x_vis < bin_edges[i + 1])
    if in_bin.sum() > 5:
        bin_centers.append((bin_edges[i] + bin_edges[i + 1]) / 2)
        bin_means.append(np.mean(y_vis[in_bin]))

bin_centers = np.array(bin_centers)
bin_means = np.array(bin_means)

window = 11
pad = window // 2
padded = np.pad(bin_means, pad, mode="edge")
y_smooth = np.convolve(padded, np.ones(window) / window, mode="valid")

smooth_source = ColumnDataSource(data={"x": bin_centers, "y": y_smooth})
# Imprint lavender (#C475FD, position 2) — distinct from the green→blue sig colormap
plot.line(x="x", y="y", source=smooth_source, line_width=3.5, color="#C475FD", alpha=0.85, legend_label="LOESS Trend")

# Fold-change threshold labels
label_x = x_limit * 0.88

upper_label = Label(
    x=label_x,
    y=1,
    text="FC = 2",
    text_font_size="26pt",
    text_color=INK_SOFT,
    text_baseline="bottom",
    y_offset=5,
    text_font_style="italic",
)
plot.add_layout(upper_label)

lower_label = Label(
    x=label_x,
    y=-1,
    text="FC = −2",
    text_font_size="26pt",
    text_color=INK_SOFT,
    text_baseline="top",
    y_offset=-5,
    text_font_style="italic",
)
plot.add_layout(lower_label)

# Annotate top DE genes by |fold change| × −log10(p)
sig_indices = np.where(sig_mask)[0]
if len(sig_indices) > 0:
    de_score = np.abs(log_fold_change[sig_indices]) * neg_log10_p[sig_indices]
    top_n = 5
    top_local = np.argsort(de_score)[-top_n:]
    top_global = sig_indices[top_local]

    y_offsets = [6, 30, -18, 50, -40]
    for rank, idx in enumerate(top_global):
        gx = mean_expression[idx]
        gy = log_fold_change[idx]
        if gx <= x_limit:
            gene_label = Label(
                x=gx,
                y=gy,
                text=f" {gene_names[idx]}",
                text_font_size="24pt",
                text_color=INK,
                text_font_style="bold",
                x_offset=10,
                y_offset=y_offsets[rank % len(y_offsets)],
            )
            plot.add_layout(gene_label)

# Summary annotation: up/downregulated counts
n_up = int(np.sum(significant & (log_fold_change > 1)))
n_down = int(np.sum(significant & (log_fold_change < -1)))
summary_label = Label(
    x=70,
    y=70,
    x_units="screen",
    y_units="screen",
    text=f"▲ {n_up} upregulated  ·  ▼ {n_down} downregulated  (|FC| > 2, p < 0.05)",
    text_font_size="24pt",
    text_color=INK_SOFT,
    text_font_style="italic",
)
plot.add_layout(summary_label)

# ColorBar for significance gradient
color_bar = ColorBar(
    color_mapper=color_mapper,
    ticker=BasicTicker(desired_num_ticks=6),
    label_standoff=14,
    major_label_text_font_size="26pt",
    major_label_text_color=INK_SOFT,
    title="-log₁₀(p-value)",
    title_text_font_size="28pt",
    title_text_font_style="italic",
    title_text_color=INK,
    title_standoff=12,
    width=30,
    location=(0, 0),
    padding=20,
    background_fill_color=ELEVATED_BG,
    background_fill_alpha=1,
)
plot.add_layout(color_bar, "right")

# Typography — canonical bokeh sizes for 3200×1800 canvas
plot.title.text_font_size = "50pt"
plot.title.text_color = INK
plot.xaxis.axis_label_text_font_size = "42pt"
plot.yaxis.axis_label_text_font_size = "42pt"
plot.xaxis.major_label_text_font_size = "34pt"
plot.yaxis.major_label_text_font_size = "34pt"
plot.xaxis.axis_label_text_color = INK
plot.yaxis.axis_label_text_color = INK
plot.xaxis.major_label_text_color = INK_SOFT
plot.yaxis.major_label_text_color = INK_SOFT
plot.xaxis.axis_line_color = INK_SOFT
plot.yaxis.axis_line_color = INK_SOFT
plot.xaxis.axis_line_width = 1.5
plot.yaxis.axis_line_width = 1.5
plot.xaxis.minor_tick_line_color = None
plot.yaxis.minor_tick_line_color = None
plot.xaxis.major_tick_line_color = INK_SOFT
plot.yaxis.major_tick_line_color = INK_SOFT

# Grid — y-axis only for cleaner look
plot.xgrid.grid_line_color = None
plot.ygrid.grid_line_color = INK
plot.ygrid.grid_line_alpha = 0.15

# Background and borders
plot.background_fill_color = PAGE_BG
plot.border_fill_color = PAGE_BG
plot.outline_line_color = None

# Legend
plot.legend.label_text_font_size = "28pt"
plot.legend.label_text_color = INK_SOFT
plot.legend.location = "top_left"
plot.legend.background_fill_color = ELEVATED_BG
plot.legend.border_line_color = INK_SOFT
plot.legend.border_line_width = 1
plot.legend.padding = 12
plot.legend.spacing = 8
plot.legend.margin = 15

# Output paths relative to this script's directory (so files land correctly
# regardless of the working directory the script is invoked from)
OUT_DIR = Path(__file__).parent
html_path = OUT_DIR / f"plot-{THEME}.html"
png_path = OUT_DIR / f"plot-{THEME}.png"

# Save interactive HTML
output_file(str(html_path))
save(plot, resources=CDN, title="MA Plot for Differential Expression")

# Screenshot via headless Chrome (export_png unavailable on this host)
# CDP viewport override ensures the screenshot is exactly W×H pixels, regardless
# of any virtual browser-chrome offset that --window-size alone doesn't eliminate.
W, H = 3200, 1800
opts = Options()
for arg in (
    "--headless=new",
    "--no-sandbox",
    "--disable-dev-shm-usage",
    "--disable-gpu",
    f"--window-size={W},{H}",
    "--hide-scrollbars",
    "--force-device-scale-factor=1",
):
    opts.add_argument(arg)
driver = webdriver.Chrome(options=opts)
driver.set_window_size(W, H)
driver.execute_cdp_cmd(
    "Emulation.setDeviceMetricsOverride", {"width": W, "height": H, "deviceScaleFactor": 1, "mobile": False}
)
driver.get(f"file://{html_path.resolve()}")
time.sleep(3)
driver.save_screenshot(str(png_path))
driver.quit()
Runnable source as JSON, for any HTTP client: https://api.anyplot.ai/specs/ma-differential-expression/bokeh/code. Any spec id and library id listed in llms-full.txt fit the same URL shape; every URL below is complete and callable.
{
  "spec_id": "ma-differential-expression",
  "language": "python",
  "library": "bokeh",
  "page": "https://anyplot.ai/ma-differential-expression/python/bokeh",
  "hub": "https://anyplot.ai/ma-differential-expression",
  "code_json": "https://api.anyplot.ai/specs/ma-differential-expression/bokeh/code",
  "spec_json": "https://api.anyplot.ai/specs/ma-differential-expression",
  "render_light_png": "https://storage.googleapis.com/anyplot-images/plots/ma-differential-expression/python/bokeh/plot-light.png",
  "render_dark_png": "https://storage.googleapis.com/anyplot-images/plots/ma-differential-expression/python/bokeh/plot-dark.png",
  "interactive_light_html": "https://storage.googleapis.com/anyplot-images/plots/ma-differential-expression/python/bokeh/plot-light.html",
  "interactive_dark_html": "https://storage.googleapis.com/anyplot-images/plots/ma-differential-expression/python/bokeh/plot-dark.html",
  "quality_score": 89.0,
  "license": "MIT",
  "guide": "https://anyplot.ai/llms.txt"
}
Part of MA Plot for Differential Expression on anyplot.ai.