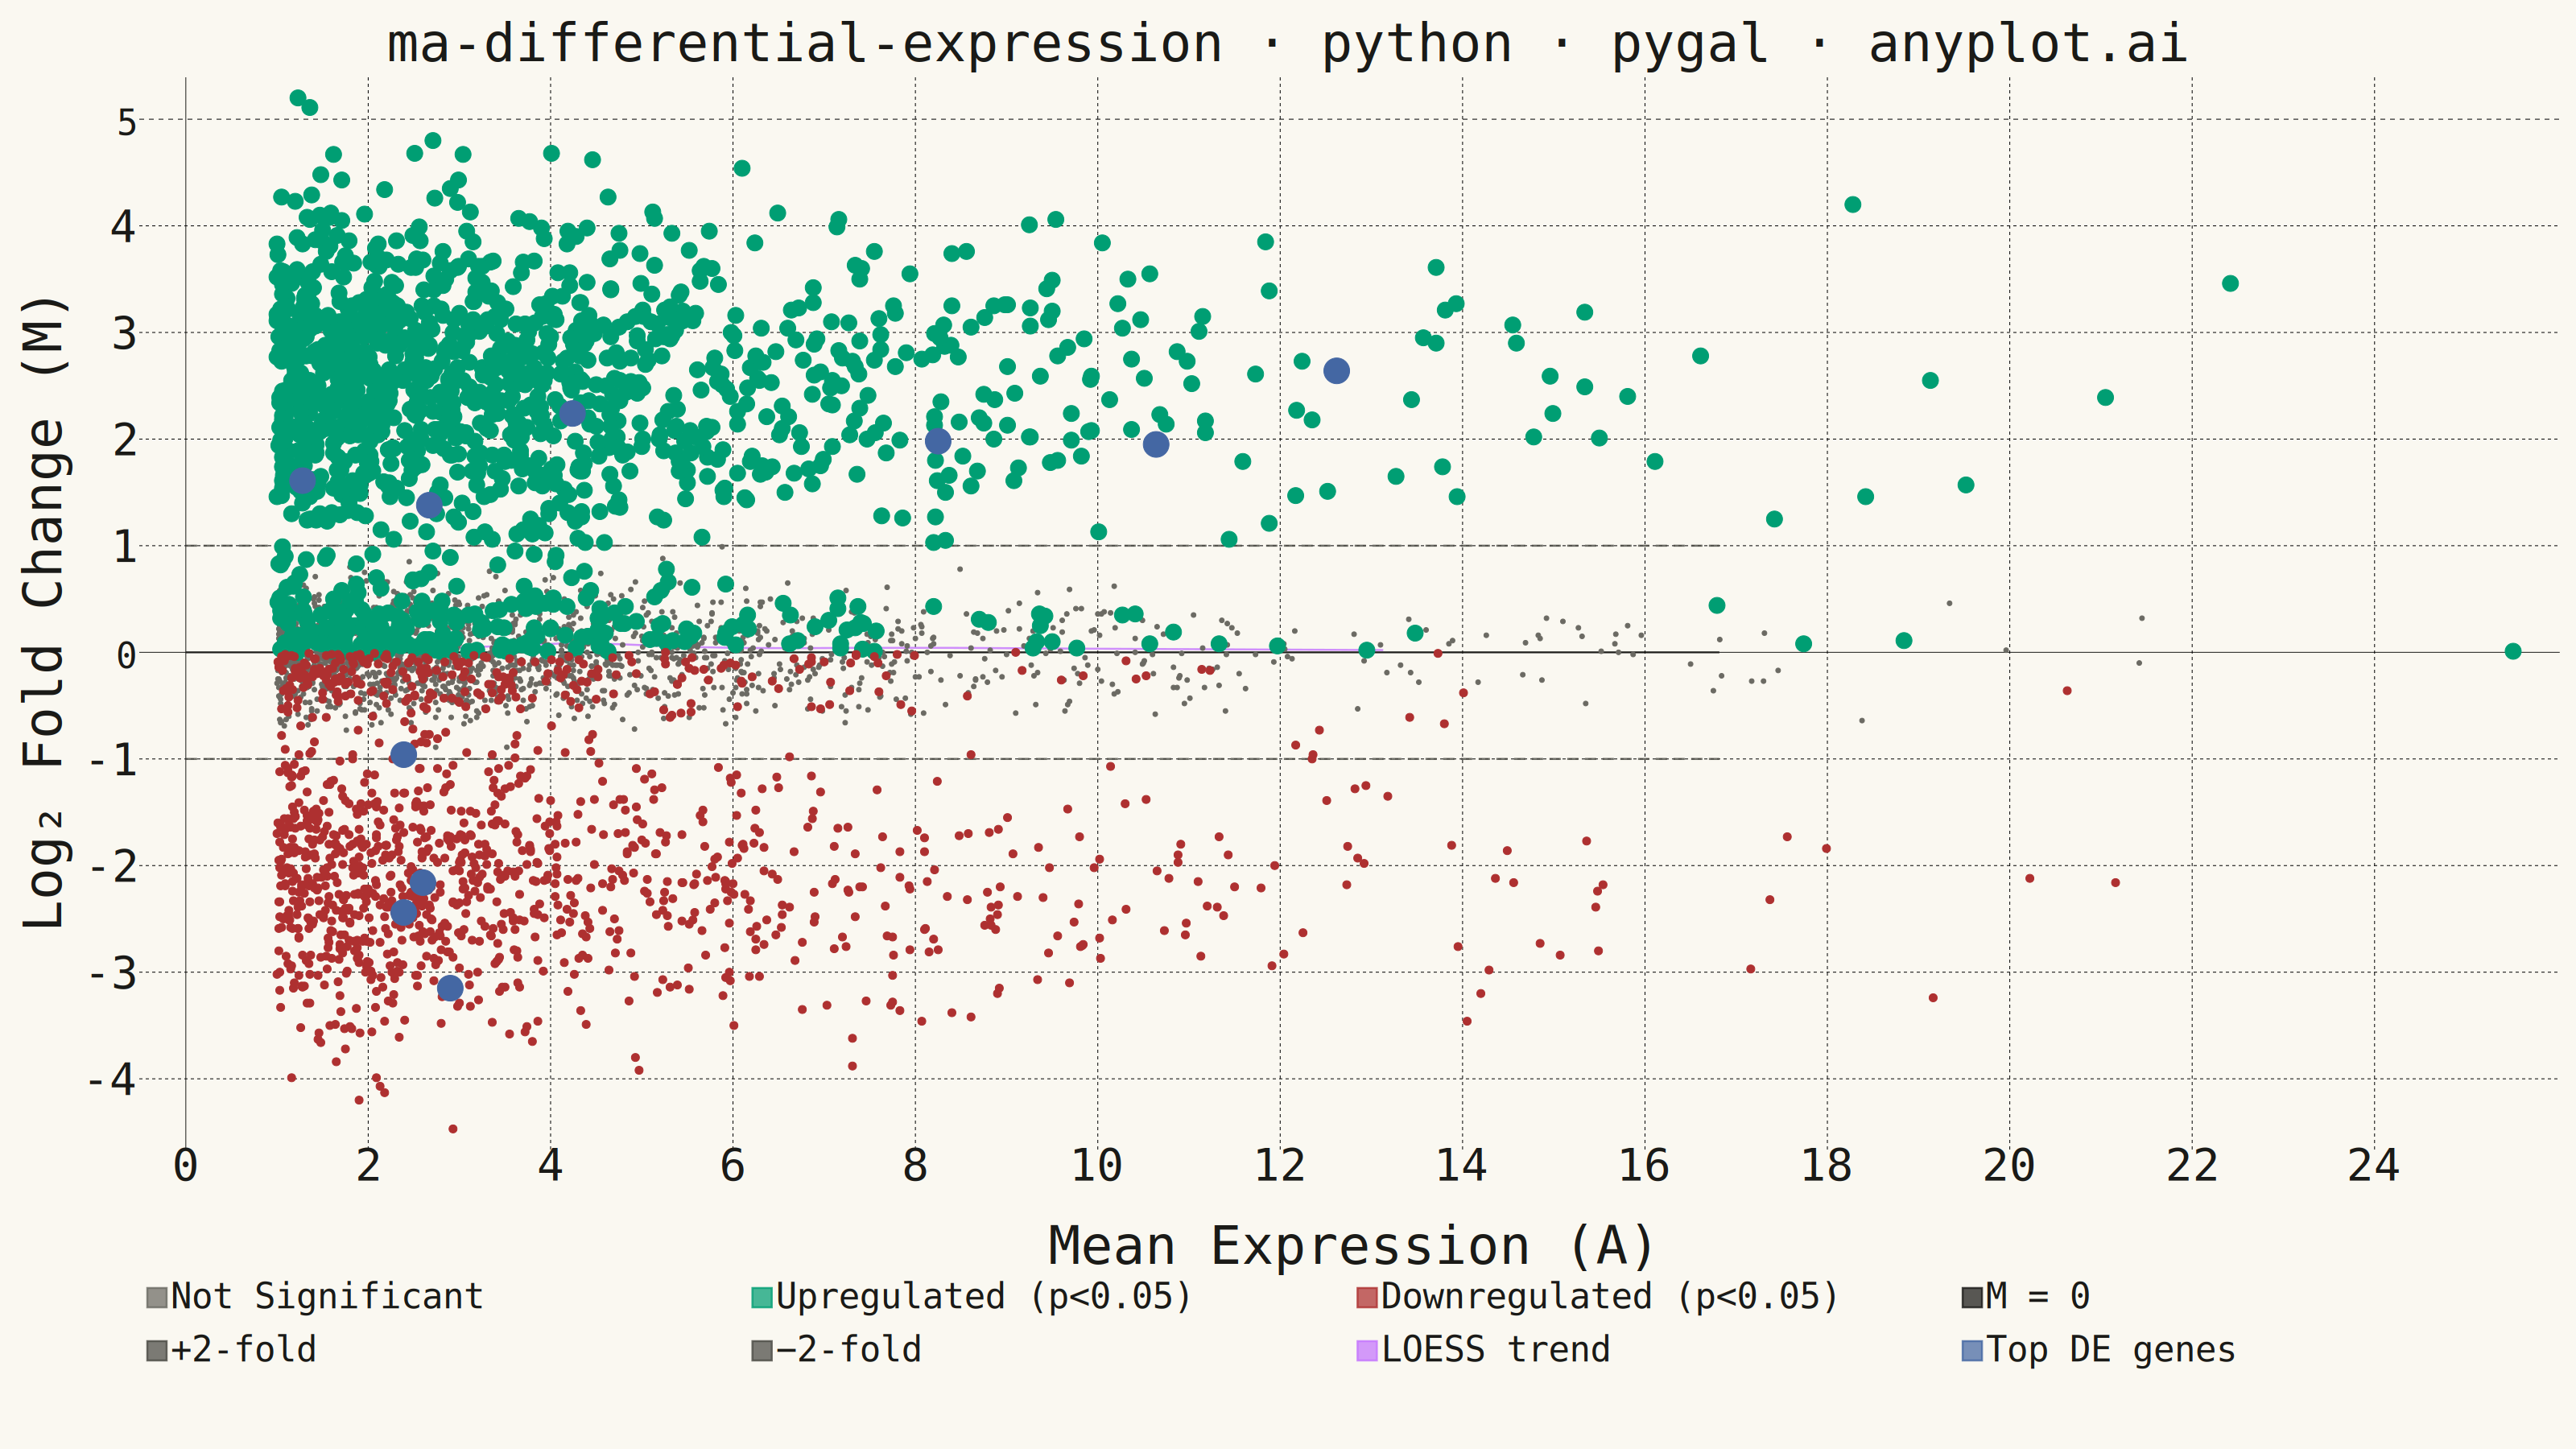
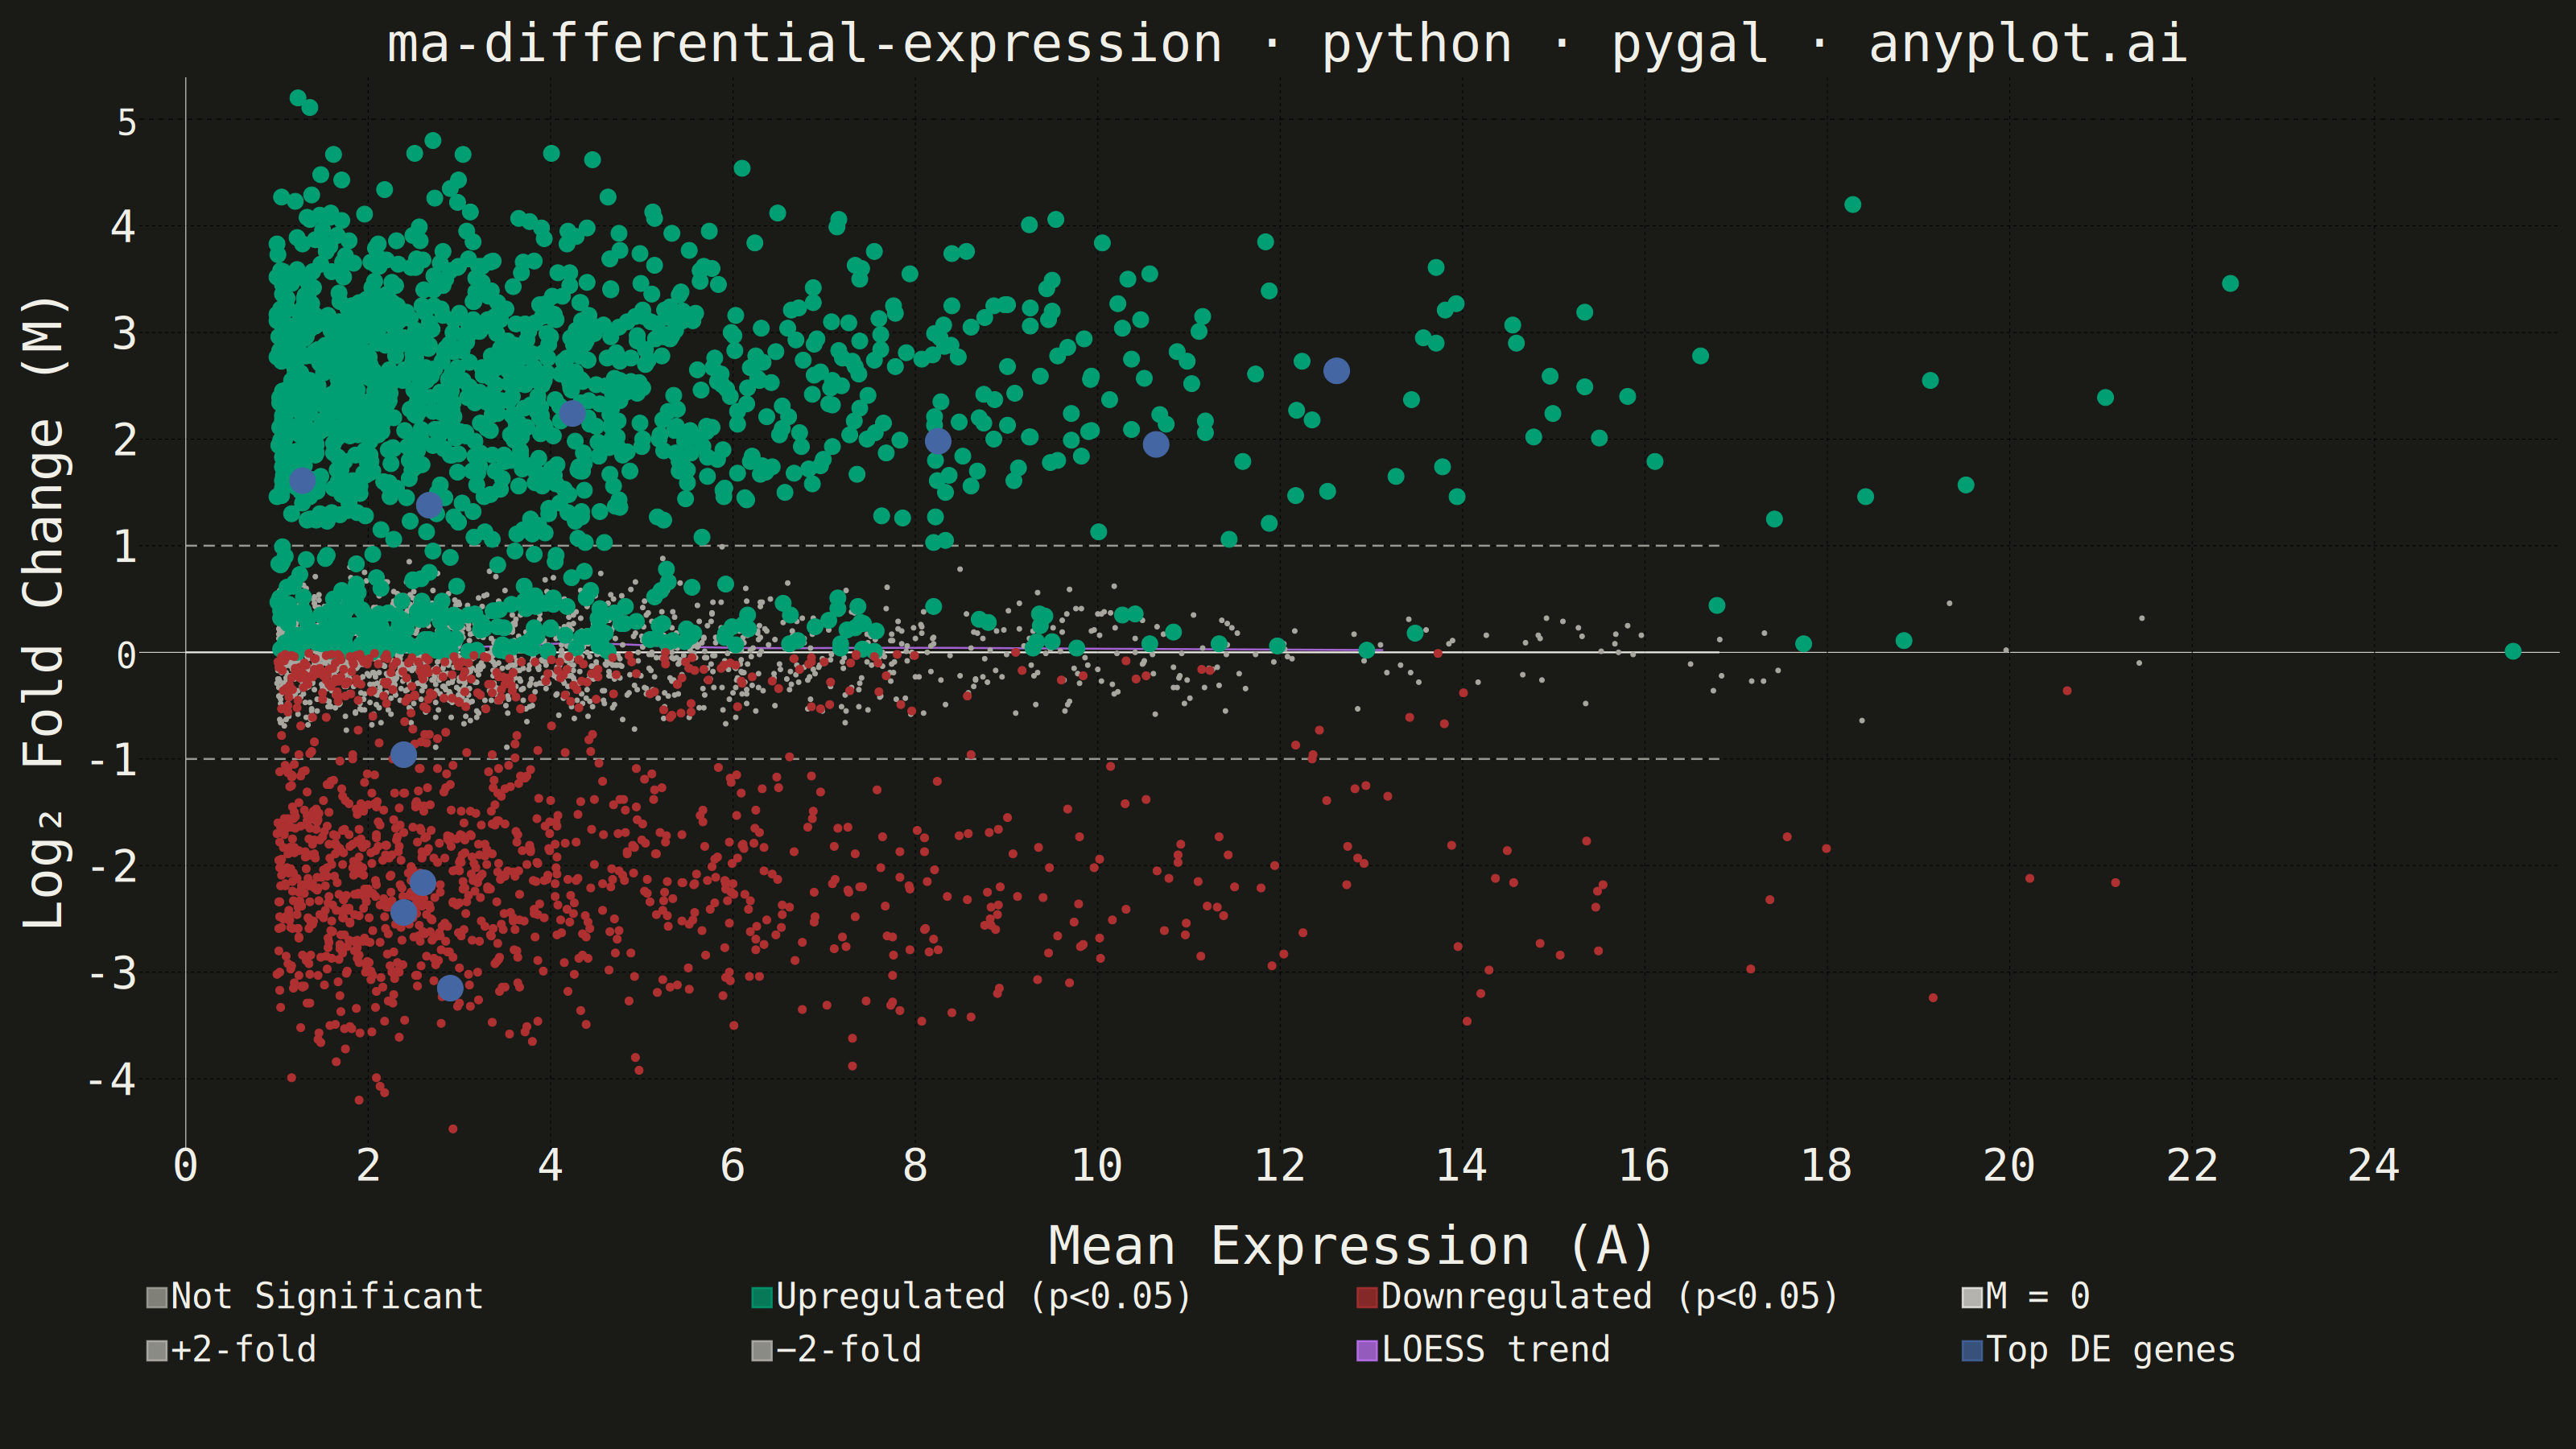
An MA plot (M-versus-A plot) visualizes the relationship between log fold change (M) and mean average expression (A) when comparing two experimental conditions. Each point represents a gene or feature, with significantly differentially expressed genes highlighted. This plot is a standard diagnostic tool in RNA-seq and microarray analysis for assessing differential expression results and detecting systematic expression-dependent bias.
""" anyplot.ai
ma-differential-expression: MA Plot for Differential Expression
Library: pygal 3.1.3 | Python 3.13.14
Quality: 86/100 | Updated: 2026-06-21
"""

import os
import sys


# Script filename shadows the installed pygal package when run as `python pygal.py`;
# dropping the script directory from sys.path lets the real package resolve.
sys.path.pop(0)

import numpy as np
import pygal
from pygal.style import Style


# Theme-adaptive chrome tokens (Imprint style guide)
THEME = os.getenv("ANYPLOT_THEME", "light")
PAGE_BG = "#FAF8F1" if THEME == "light" else "#1A1A17"
INK = "#1A1A17" if THEME == "light" else "#F0EFE8"
INK_SOFT = "#4A4A44" if THEME == "light" else "#B8B7B0"
INK_MUTED = "#6B6A63" if THEME == "light" else "#A8A79F"

# Semantic exception: upregulated → Imprint green (#009E73, up/gain),
# downregulated → Imprint matte red (#AE3030, loss/bad).
# Non-significant uses INK_MUTED (theme-adaptive muted anchor).
SERIES_COLORS = (
    INK_MUTED,  # non-significant (muted background layer)
    "#009E73",  # upregulated (Imprint green — semantic up/gain)
    "#AE3030",  # downregulated (Imprint matte red — semantic loss/bad)
    INK,  # M=0 reference line (neutral structural element)
    INK_SOFT,  # +2-fold dashed threshold
    INK_SOFT,  # -2-fold dashed threshold
    "#C475FD",  # LOESS trend (Imprint lavender)
    "#4467A3",  # top DE genes (Imprint blue)
)

# --- Data: Simulated RNA-seq differential expression results ---
np.random.seed(42)
n_genes = 15000

# Mean expression (A values) — log2 scale, typical RNA-seq range
mean_expression = np.random.exponential(scale=3, size=n_genes) + 1

# Log fold change (M values) — most genes near zero, some truly DE
log_fold_change = np.random.normal(0, 0.3, n_genes)

# Add truly differentially expressed genes (~8% up, ~7% down)
n_up = 1200
n_down = 1050
up_idx = np.random.choice(n_genes, n_up, replace=False)
remaining = np.setdiff1d(np.arange(n_genes), up_idx)
down_idx = np.random.choice(remaining, n_down, replace=False)

log_fold_change[up_idx] = np.random.normal(2.5, 0.8, n_up)
log_fold_change[down_idx] = np.random.normal(-2.2, 0.7, n_down)

# Simulate p-values (significant for DE genes, uniform noise otherwise)
p_values = np.ones(n_genes)
p_values[up_idx] = 10 ** (-np.random.uniform(2, 10, n_up))
p_values[down_idx] = 10 ** (-np.random.uniform(2, 10, n_down))
noise_idx = np.setdiff1d(np.arange(n_genes), np.concatenate([up_idx, down_idx]))
p_values[noise_idx] = np.random.uniform(0.01, 1.0, len(noise_idx))

significant = p_values < 0.05

# Notable gene names for the top most-significant hits
gene_names = [f"Gene{i}" for i in range(n_genes)]
top_genes = ["BRCA1", "TP53", "MYC", "EGFR", "KRAS", "PTEN", "CDK2", "RB1", "AKT1", "VEGFA"]
top_idx = np.argsort(p_values)[: len(top_genes)]
for i, name in zip(top_idx, top_genes, strict=False):
    gene_names[i] = name

# LOESS-like smoothing curve (binned moving average)
sort_order = np.argsort(mean_expression)
sorted_a = mean_expression[sort_order]
sorted_m = log_fold_change[sort_order]

n_bins = 30
bin_edges = np.percentile(sorted_a, np.linspace(0, 100, n_bins + 1))
raw_x: list[float] = []
raw_y: list[float] = []
for b in range(n_bins):
    mask = (sorted_a >= bin_edges[b]) & (sorted_a < bin_edges[b + 1])
    if mask.sum() > 20:
        raw_x.append(float(np.median(sorted_a[mask])))
        raw_y.append(float(np.mean(sorted_m[mask])))

smooth_y = np.array(raw_y)
for _ in range(4):
    smoothed = np.copy(smooth_y)
    for j in range(1, len(smoothed) - 1):
        smoothed[j] = (smooth_y[j - 1] + smooth_y[j] + smooth_y[j + 1]) / 3
    smooth_y = smoothed
smooth_x = raw_x

# --- Subsample for SVG rendering performance ---
np.random.seed(42)
sig_indices = np.where(significant)[0]
nonsig_indices = np.where(~significant)[0]
nonsig_sample = np.random.choice(nonsig_indices, min(1800, len(nonsig_indices)), replace=False)

nonsig_points = []
for i in nonsig_sample:
    nonsig_points.append(
        {
            "value": (round(float(mean_expression[i]), 2), round(float(log_fold_change[i]), 2)),
            "label": f"{gene_names[i]} | A={mean_expression[i]:.1f}, M={log_fold_change[i]:.2f}, p={p_values[i]:.2e}",
        }
    )

top_idx_set = set(top_idx.tolist())
sig_up_points = []
sig_down_points = []
for i in sig_indices:
    if i in top_idx_set:
        continue
    point = {
        "value": (round(float(mean_expression[i]), 2), round(float(log_fold_change[i]), 2)),
        "label": f"{gene_names[i]} | A={mean_expression[i]:.1f}, M={log_fold_change[i]:.2f}, p={p_values[i]:.2e}",
    }
    if log_fold_change[i] > 0:
        sig_up_points.append(point)
    else:
        sig_down_points.append(point)

# Top 10 most-significant DE genes — star marker in tooltip
labeled_points = []
for i in top_idx:
    labeled_points.append(
        {
            "value": (round(float(mean_expression[i]), 2), round(float(log_fold_change[i]), 2)),
            "label": f"★ {gene_names[i]} | A={mean_expression[i]:.1f}, M={log_fold_change[i]:.2f}, p={p_values[i]:.2e}",
        }
    )

x_min = 0
x_max = float(np.percentile(mean_expression, 99.5))

# --- Style: Imprint palette + theme-adaptive chrome ---
custom_style = Style(
    background=PAGE_BG,
    plot_background=PAGE_BG,
    foreground=INK,
    foreground_strong=INK,
    foreground_subtle=INK_SOFT,
    colors=SERIES_COLORS,
    title_font_size=66,
    label_font_size=56,
    major_label_font_size=44,
    legend_font_size=44,
    value_font_size=36,
    stroke_width=2.5,
    opacity=0.72,
    opacity_hover=0.95,
)

# --- Chart (landscape 3200×1800 — canonical size) ---
chart = pygal.XY(
    width=3200,
    height=1800,
    style=custom_style,
    title="ma-differential-expression · python · pygal · anyplot.ai",
    x_title="Mean Expression (A)",
    y_title="Log₂ Fold Change (M)",
    show_legend=True,
    legend_at_bottom=True,
    legend_at_bottom_columns=4,
    legend_box_size=24,
    dots_size=5,
    stroke=False,
    show_x_guides=True,
    show_y_guides=True,
    truncate_legend=-1,
    print_values=False,
    dynamic_print_values=True,
    js=[],
    x_label_rotation=0,
    margin_bottom=110,
)

# Non-significant genes — muted background cloud
chart.add("Not Significant", nonsig_points, dots_size=3)

# Upregulated significant — Imprint green; larger dots than downregulated for CVD redundancy
chart.add("Upregulated (p<0.05)", sig_up_points, dots_size=10)

# Downregulated significant — Imprint matte red; smaller to distinguish from upregulated
chart.add("Downregulated (p<0.05)", sig_down_points, dots_size=5)

# M = 0 reference line (no change)
chart.add("M = 0", [(x_min, 0), (x_max, 0)], stroke=True, show_dots=False, stroke_style={"width": 5})

# M = +1 threshold (2-fold up)
chart.add(
    "+2-fold", [(x_min, 1), (x_max, 1)], stroke=True, show_dots=False, stroke_style={"width": 4, "dasharray": "14, 8"}
)

# M = -1 threshold (2-fold down)
chart.add(
    "−2-fold", [(x_min, -1), (x_max, -1)], stroke=True, show_dots=False, stroke_style={"width": 4, "dasharray": "14, 8"}
)

# LOESS smoothing curve — Imprint lavender; no dots so the curve stands out from scatter
chart.add(
    "LOESS trend",
    [(round(x, 2), round(y, 3)) for x, y in zip(smooth_x, smooth_y, strict=False)],
    stroke=True,
    show_dots=False,
    stroke_style={"width": 11},
)

# Top DE genes — Imprint blue, large prominent dots
chart.add("Top DE genes", labeled_points, dots_size=16, stroke=False)

# --- Save ---
with open(f"plot-{THEME}.html", "wb") as f:
    f.write(chart.render())
chart.render_to_png(f"plot-{THEME}.png")
Runnable source as JSON, for any HTTP client: https://api.anyplot.ai/specs/ma-differential-expression/pygal/code. Any spec id and library id listed in llms-full.txt fit the same URL shape; every URL below is complete and callable.
{
  "spec_id": "ma-differential-expression",
  "language": "python",
  "library": "pygal",
  "page": "https://anyplot.ai/ma-differential-expression/python/pygal",
  "hub": "https://anyplot.ai/ma-differential-expression",
  "code_json": "https://api.anyplot.ai/specs/ma-differential-expression/pygal/code",
  "spec_json": "https://api.anyplot.ai/specs/ma-differential-expression",
  "render_light_png": "https://storage.googleapis.com/anyplot-images/plots/ma-differential-expression/python/pygal/plot-light.png",
  "render_dark_png": "https://storage.googleapis.com/anyplot-images/plots/ma-differential-expression/python/pygal/plot-dark.png",
  "interactive_light_html": "https://storage.googleapis.com/anyplot-images/plots/ma-differential-expression/python/pygal/plot-light.html",
  "interactive_dark_html": "https://storage.googleapis.com/anyplot-images/plots/ma-differential-expression/python/pygal/plot-dark.html",
  "quality_score": 86.0,
  "license": "MIT",
  "guide": "https://anyplot.ai/llms.txt"
}
Part of MA Plot for Differential Expression on anyplot.ai.