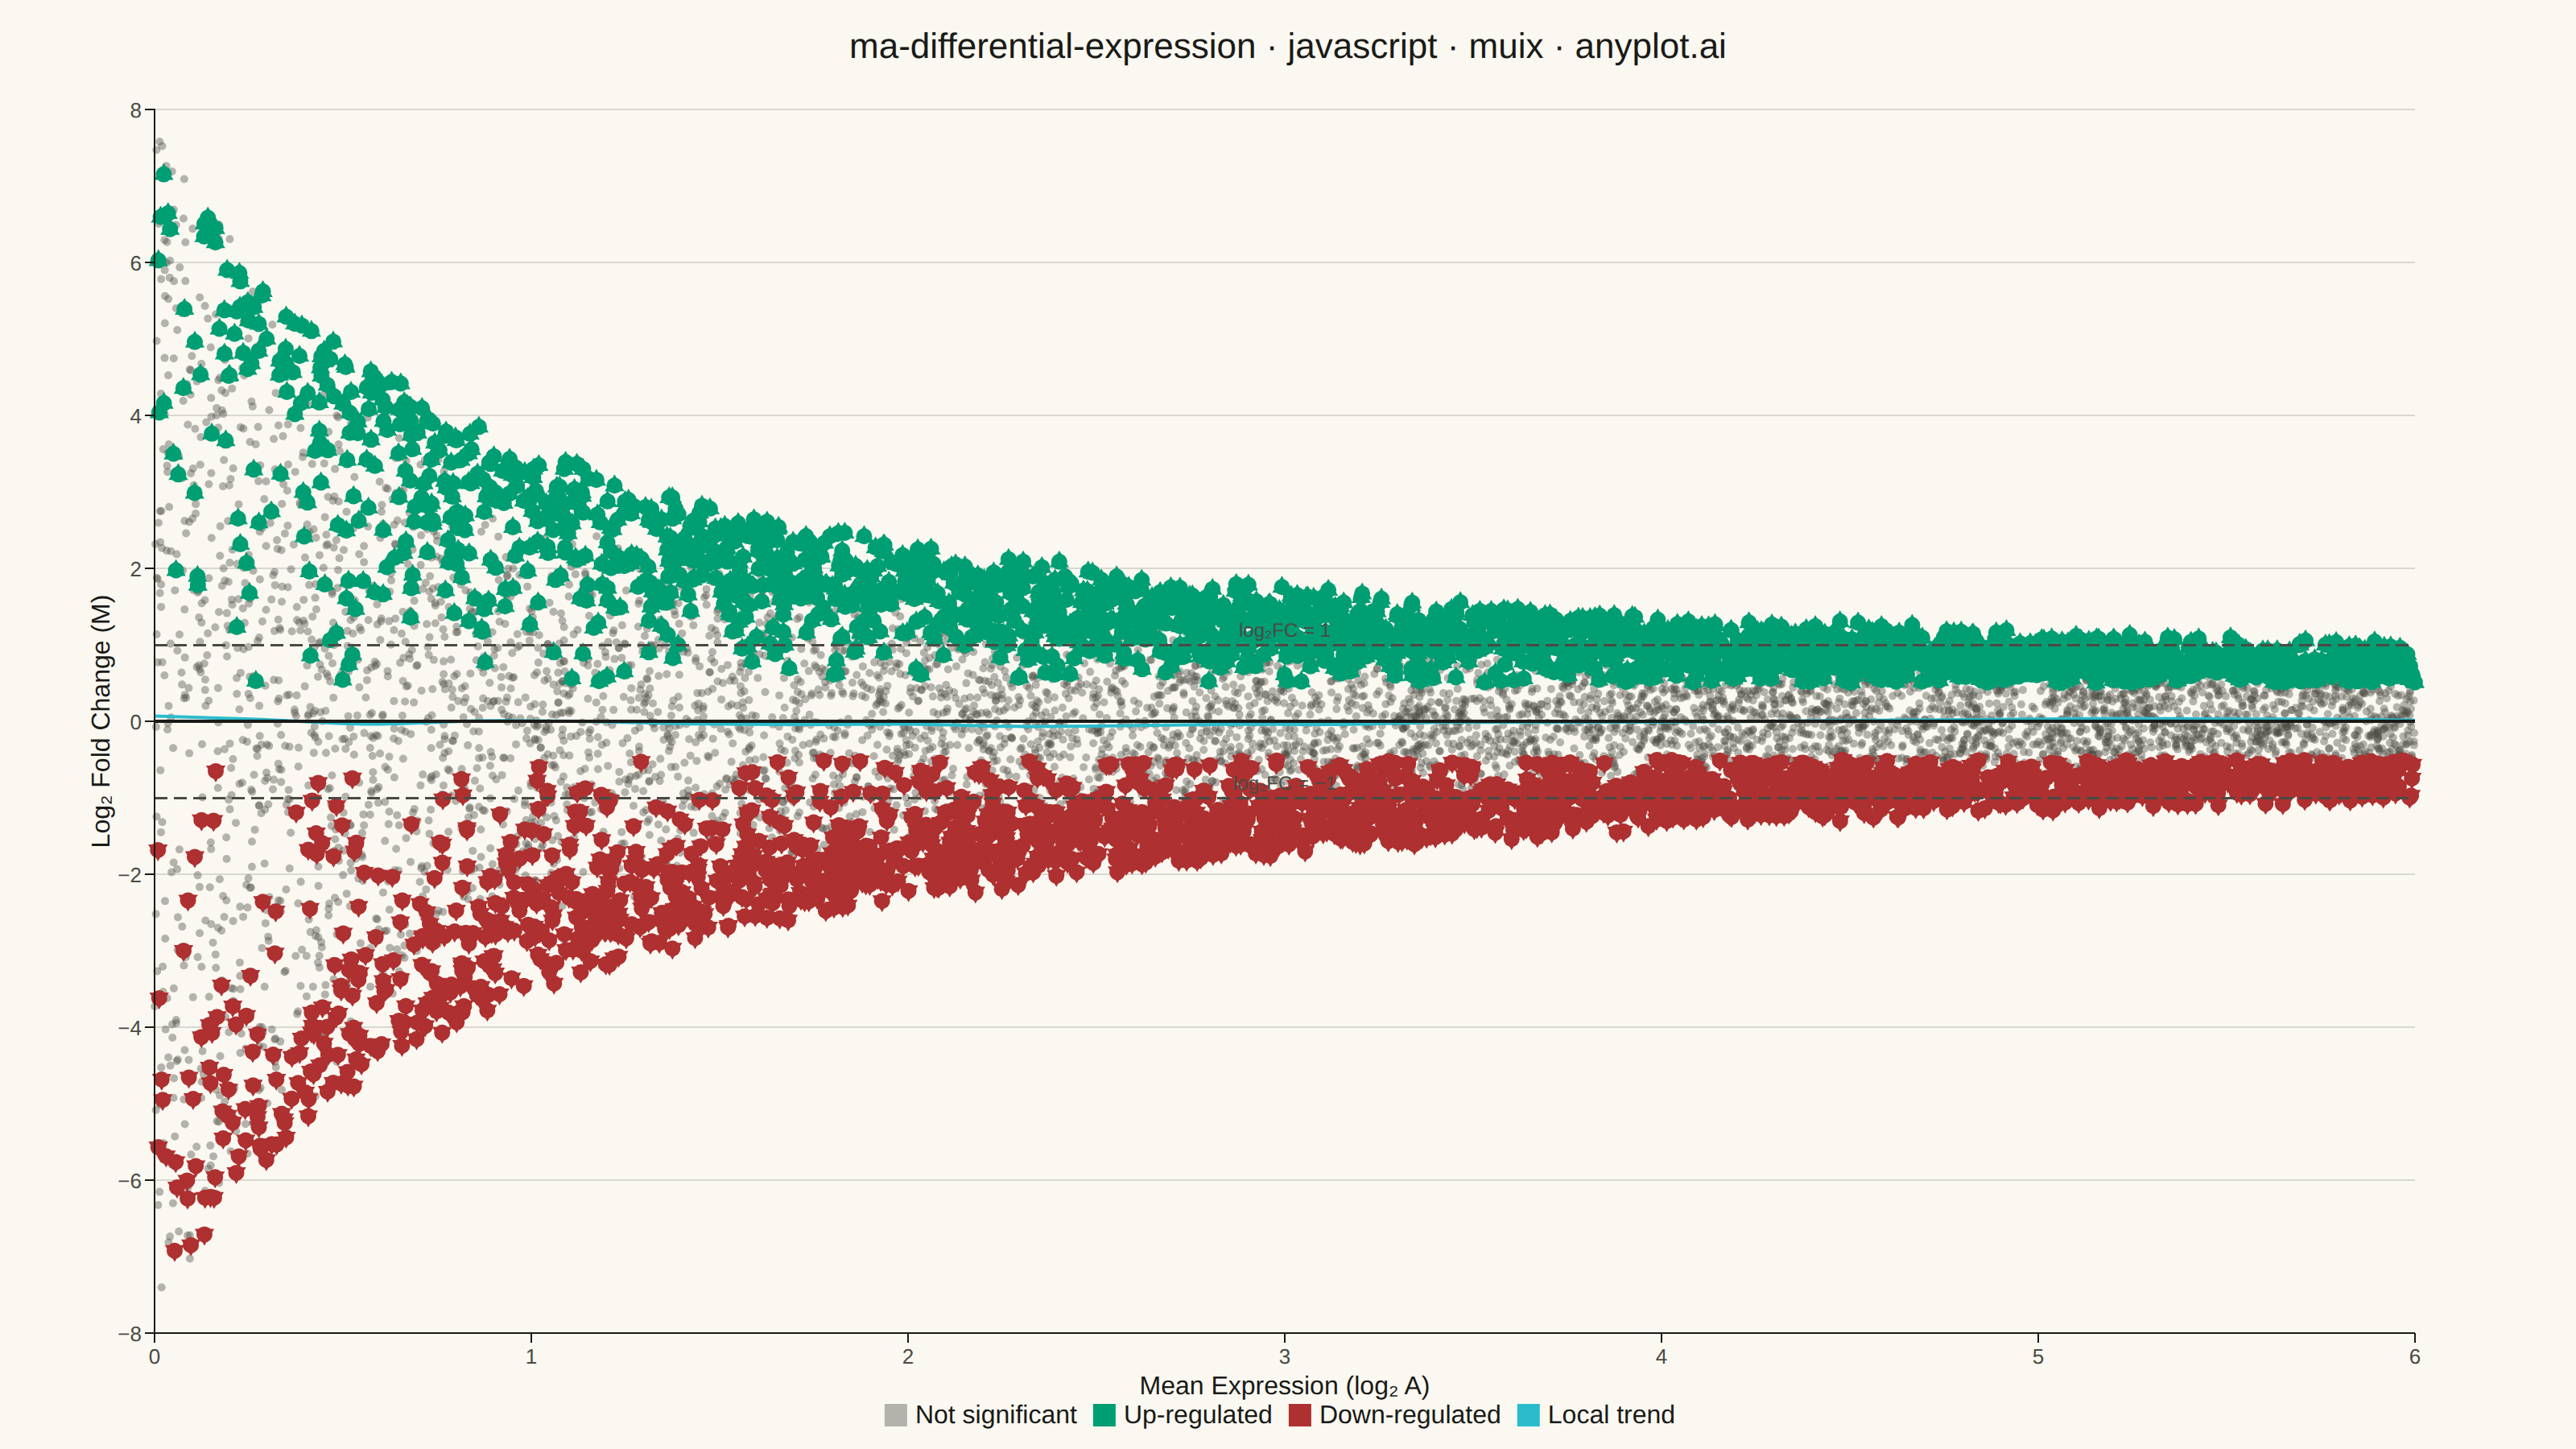
The same plot in 14 other libraries — JavaScript: Chart.js, D3.js, Apache ECharts, Highcharts; Python: Altair, Bokeh, lets-plot, Matplotlib, Plotly, plotnine, Pygal, Seaborn; R: ggplot2; Julia: Makie.jl. Compare all 15 side by side: MA Plot for Differential Expression in Python, R, Julia and JavaScript.
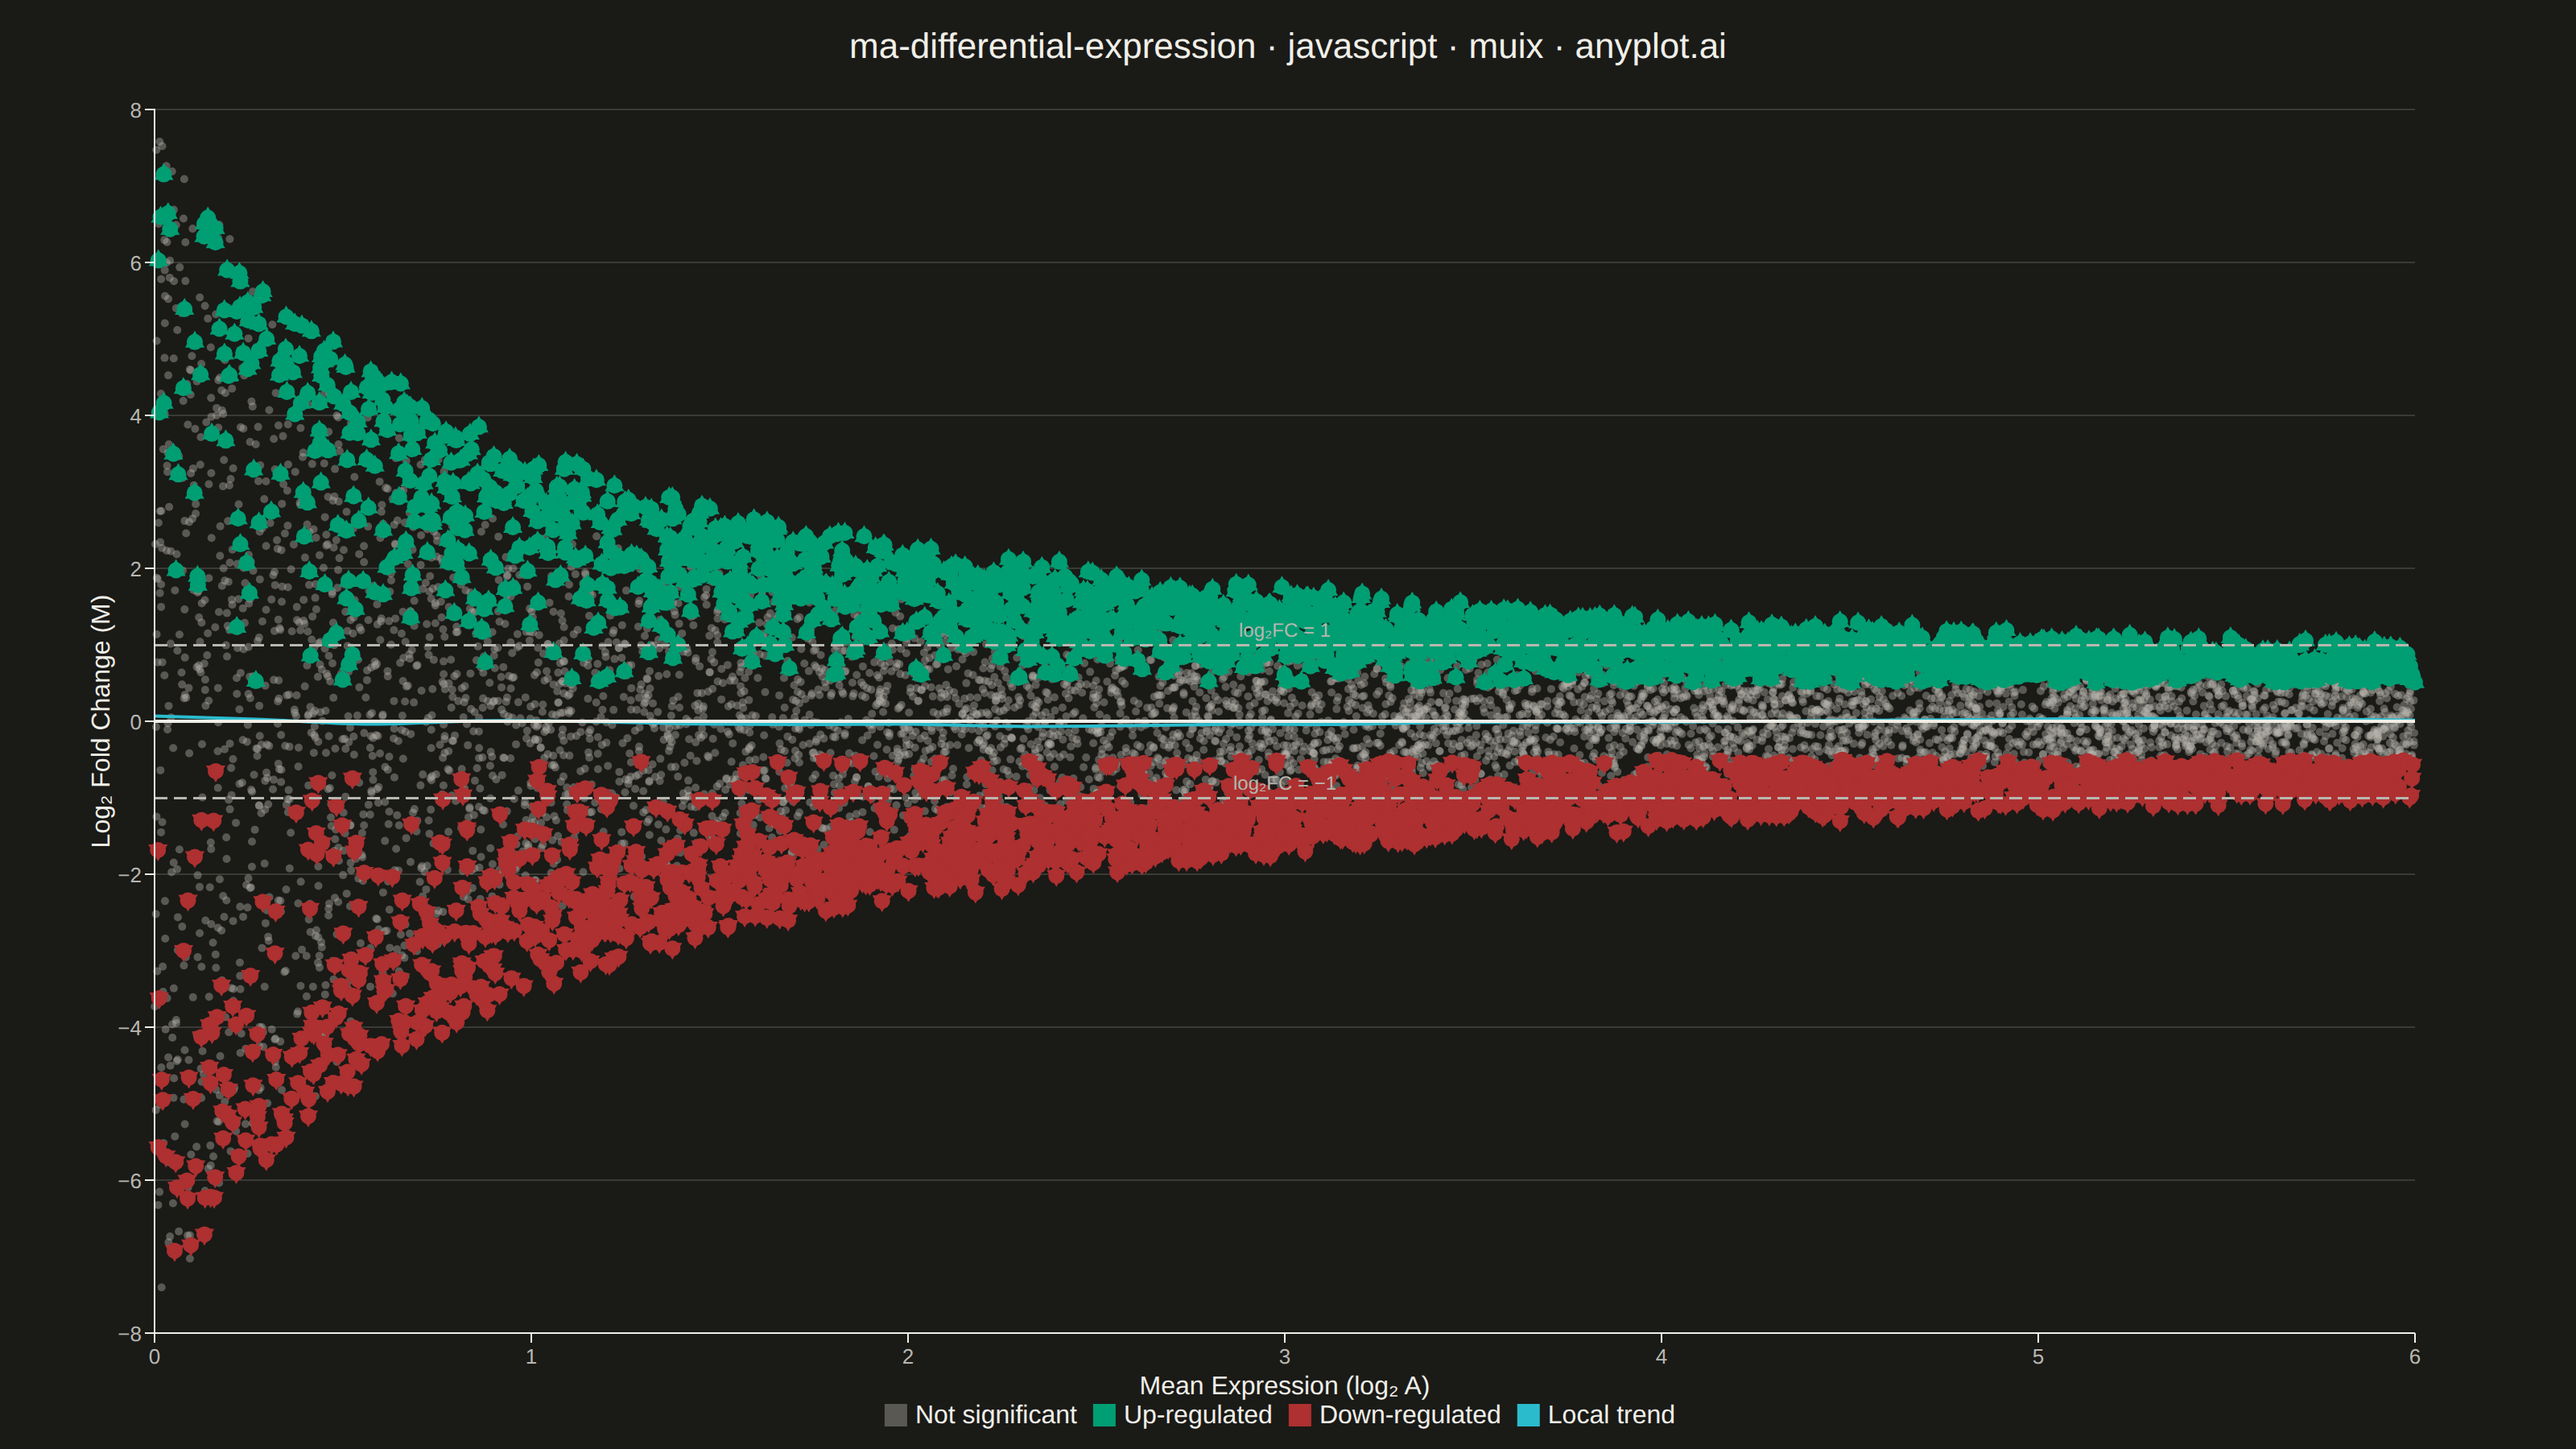
An MA plot (M-versus-A plot) visualizes the relationship between log fold change (M) and mean average expression (A) when comparing two experimental conditions. Each point represents a gene or feature, with significantly differentially expressed genes highlighted. This plot is a standard diagnostic tool in RNA-seq and microarray analysis for assessing differential expression results and detecting systematic expression-dependent bias.
// anyplot.ai
// ma-differential-expression: MA Plot for Differential Expression
// Library: muix 7.29.1 | JavaScript 22.22.3
// Quality: 87/100 | Created: 2026-06-21
//# anyplot-orientation: landscape
// anyplot.ai
// ma-differential-expression: MA Plot for Differential Expression
// Library: MUI X Charts | React | Node 22
// License: @mui/x-charts — MIT (community). Pro/Premium are out of scope.
// Quality: 87/100 | Created: 2026-06-21

import Box from "@mui/material/Box";
import Typography from "@mui/material/Typography";
import { ChartContainer } from "@mui/x-charts/ChartContainer";
import { ScatterPlot } from "@mui/x-charts/ScatterChart";
import { LinePlot } from "@mui/x-charts/LineChart";
import { ChartsAxis } from "@mui/x-charts/ChartsAxis";
import { ChartsLegend } from "@mui/x-charts/ChartsLegend";
import { ChartsReferenceLine } from "@mui/x-charts/ChartsReferenceLine";
import { ChartsGrid } from "@mui/x-charts/ChartsGrid";
import { useDrawingArea } from "@mui/x-charts/hooks";

const t = window.ANYPLOT_TOKENS;

// --- Deterministic LCG RNG (seed=42) ---
let _s = 42;
const rand = () => {
  _s = (1664525 * _s + 1013904223) >>> 0;
  return _s / 0x100000000;
};

// --- Simulated RNA-seq differential expression data (MA plot) ---
// A = mean log2 expression across conditions (x), M = log2 fold change (y)
const N_GENES = 10000; // spec-typical whole-transcriptome size
const X_MIN = 0;
const X_MAX = 6;
const Y_MIN = -8;
const Y_MAX = 8;

const allGenes = Array.from({ length: N_GENES }, (_, i) => {
  const a = rand() * X_MAX;
  // Classic MA funnel: higher dispersion at low expression
  const dispersion = 2.5 / (a + 0.8);
  const m = (rand() - 0.5) * 5 * dispersion + (rand() - 0.5) * 0.3;
  // Significance: strong LFC combined with adequate expression
  const padj = Math.exp(-Math.abs(m) * (a + 0.3) * 0.8) * rand();
  const sig = padj < 0.05 && Math.abs(m) > 0.5;
  return { id: i, x: a, y: m, sig };
});

// Split into three scatter series
const notSig = allGenes
  .filter((g) => !g.sig)
  .map(({ id, x, y }) => ({ id, x, y }));
const upReg = allGenes
  .filter((g) => g.sig && g.y > 0)
  .map(({ id, x, y }) => ({ id, x, y }));
const downReg = allGenes
  .filter((g) => g.sig && g.y <= 0)
  .map(({ id, x, y }) => ({ id, x, y }));

// --- Windowed average smoothing (approximates LOESS trend) ---
const N_BINS = 22;
const smooth = Array.from({ length: N_BINS }, (_, b) => {
  const cx = X_MIN + ((b + 0.5) * (X_MAX - X_MIN)) / N_BINS;
  const bw = ((X_MAX - X_MIN) / N_BINS) * 2.2;
  const pts = allGenes.filter((g) => Math.abs(g.x - cx) < bw);
  if (pts.length < 5) return null;
  return { x: cx, y: pts.reduce((s, g) => s + g.y, 0) / pts.length };
}).filter(Boolean);

const SMOOTH_X = smooth.map((p) => p.x);
const SMOOTH_Y = smooth.map((p) => p.y);

// Semi-transparent color for non-significant genes (8-char hex = RRGGBBAA)
const NOT_SIG_COLOR = t.inkSoft + "66"; // ~40% opacity

// Triangle overlays for significant genes: adds shape as a second CVD-safe channel
// (color alone is insufficient for protanope/deuteranope users).
// Uses useDrawingArea to map data → pixel coordinates inside the ChartContainer SVG.
const SignificantMarks = () => {
  const { left, top, width: dw, height: dh } = useDrawingArea();
  const scaleX = (a) => left + ((a - X_MIN) / (X_MAX - X_MIN)) * dw;
  const scaleY = (m) => top + ((Y_MAX - m) / (Y_MAX - Y_MIN)) * dh;

  const R = 7; // circumradius slightly larger than markerSize=5 circles so triangle corners are clearly visible
  const H = R * 0.866; // R * sin(60°)

  return (
    <g>
      {upReg.map((p) => {
        const x = scaleX(p.x);
        const y = scaleY(p.y);
        // Equilateral triangle, apex pointing up
        return (
          <polygon
            key={p.id}
            points={`${x},${y - R} ${x - H},${y + R * 0.5} ${x + H},${y + R * 0.5}`}
            fill={t.palette[0]}
          />
        );
      })}
      {downReg.map((p) => {
        const x = scaleX(p.x);
        const y = scaleY(p.y);
        // Equilateral triangle, apex pointing down
        return (
          <polygon
            key={p.id}
            points={`${x},${y + R} ${x - H},${y - R * 0.5} ${x + H},${y - R * 0.5}`}
            fill={t.palette[4]}
          />
        );
      })}
    </g>
  );
};

export default function Chart() {
  const { width, height } = window.ANYPLOT_SIZE;
  const TITLE_H = 56;
  const chartH = height - TITLE_H;

  return (
    <Box
      sx={{
        width,
        height,
        display: "flex",
        flexDirection: "column",
        bgcolor: "background.default",
      }}
    >
      <Typography
        sx={{
          height: TITLE_H,
          display: "flex",
          alignItems: "center",
          justifyContent: "center",
          fontSize: 22,
          fontWeight: 500,
          color: "text.primary",
          px: 4,
          flexShrink: 0,
        }}
      >
        ma-differential-expression · javascript · muix · anyplot.ai
      </Typography>

      <ChartContainer
        width={width}
        height={chartH}
        skipAnimation
        margin={{ top: 12, right: 100, bottom: 72, left: 96 }}
        series={[
          {
            type: "scatter",
            id: "notSig",
            label: "Not significant",
            data: notSig,
            color: NOT_SIG_COLOR,
            markerSize: 2.5,
            xAxisId: "x",
            yAxisId: "y",
          },
          {
            type: "scatter",
            id: "upReg",
            label: "Up-regulated",
            data: upReg,
            color: t.palette[0], // #009E73 brand green — semantic: up
            markerSize: 5,
            xAxisId: "x",
            yAxisId: "y",
          },
          {
            type: "scatter",
            id: "downReg",
            label: "Down-regulated",
            data: downReg,
            color: t.palette[4], // #AE3030 matte red — semantic: down
            markerSize: 5,
            xAxisId: "x",
            yAxisId: "y",
          },
          {
            type: "line",
            id: "trend",
            label: "Local trend",
            data: SMOOTH_Y,
            color: t.palette[5], // #2ABCCD cyan
            showMark: false,
            xAxisId: "xSmooth",
            yAxisId: "y",
            curve: "catmullRom",
          },
        ]}
        xAxis={[
          {
            id: "x",
            scaleType: "linear",
            min: X_MIN,
            max: X_MAX,
            label: "Mean Expression (log₂ A)",
            labelStyle: { fontSize: 16, fill: t.ink },
            tickLabelStyle: { fontSize: 13, fill: t.inkSoft },
            tickNumber: 7,
          },
          {
            id: "xSmooth",
            scaleType: "point",
            data: SMOOTH_X,
            min: X_MIN,
            max: X_MAX,
            hide: true,
          },
        ]}
        yAxis={[
          {
            id: "y",
            scaleType: "linear",
            min: Y_MIN,
            max: Y_MAX,
            label: "Log₂ Fold Change (M)",
            labelStyle: { fontSize: 16, fill: t.ink },
            tickLabelStyle: { fontSize: 13, fill: t.inkSoft },
            tickNumber: 9,
          },
        ]}
      >
        <ChartsGrid horizontal />
        <ScatterPlot />
        <SignificantMarks />
        <LinePlot />
        <ChartsReferenceLine
          y={0}
          yAxisId="y"
          lineStyle={{ stroke: t.ink, strokeWidth: 2 }}
        />
        <ChartsReferenceLine
          y={1}
          yAxisId="y"
          lineStyle={{
            stroke: t.inkSoft,
            strokeWidth: 1.5,
            strokeDasharray: "8 4",
          }}
          label="log₂FC = 1"
          labelStyle={{ fontSize: 12, fill: t.inkSoft }}
        />
        <ChartsReferenceLine
          y={-1}
          yAxisId="y"
          lineStyle={{
            stroke: t.inkSoft,
            strokeWidth: 1.5,
            strokeDasharray: "8 4",
          }}
          label="log₂FC = −1"
          labelStyle={{ fontSize: 12, fill: t.inkSoft }}
        />
        <ChartsLegend
          position={{ vertical: "bottom", horizontal: "middle" }}
          itemMarkWidth={14}
          itemMarkHeight={14}
          padding={8}
        />
        <ChartsAxis />
      </ChartContainer>
    </Box>
  );
}
Runnable source as JSON, for any HTTP client: https://api.anyplot.ai/specs/ma-differential-expression/muix/code. Any spec id and library id listed in llms-full.txt fit the same URL shape; every URL below is complete and callable.
{
  "spec_id": "ma-differential-expression",
  "language": "javascript",
  "library": "muix",
  "page": "https://anyplot.ai/ma-differential-expression/javascript/muix",
  "hub": "https://anyplot.ai/ma-differential-expression",
  "code_json": "https://api.anyplot.ai/specs/ma-differential-expression/muix/code",
  "spec_json": "https://api.anyplot.ai/specs/ma-differential-expression",
  "render_light_png": "https://storage.googleapis.com/anyplot-images/plots/ma-differential-expression/javascript/muix/plot-light.png",
  "render_dark_png": "https://storage.googleapis.com/anyplot-images/plots/ma-differential-expression/javascript/muix/plot-dark.png",
  "interactive_light_html": "https://storage.googleapis.com/anyplot-images/plots/ma-differential-expression/javascript/muix/plot-light.html",
  "interactive_dark_html": "https://storage.googleapis.com/anyplot-images/plots/ma-differential-expression/javascript/muix/plot-dark.html",
  "quality_score": 87.0,
  "license": "MIT",
  "guide": "https://anyplot.ai/llms.txt"
}
Part of MA Plot for Differential Expression on anyplot.ai.