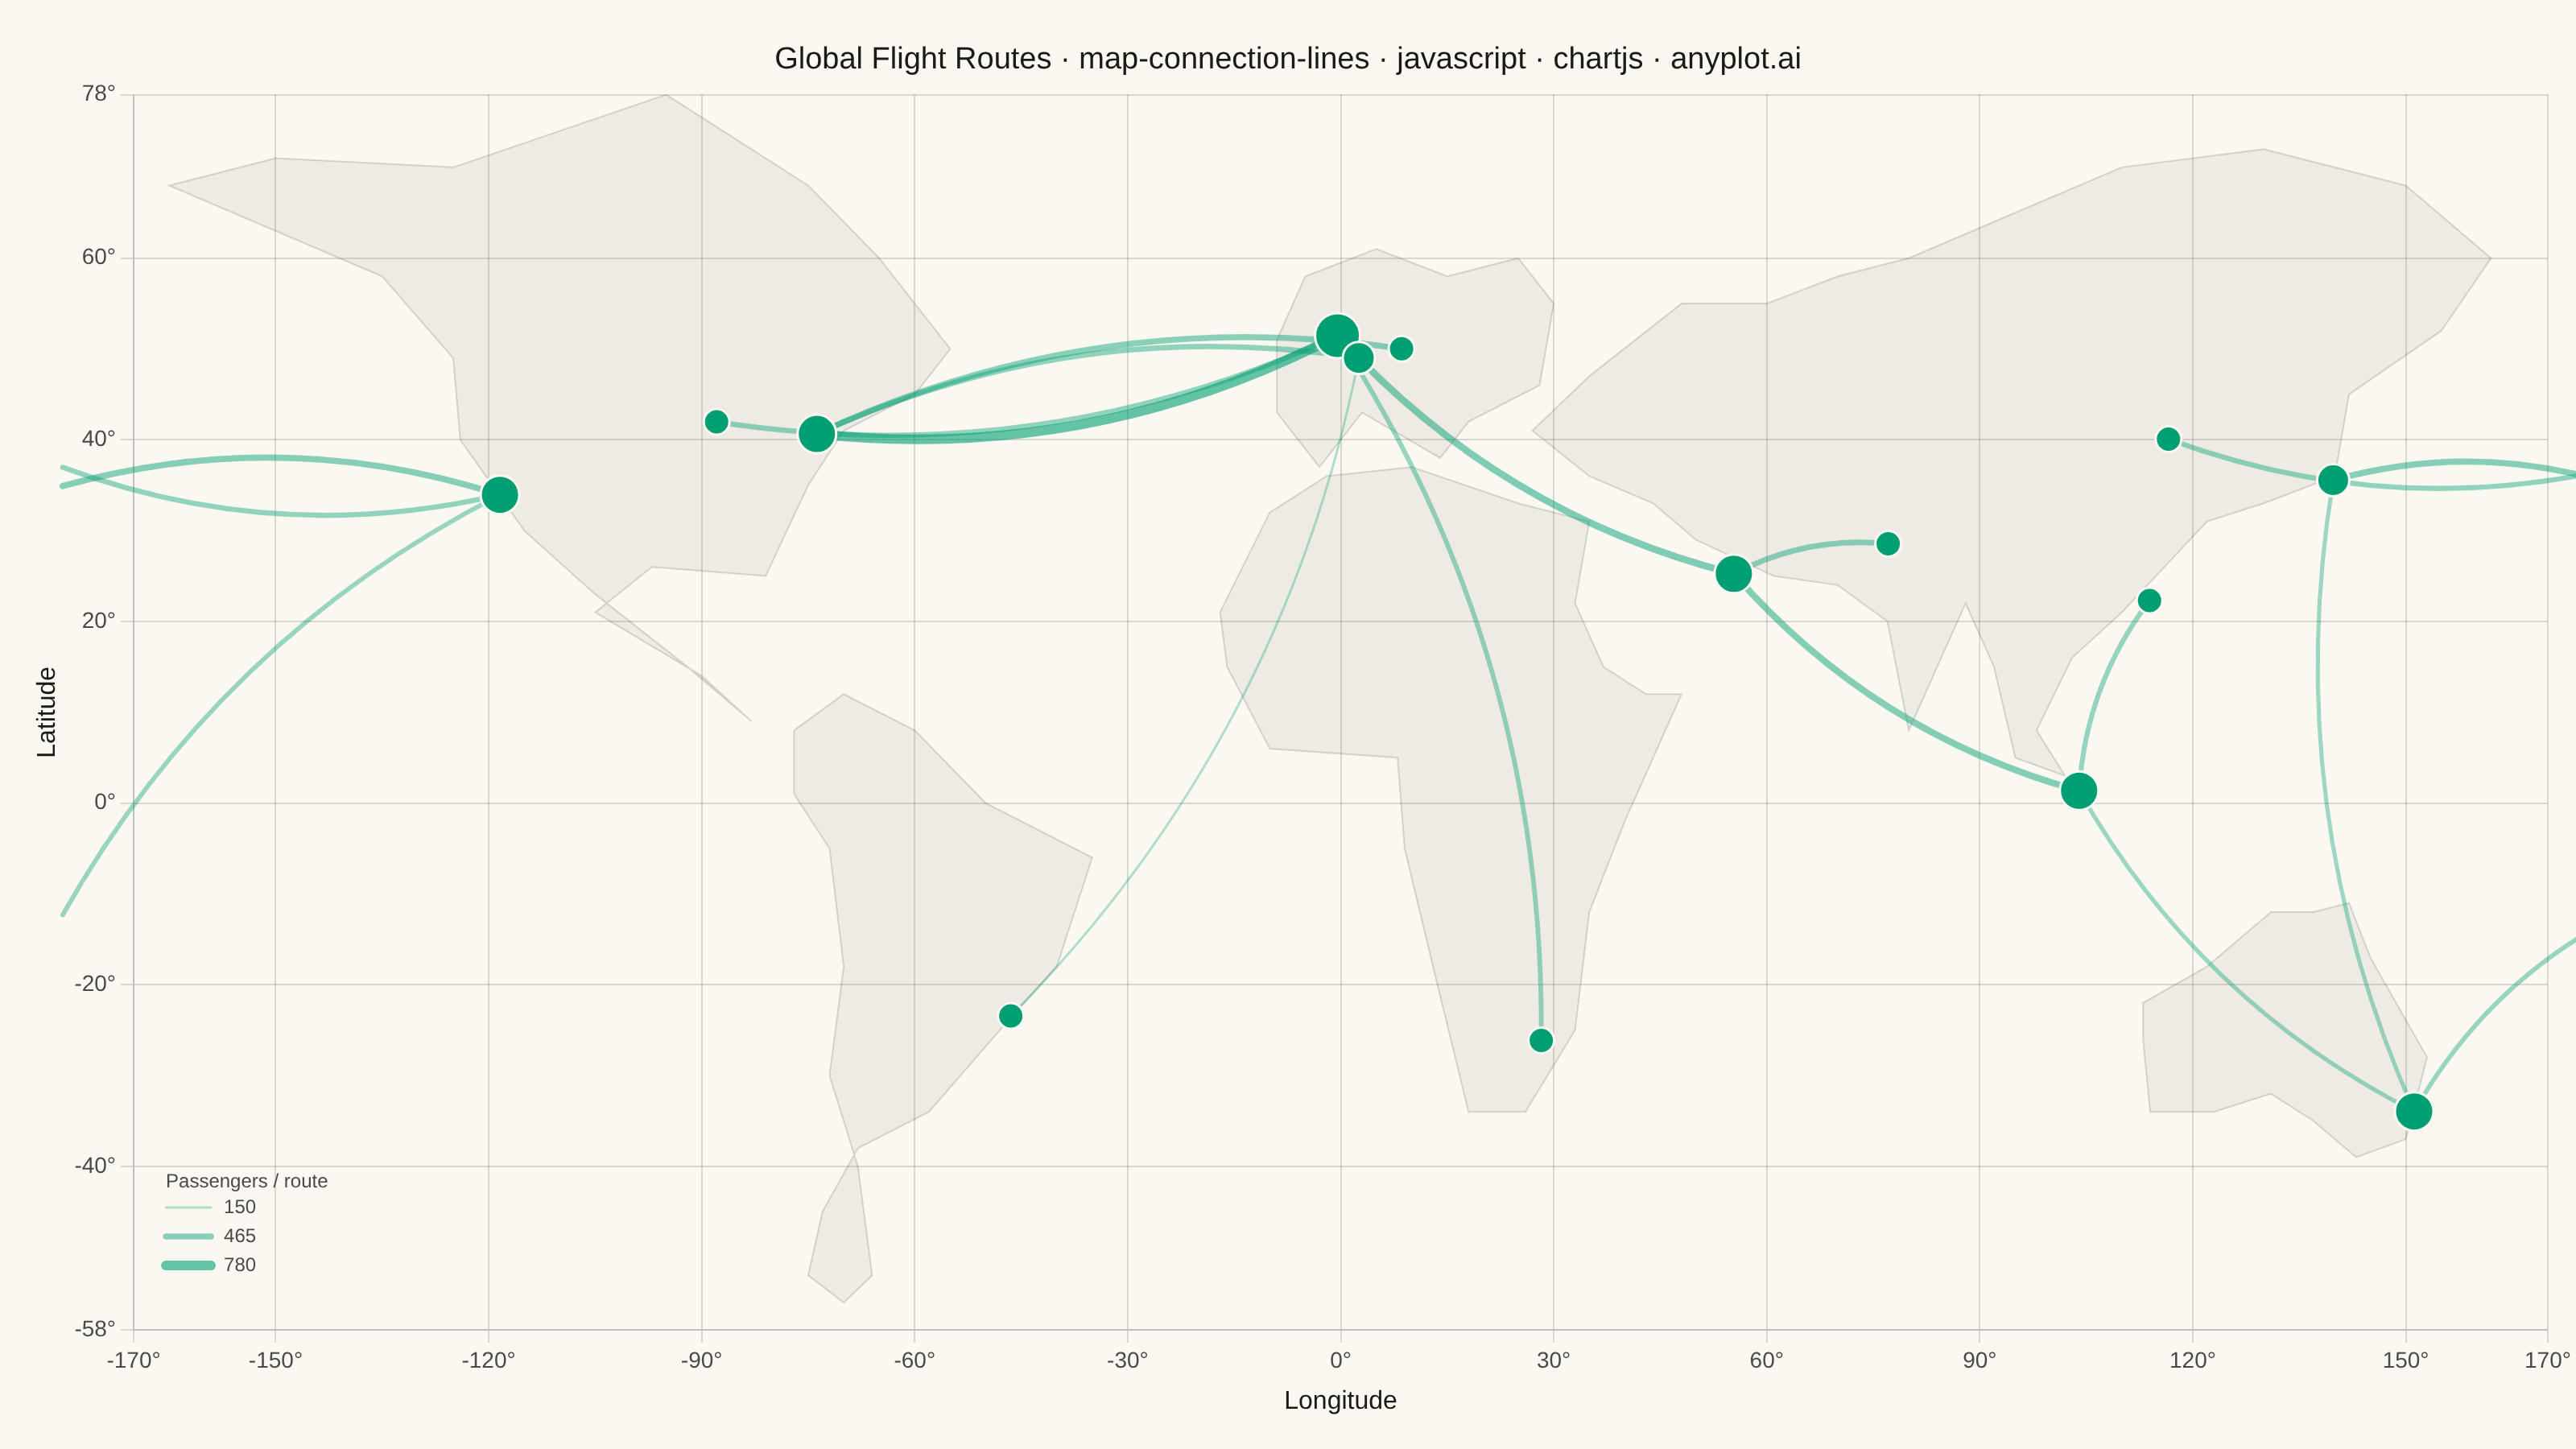
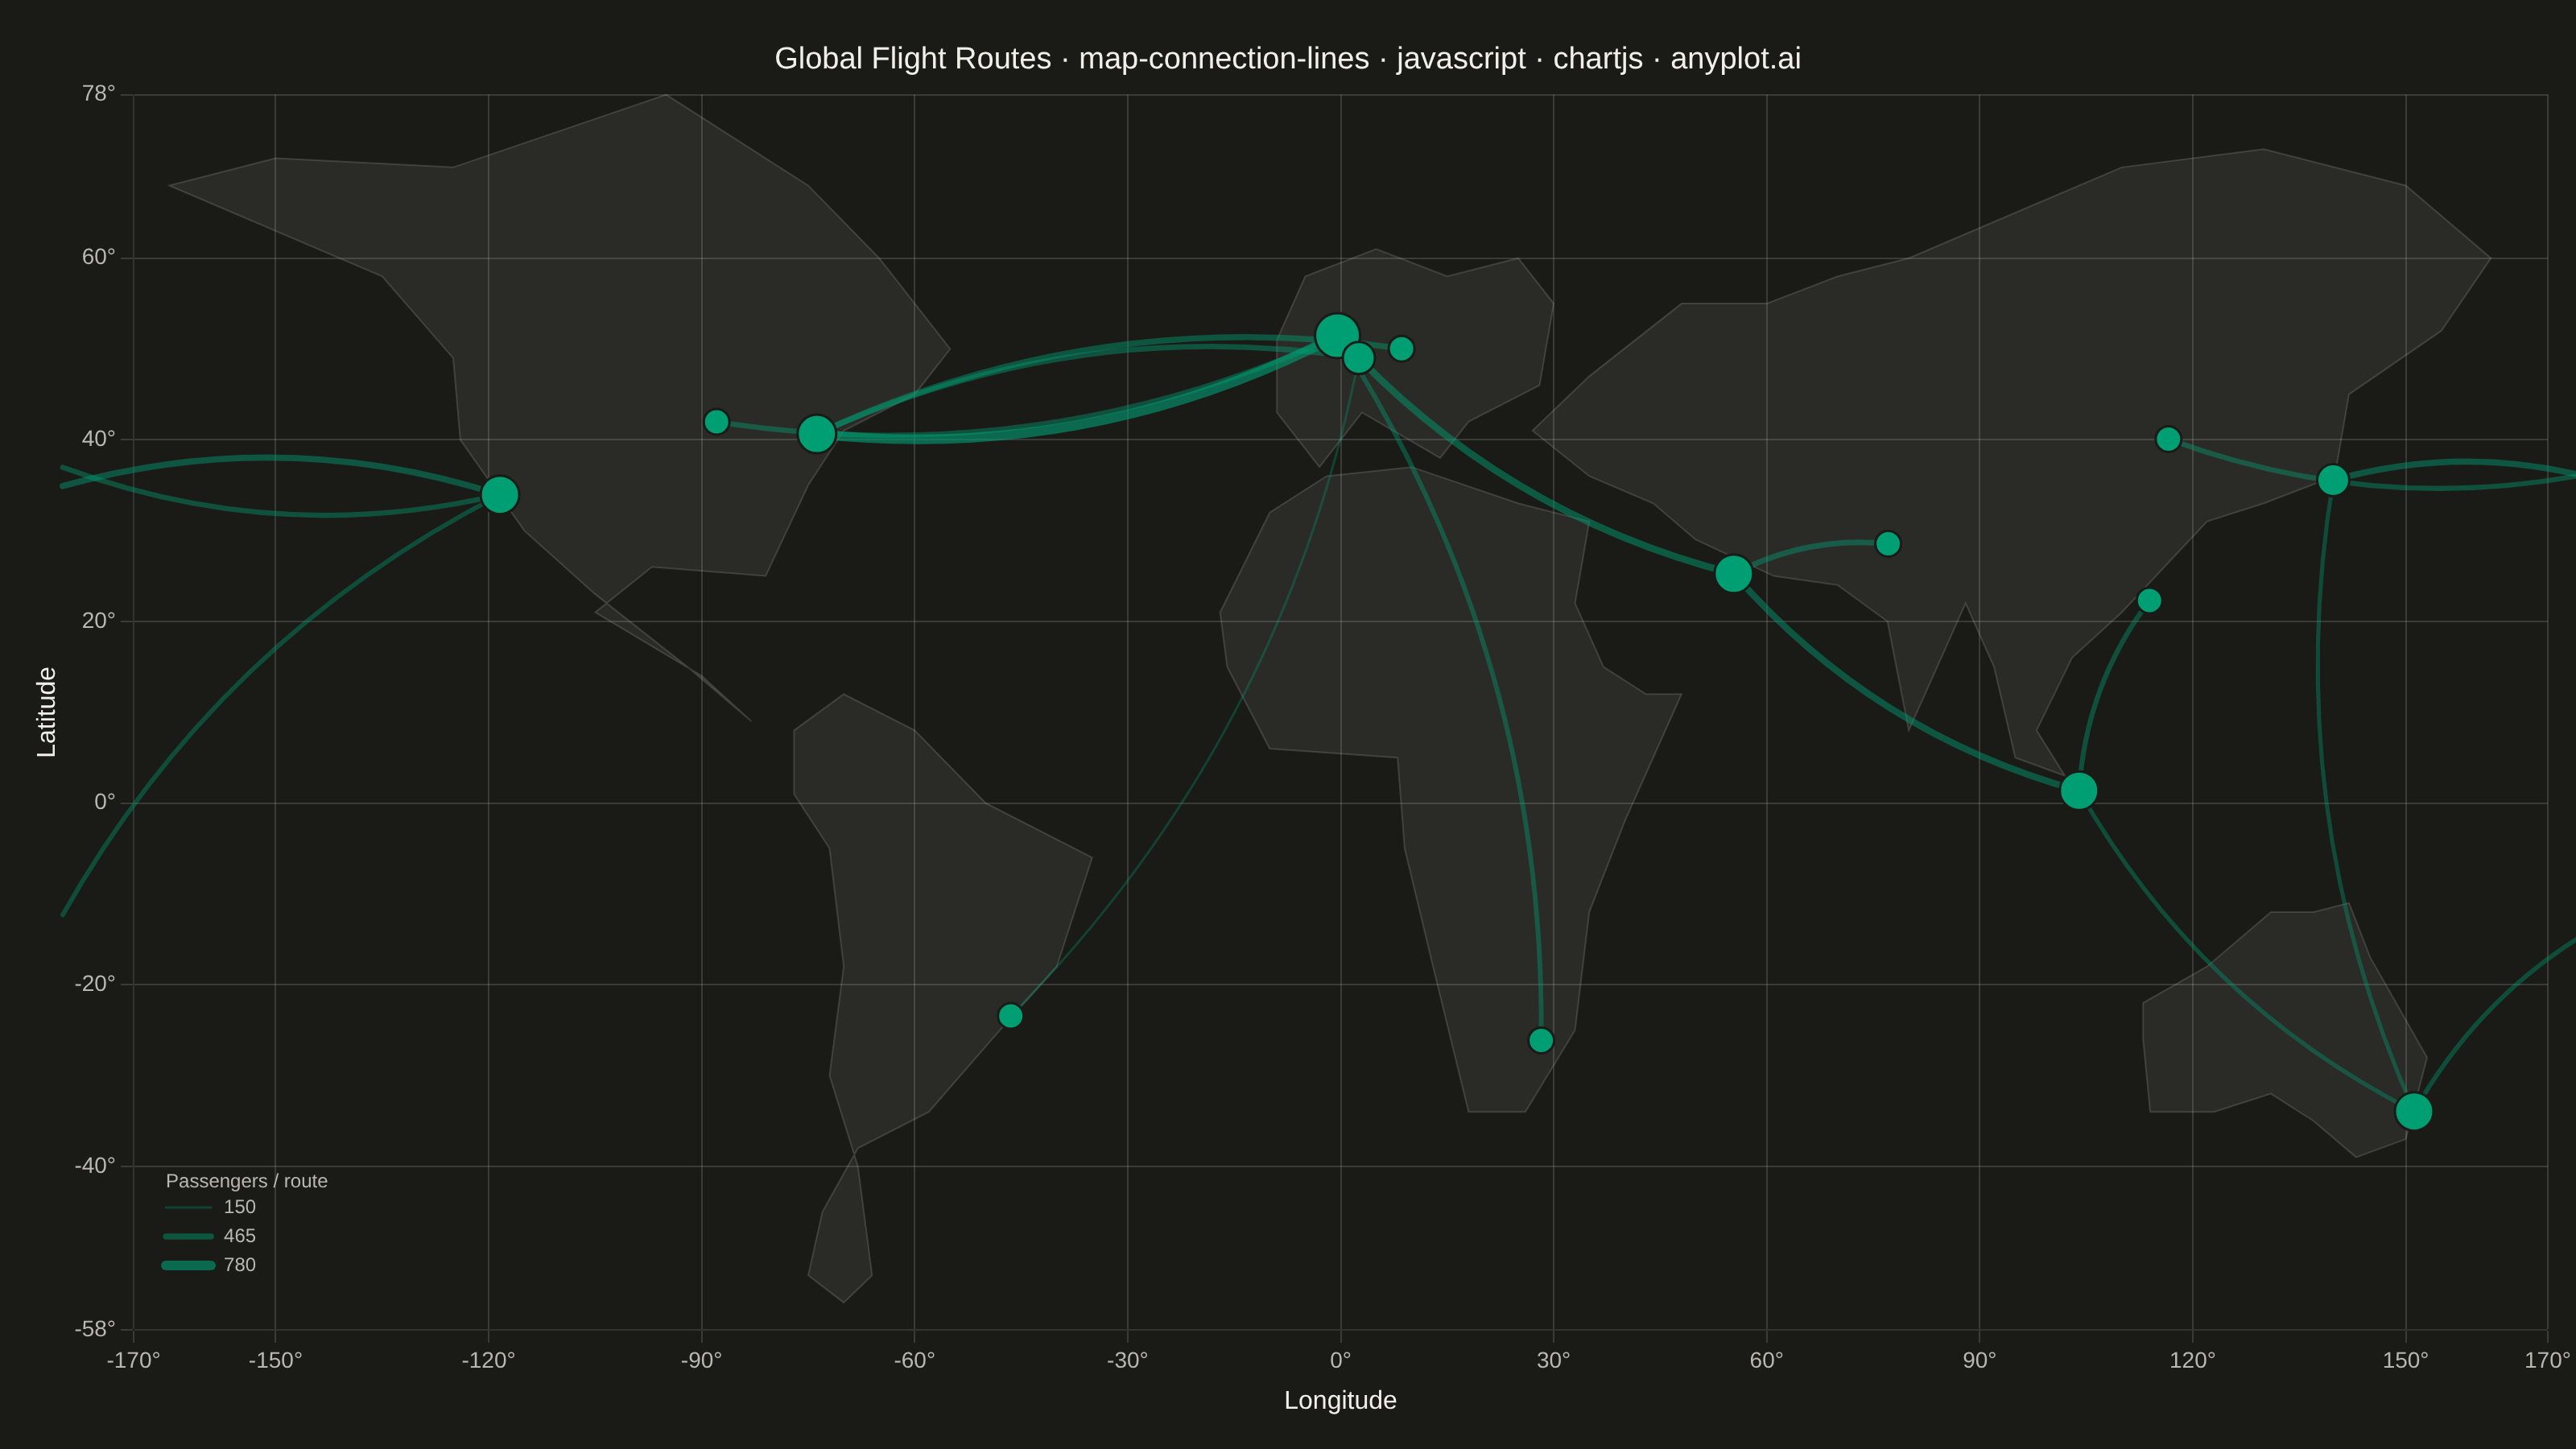
The same plot in 14 other libraries — JavaScript: D3.js, Apache ECharts, Highcharts, MUI X Charts; Python: Altair, Bokeh, lets-plot, Matplotlib, Plotly, plotnine, Pygal, Seaborn; R: ggplot2; Julia: Makie.jl. Compare all 15 side by side: Connection Lines Map (Origin-Destination) in Python, R, Julia and JavaScript.
A geographic map visualization showing connection lines (arcs or great circles) between pairs of locations. This plot excels at revealing spatial patterns in flows, routes, and relationships between places. The curved lines naturally represent shortest paths on Earth's surface while avoiding visual overlap with straight lines. Line properties like thickness or color can encode additional variables such as traffic volume or connection type.
// anyplot.ai
// map-connection-lines: Connection Lines Map (Origin-Destination)
// Library: chartjs 4.4.7 | JavaScript 22.23.2
// Quality: 92/100 | Created: 2026-08-26

const t = window.ANYPLOT_TOKENS;

// --- Data (in-memory, deterministic) ----------------------------------------
// Global flight routes between major airports; passenger volume drives arc
// thickness/opacity. Longitude/latitude double as the chart's x/y coordinates
// (a simple equirectangular projection), so Chart.js's own linear scales and
// gridlines become the map's graticule.
const airports = [
  { code: "JFK", lat: 40.64, lon: -73.78 },
  { code: "LAX", lat: 33.94, lon: -118.41 },
  { code: "ORD", lat: 41.98, lon: -87.9 },
  { code: "LHR", lat: 51.47, lon: -0.45 },
  { code: "CDG", lat: 49.01, lon: 2.55 },
  { code: "FRA", lat: 50.03, lon: 8.57 },
  { code: "DXB", lat: 25.25, lon: 55.36 },
  { code: "DEL", lat: 28.56, lon: 77.1 },
  { code: "PEK", lat: 40.08, lon: 116.58 },
  { code: "HKG", lat: 22.31, lon: 113.91 },
  { code: "SIN", lat: 1.36, lon: 103.99 },
  { code: "HND", lat: 35.55, lon: 139.78 },
  { code: "SYD", lat: -33.95, lon: 151.18 },
  { code: "GRU", lat: -23.43, lon: -46.47 },
  { code: "JNB", lat: -26.13, lon: 28.24 },
];
const airportByCode = Object.fromEntries(airports.map((a) => [a.code, a]));

const routes = [
  { from: "JFK", to: "LHR", passengers: 780 },
  { from: "LAX", to: "HND", passengers: 480 },
  { from: "LHR", to: "DXB", passengers: 550 },
  { from: "CDG", to: "JFK", passengers: 410 },
  { from: "DXB", to: "SIN", passengers: 500 },
  { from: "HND", to: "SYD", passengers: 300 },
  { from: "GRU", to: "CDG", passengers: 150 },
  { from: "JNB", to: "LHR", passengers: 350 },
  { from: "SIN", to: "SYD", passengers: 320 },
  { from: "PEK", to: "LAX", passengers: 390 },
  { from: "FRA", to: "JFK", passengers: 460 },
  { from: "ORD", to: "LHR", passengers: 400 },
  { from: "DEL", to: "DXB", passengers: 430 },
  { from: "HKG", to: "SIN", passengers: 370 },
  { from: "LAX", to: "SYD", passengers: 340 },
];
const passengerValues = routes.map((r) => r.passengers);
const minPassengers = Math.min(...passengerValues);
const maxPassengers = Math.max(...passengerValues);

const degreeByCode = Object.fromEntries(airports.map((a) => [a.code, 0]));
routes.forEach((r) => {
  degreeByCode[r.from] += 1;
  degreeByCode[r.to] += 1;
});

// Simplified continent silhouettes (lon/lat polygons) — stylized geographic
// context only, not survey-accurate coastlines.
const CONTINENTS = [
  [
    [-165, 68], [-150, 71], [-125, 70], [-95, 78], [-75, 68], [-65, 60],
    [-55, 50], [-60, 45], [-70, 41], [-75, 35], [-81, 25], [-97, 26],
    [-105, 21], [-90, 14], [-83, 9], [-92, 15], [-105, 23], [-115, 30],
    [-124, 40], [-125, 49], [-135, 58],
  ],
  [
    [-77, 8], [-70, 12], [-60, 8], [-50, 0], [-35, -6], [-40, -18],
    [-48, -25], [-58, -34], [-68, -38], [-73, -45], [-75, -52], [-70, -55],
    [-66, -52], [-68, -40], [-72, -30], [-70, -18], [-72, -5], [-77, 1],
  ],
  [
    [-9, 43], [-9, 51], [-5, 58], [5, 61], [15, 58], [25, 60],
    [30, 55], [28, 46], [18, 42], [14, 38], [3, 43], [-3, 37],
  ],
  [
    [-17, 21], [-16, 15], [-10, 6], [8, 5], [9, -5], [13, -18],
    [18, -34], [26, -34], [33, -25], [35, -12], [40, -2], [48, 12],
    [43, 12], [37, 15], [33, 22], [35, 31], [25, 33], [10, 37],
    [-2, 36], [-10, 32],
  ],
  [
    [27, 41], [35, 47], [48, 55], [60, 55], [70, 58], [80, 60],
    [95, 65], [110, 70], [130, 72], [150, 68], [162, 60], [155, 52],
    [142, 45], [140, 36], [130, 33], [122, 31], [110, 21], [103, 16],
    [98, 8], [102, 3], [95, 5], [92, 15], [88, 22], [80, 8],
    [77, 20], [70, 24], [61, 25], [50, 29], [44, 33], [35, 36],
  ],
  [
    [113, -22], [122, -18], [131, -12], [137, -12], [142, -11],
    [145, -17], [153, -28], [150, -37], [143, -39], [137, -35],
    [131, -32], [123, -34], [114, -34], [113, -26],
  ],
];

const hexToRgba = (hex, alpha) => {
  const h = hex.replace("#", "");
  const r = parseInt(h.substring(0, 2), 16);
  const g = parseInt(h.substring(2, 4), 16);
  const b = parseInt(h.substring(4, 6), 16);
  return `rgba(${r}, ${g}, ${b}, ${alpha})`;
};

const project = (chart, lon, lat) => ({
  x: chart.scales.x.getPixelForValue(lon),
  y: chart.scales.y.getPixelForValue(lat),
});

// --- Custom draw plugins -----------------------------------------------------
// Chart.js has no native geo/map chart type; the base map and the curved
// connection arcs are drawn directly with the canvas context, projected
// through the chart's own linear scales. Both run in beforeDatasetsDraw so
// the airport markers (a real Chart.js dataset) render on top.
const worldMapPlugin = {
  id: "worldMap",
  beforeDatasetsDraw(chart) {
    const { ctx } = chart;
    ctx.save();
    ctx.fillStyle =
      window.ANYPLOT_THEME === "light" ? "rgba(26, 26, 23, 0.06)" : "rgba(240, 239, 232, 0.08)";
    ctx.strokeStyle = t.grid;
    ctx.lineWidth = 1;
    CONTINENTS.forEach((polygon) => {
      ctx.beginPath();
      polygon.forEach(([lon, lat], i) => {
        const p = project(chart, lon, lat);
        if (i === 0) ctx.moveTo(p.x, p.y);
        else ctx.lineTo(p.x, p.y);
      });
      ctx.closePath();
      ctx.fill();
      ctx.stroke();
    });
    ctx.restore();
  },
};

const arcStyle = (route) => {
  const ratio = (route.passengers - minPassengers) / (maxPassengers - minPassengers);
  return { lineWidth: 1.5 + ratio * 4.5, strokeStyle: hexToRgba(t.palette[0], 0.3 + ratio * 0.3) };
};

const drawArc = (ctx, p0, p1, style) => {
  const dx = p1.x - p0.x;
  const dy = p1.y - p0.y;
  const dist = Math.hypot(dx, dy) || 1;
  const bulge = dist * 0.15;
  const cx = (p0.x + p1.x) / 2 - (dy / dist) * bulge;
  const cy = (p0.y + p1.y) / 2 + (dx / dist) * bulge;
  ctx.lineWidth = style.lineWidth;
  ctx.strokeStyle = style.strokeStyle;
  ctx.beginPath();
  ctx.moveTo(p0.x, p0.y);
  ctx.quadraticCurveTo(cx, cy, p1.x, p1.y);
  ctx.stroke();
};

const connectionArcsPlugin = {
  id: "connectionArcs",
  beforeDatasetsDraw(chart) {
    const { ctx } = chart;
    ctx.save();
    ctx.lineCap = "round";
    routes.forEach((route) => {
      const origin = airportByCode[route.from];
      const dest = airportByCode[route.to];
      const style = arcStyle(route);
      const lonDelta = dest.lon - origin.lon;
      if (Math.abs(lonDelta) > 180) {
        // Antimeridian wraparound (e.g. LAX-HND, PEK-LAX, LAX-SYD): a direct
        // pixel chord would sweep the "long way" through Europe/Africa. Split
        // the arc in two at the +/-180 boundary so each half bulges toward the
        // true geodesic (Pacific) side instead.
        const originEdgeLon = lonDelta > 0 ? -180 : 180;
        const destEdgeLon = -originEdgeLon;
        const unwrappedDestLon = lonDelta > 0 ? dest.lon - 360 : dest.lon + 360;
        const frac = (originEdgeLon - origin.lon) / (unwrappedDestLon - origin.lon);
        const crossingLat = origin.lat + frac * (dest.lat - origin.lat);
        const p0 = project(chart, origin.lon, origin.lat);
        const pOriginEdge = project(chart, originEdgeLon, crossingLat);
        const pDestEdge = project(chart, destEdgeLon, crossingLat);
        const p1 = project(chart, dest.lon, dest.lat);
        drawArc(ctx, p0, pOriginEdge, style);
        drawArc(ctx, pDestEdge, p1, style);
      } else {
        const p0 = project(chart, origin.lon, origin.lat);
        const p1 = project(chart, dest.lon, dest.lat);
        drawArc(ctx, p0, p1, style);
      }
    });
    ctx.restore();
  },
};

// Small legend translating arc thickness/opacity back into passenger counts;
// placed in the empty south-Pacific corner of the map so it doesn't collide
// with any airport marker or route.
const legendStops = [0, 0.5, 1].map((ratio) => ({
  ratio,
  label: `${Math.round(minPassengers + ratio * (maxPassengers - minPassengers))}`,
}));

const arcLegendPlugin = {
  id: "arcLegend",
  afterDatasetsDraw(chart) {
    const { ctx, chartArea } = chart;
    ctx.save();
    ctx.textBaseline = "middle";
    ctx.font = "12px sans-serif";
    const x0 = chartArea.left + 20;
    let y = chartArea.bottom - 76;
    ctx.fillStyle = t.inkSoft;
    ctx.fillText("Passengers / route", x0, y - 16);
    legendStops.forEach((stop) => {
      ctx.lineCap = "round";
      ctx.lineWidth = 1.5 + stop.ratio * 4.5;
      ctx.strokeStyle = hexToRgba(t.palette[0], 0.3 + stop.ratio * 0.3);
      ctx.beginPath();
      ctx.moveTo(x0, y);
      ctx.lineTo(x0 + 28, y);
      ctx.stroke();
      ctx.fillStyle = t.inkSoft;
      ctx.fillText(stop.label, x0 + 36, y);
      y += 18;
    });
    ctx.restore();
  },
};

// --- Mount -------------------------------------------------------------------
const canvas = document.createElement("canvas");
document.getElementById("container").appendChild(canvas);

// --- Title (scale fontsize to the rendered length, see plot-generator.md) ---
const title = "Global Flight Routes · map-connection-lines · javascript · chartjs · anyplot.ai";
const titleFontSize = Math.max(15, Math.round(22 * Math.min(1, 67 / title.length)));

// --- Chart ---------------------------------------------------------------
new Chart(canvas, {
  type: "scatter",
  data: {
    datasets: [
      {
        label: "Airports",
        data: airports.map((a) => ({ x: a.lon, y: a.lat })),
        pointRadius: airports.map((a) => 6 + degreeByCode[a.code] * 2),
        pointHoverRadius: airports.map((a) => 8 + degreeByCode[a.code] * 2),
        pointBackgroundColor: t.palette[0],
        pointBorderColor: t.pageBg,
        pointBorderWidth: 1.5,
      },
    ],
  },
  plugins: [worldMapPlugin, connectionArcsPlugin, arcLegendPlugin],
  options: {
    responsive: true,
    maintainAspectRatio: false,
    animation: false,
    layout: { padding: 16 },
    plugins: {
      title: {
        display: true,
        text: title,
        color: t.ink,
        font: { size: titleFontSize, weight: "500" },
      },
      legend: { display: false },
      tooltip: {
        callbacks: {
          label: (ctx) => airports[ctx.dataIndex].code,
        },
      },
    },
    scales: {
      x: {
        type: "linear",
        min: -170,
        max: 170,
        title: { display: true, text: "Longitude", color: t.ink, font: { size: 16 } },
        ticks: {
          color: t.inkSoft,
          font: { size: 14 },
          stepSize: 30,
          callback: (v) => `${v}°`,
        },
        grid: { color: t.grid },
      },
      y: {
        type: "linear",
        min: -58,
        max: 78,
        title: { display: true, text: "Latitude", color: t.ink, font: { size: 16 } },
        ticks: {
          color: t.inkSoft,
          font: { size: 14 },
          stepSize: 20,
          callback: (v) => `${v}°`,
        },
        grid: { color: t.grid },
      },
    },
  },
});
Runnable source as JSON, for any HTTP client: https://api.anyplot.ai/specs/map-connection-lines/chartjs/code. Any spec id and library id listed in llms-full.txt fit the same URL shape; every URL below is complete and callable.
{
  "spec_id": "map-connection-lines",
  "language": "javascript",
  "library": "chartjs",
  "page": "https://anyplot.ai/map-connection-lines/javascript/chartjs",
  "hub": "https://anyplot.ai/map-connection-lines",
  "code_json": "https://api.anyplot.ai/specs/map-connection-lines/chartjs/code",
  "spec_json": "https://api.anyplot.ai/specs/map-connection-lines",
  "render_light_png": "https://storage.googleapis.com/anyplot-images/plots/map-connection-lines/javascript/chartjs/plot-light.png",
  "render_dark_png": "https://storage.googleapis.com/anyplot-images/plots/map-connection-lines/javascript/chartjs/plot-dark.png",
  "interactive_light_html": "https://storage.googleapis.com/anyplot-images/plots/map-connection-lines/javascript/chartjs/plot-light.html",
  "interactive_dark_html": "https://storage.googleapis.com/anyplot-images/plots/map-connection-lines/javascript/chartjs/plot-dark.html",
  "quality_score": 92.0,
  "license": "MIT",
  "guide": "https://anyplot.ai/llms.txt"
}
Part of Connection Lines Map (Origin-Destination) on anyplot.ai.