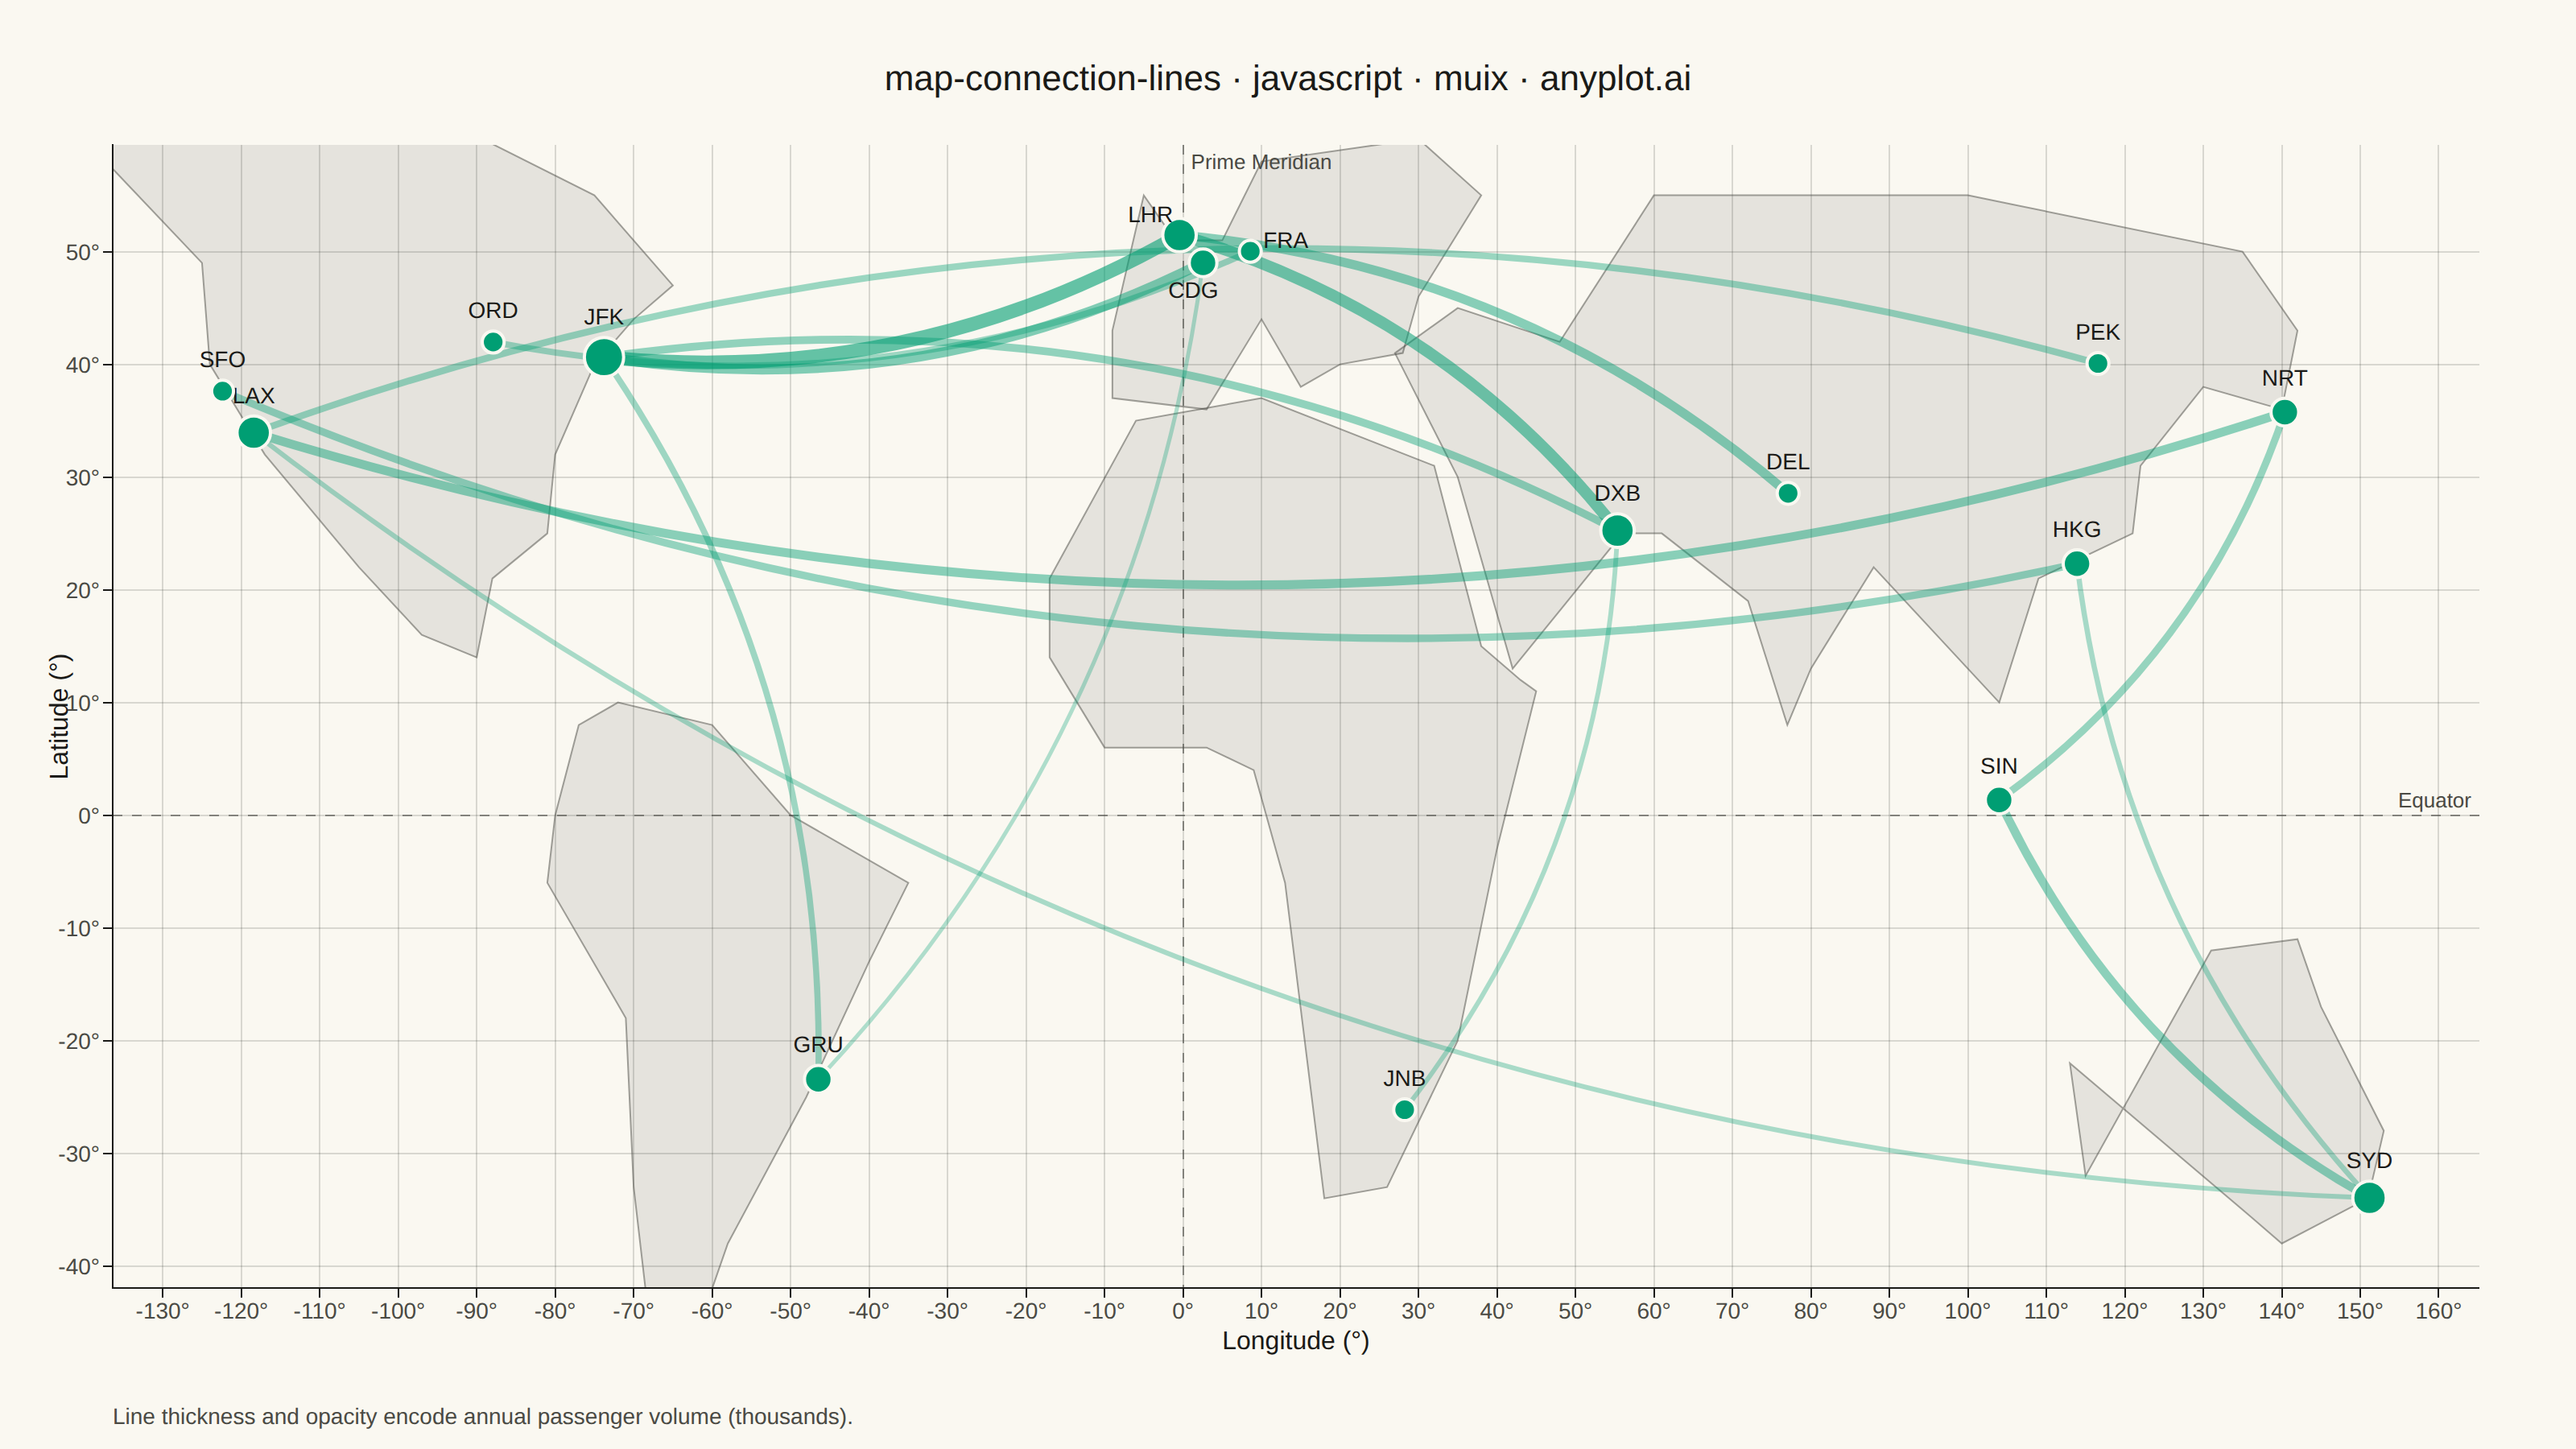
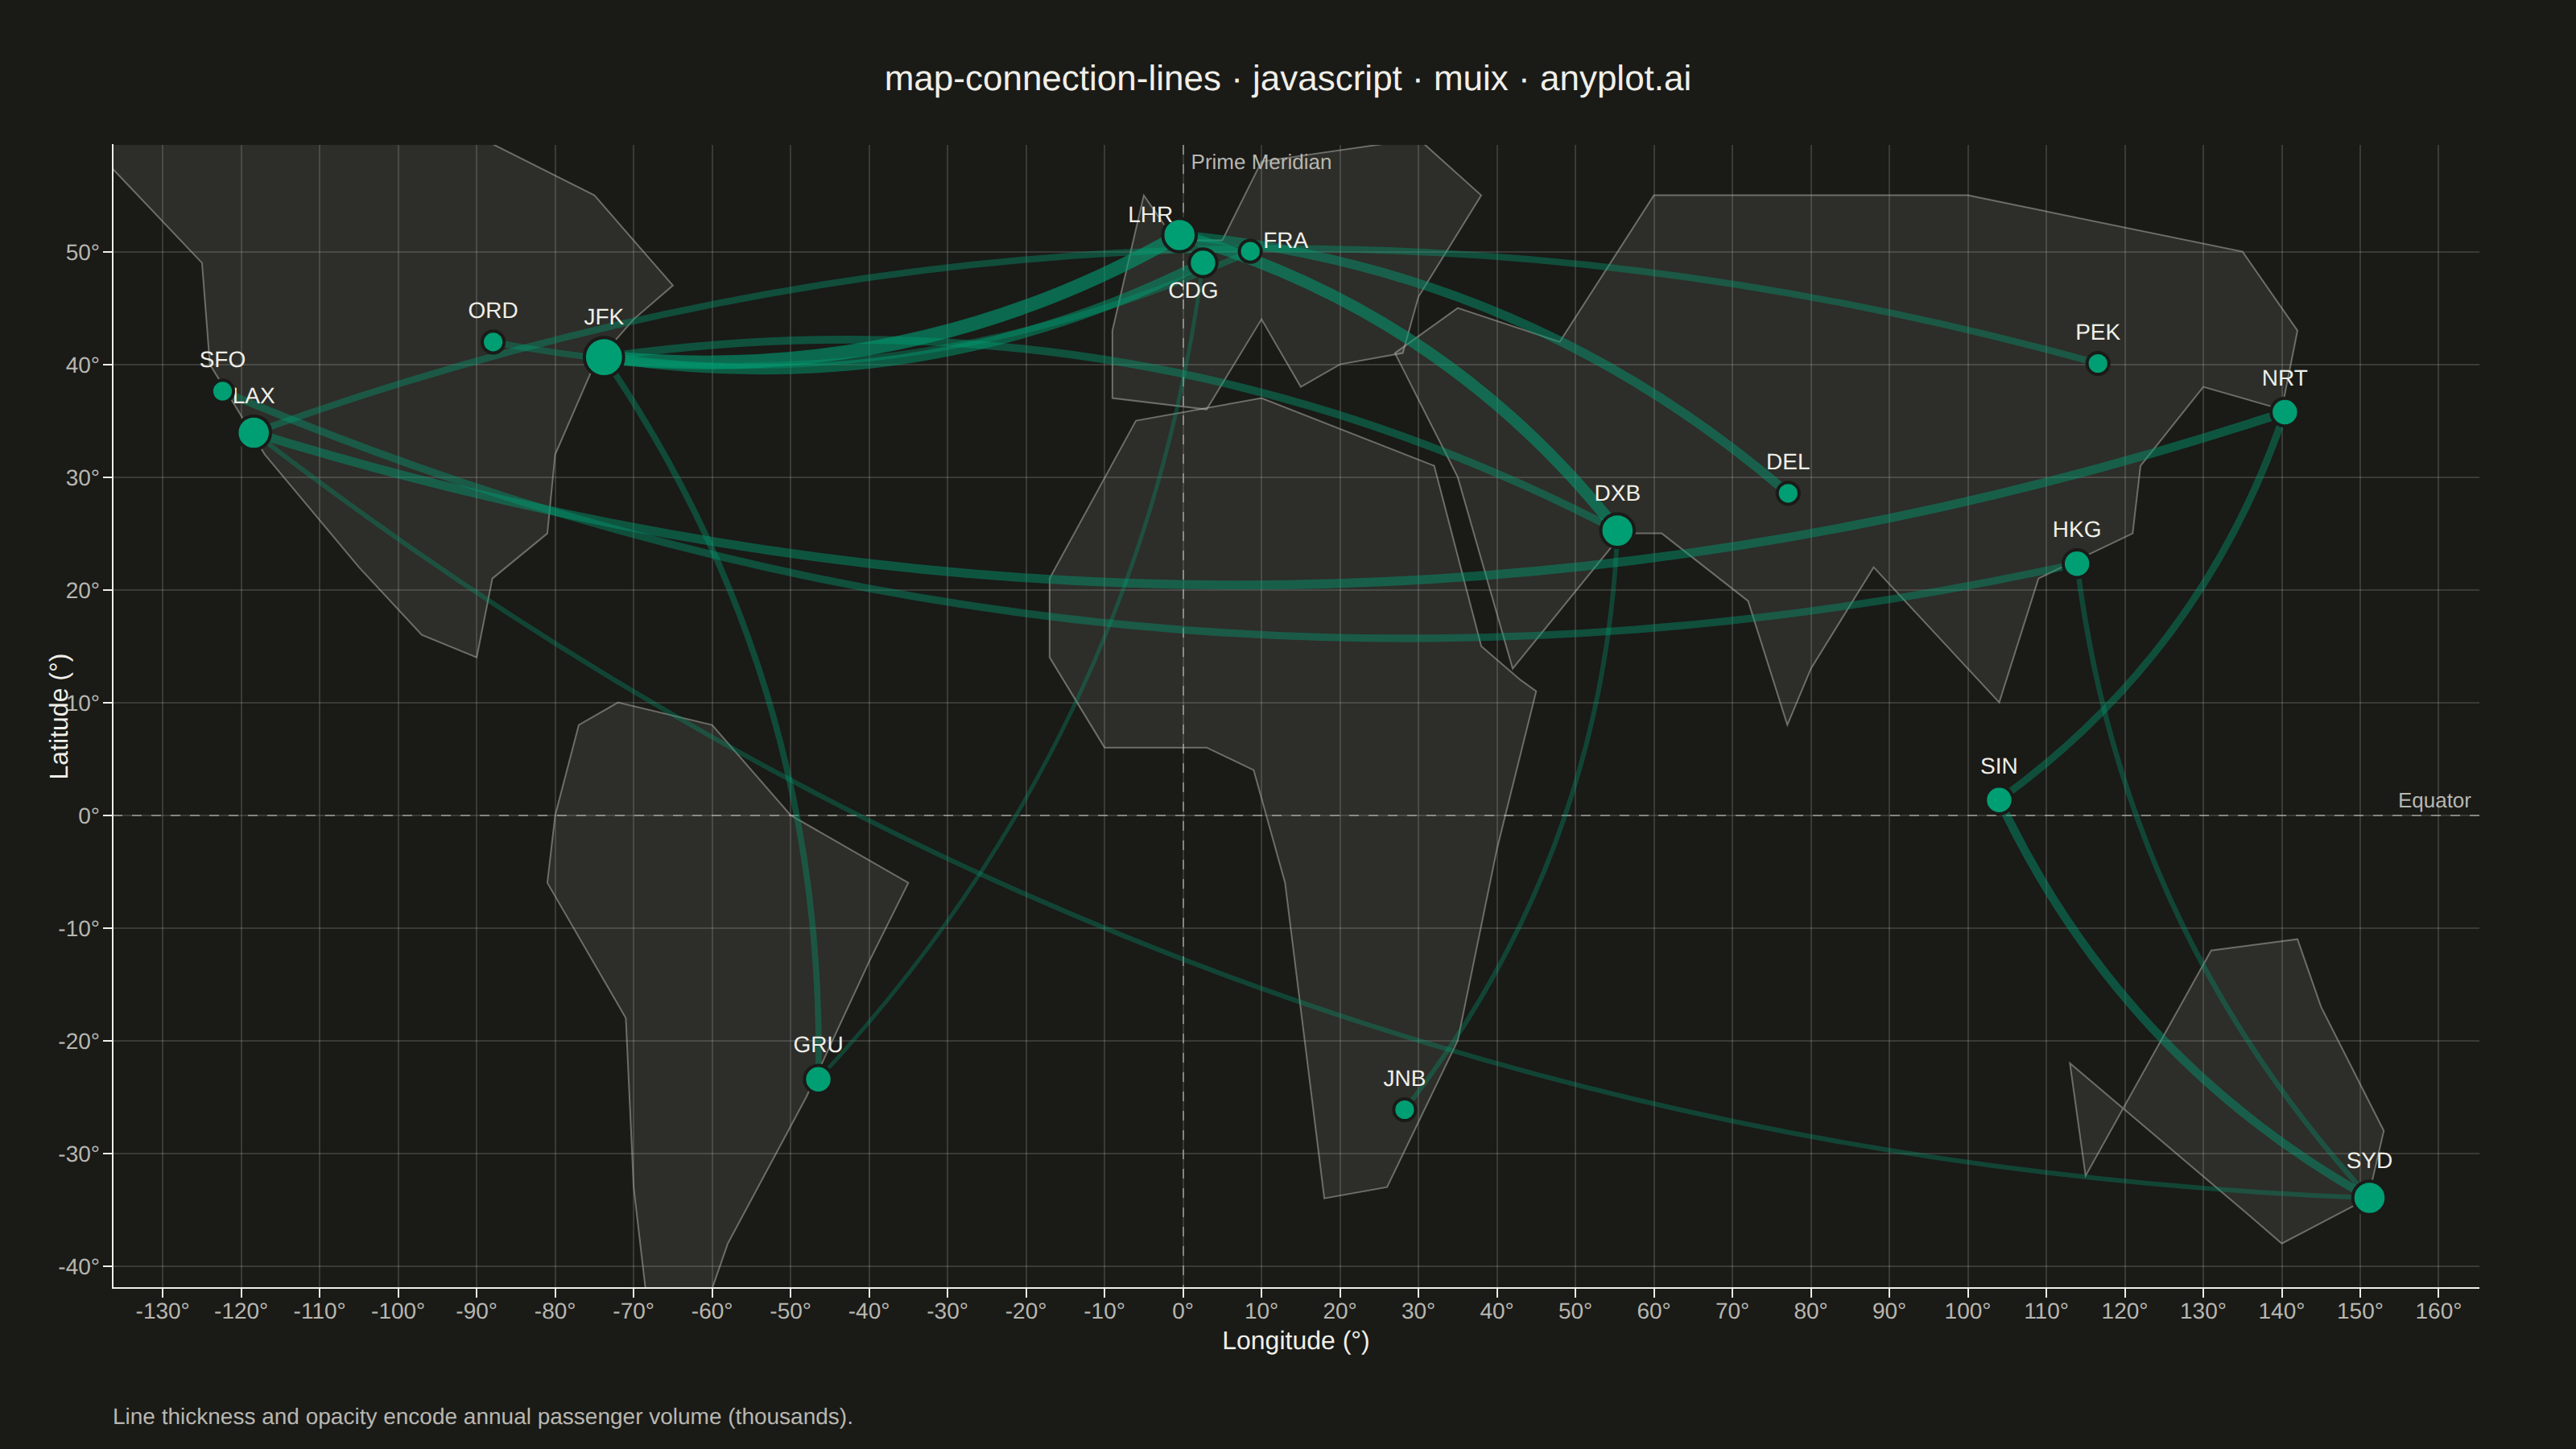
The same plot in 14 other libraries — JavaScript: Chart.js, D3.js, Apache ECharts, Highcharts; Python: Altair, Bokeh, lets-plot, Matplotlib, Plotly, plotnine, Pygal, Seaborn; R: ggplot2; Julia: Makie.jl. Compare all 15 side by side: Connection Lines Map (Origin-Destination) in Python, R, Julia and JavaScript.
A geographic map visualization showing connection lines (arcs or great circles) between pairs of locations. This plot excels at revealing spatial patterns in flows, routes, and relationships between places. The curved lines naturally represent shortest paths on Earth's surface while avoiding visual overlap with straight lines. Line properties like thickness or color can encode additional variables such as traffic volume or connection type.
// anyplot.ai
// map-connection-lines: Connection Lines Map (Origin-Destination)
// Library: muix 7.29.1 | JavaScript 22.23.2
// Quality: 92/100 | Created: 2026-08-26
//# anyplot-orientation: landscape
// anyplot.ai
// map-connection-lines: Connection Lines Map (Origin-Destination)
// Library: MUI X Charts | React | Node 22
// License: @mui/x-charts — MIT (community). Pro/Premium are out of scope.
// Quality: pending | Created: 2026-08-26
import { ChartContainer } from "@mui/x-charts/ChartContainer";
import { ChartsXAxis } from "@mui/x-charts/ChartsXAxis";
import { ChartsYAxis } from "@mui/x-charts/ChartsYAxis";
import { ChartsGrid } from "@mui/x-charts/ChartsGrid";
import { ChartsReferenceLine } from "@mui/x-charts/ChartsReferenceLine";
import { useXScale, useYScale, useDrawingArea } from "@mui/x-charts/hooks";

const t = window.ANYPLOT_TOKENS;
const TITLE = "map-connection-lines · javascript · muix · anyplot.ai";

// --- Data: major airports (in-memory, deterministic) ------------------------
const airports = {
  JFK: { name: "New York", lat: 40.64, lon: -73.78 },
  LHR: { name: "London", lat: 51.47, lon: -0.45 },
  CDG: { name: "Paris", lat: 49.01, lon: 2.55 },
  LAX: { name: "Los Angeles", lat: 33.94, lon: -118.41 },
  NRT: { name: "Tokyo", lat: 35.76, lon: 140.39 },
  SYD: { name: "Sydney", lat: -33.95, lon: 151.18 },
  SFO: { name: "San Francisco", lat: 37.62, lon: -122.38 },
  HKG: { name: "Hong Kong", lat: 22.31, lon: 113.91 },
  ORD: { name: "Chicago", lat: 41.98, lon: -87.9 },
  FRA: { name: "Frankfurt", lat: 50.03, lon: 8.57 },
  DXB: { name: "Dubai", lat: 25.25, lon: 55.36 },
  SIN: { name: "Singapore", lat: 1.35, lon: 103.99 },
  GRU: { name: "São Paulo", lat: -23.43, lon: -46.47 },
  JNB: { name: "Johannesburg", lat: -26.13, lon: 28.24 },
  DEL: { name: "New Delhi", lat: 28.56, lon: 77.1 },
  PEK: { name: "Beijing", lat: 40.08, lon: 116.58 },
};

// Flight routes: passenger volume in thousands per year (line weight)
const routes = [
  { from: "JFK", to: "LHR", passengers: 820 },
  { from: "JFK", to: "CDG", passengers: 610 },
  { from: "LAX", to: "NRT", passengers: 540 },
  { from: "LAX", to: "SYD", passengers: 310 },
  { from: "SFO", to: "HKG", passengers: 460 },
  { from: "ORD", to: "FRA", passengers: 390 },
  { from: "DXB", to: "LHR", passengers: 705 },
  { from: "DXB", to: "JFK", passengers: 480 },
  { from: "SIN", to: "SYD", passengers: 520 },
  { from: "SIN", to: "NRT", passengers: 445 },
  { from: "GRU", to: "JFK", passengers: 385 },
  { from: "GRU", to: "CDG", passengers: 260 },
  { from: "JNB", to: "DXB", passengers: 300 },
  { from: "DEL", to: "LHR", passengers: 560 },
  { from: "PEK", to: "LAX", passengers: 415 },
  { from: "HKG", to: "SYD", passengers: 330 },
];

const passengerValues = routes.map((r) => r.passengers);
const minPassengers = Math.min(...passengerValues);
const maxPassengers = Math.max(...passengerValues);

// Hub size = number of routes touching an airport
const degreeByAirport = {};
routes.forEach((r) => {
  degreeByAirport[r.from] = (degreeByAirport[r.from] || 0) + 1;
  degreeByAirport[r.to] = (degreeByAirport[r.to] || 0) + 1;
});

// Manual label nudges for the closely clustered European hubs (LHR/CDG/FRA)
// so their code labels don't collide — markers stay at true coordinates.
const labelNudge = {
  LHR: { dx: -18, dy: -8 },
  CDG: { dx: -6, dy: 22 },
  FRA: { dx: 22, dy: -2 },
};

const lons = Object.values(airports).map((a) => a.lon);
const lats = Object.values(airports).map((a) => a.lat);
const LON_MIN = Math.min(...lons) - 14;
const LON_MAX = Math.max(...lons) + 14;
const LAT_MIN = Math.min(...lats) - 8;
const LAT_MAX = Math.max(...lats) + 8;

// Simplified world coastlines (lon/lat vertices, hand-traced low-poly
// continent outlines) so the chart reads as a map rather than a bare
// lon/lat grid. Rendered via the same xScale/yScale hooks as the route
// arcs and clipped to the drawing area, so out-of-range vertices (e.g. the
// Canadian arctic) simply fall outside the visible plot.
const CONTINENTS = [
  [
    [-165, 65], [-140, 60], [-125, 49], [-124, 40], [-117, 32], [-105, 22], [-97, 16],
    [-90, 14], [-88, 21], [-81, 25], [-80, 32], [-75, 40], [-70, 44], [-65, 47],
    [-75, 55], [-95, 62], [-110, 68], [-140, 68], [-165, 65],
  ], // North America
  [
    [-77, 8], [-80, 0], [-81, -6], [-71, -18], [-70, -33], [-68, -45], [-68, -54],
    [-65, -52], [-58, -38], [-48, -25], [-40, -13], [-35, -6], [-50, 0], [-60, 8],
    [-72, 10], [-77, 8],
  ], // South America
  [
    [-9, 43], [-9, 37], [3, 36], [10, 44], [15, 38], [20, 40], [28, 41], [30, 46],
    [38, 55], [30, 60], [10, 58], [5, 51], [-1, 51], [-5, 55], [-9, 43],
  ], // Europe
  [
    [-17, 21], [-17, 14], [-10, 6], [3, 6], [9, 4], [13, -6], [18, -34], [26, -33],
    [35, -20], [40, -3], [45, 11], [43, 12], [38, 15], [32, 31], [10, 37], [-6, 35],
    [-17, 21],
  ], // Africa
  [
    [27, 41], [35, 30], [42, 13], [56, 25], [61, 25], [72, 19], [77, 8], [80, 13],
    [88, 22], [96, 16], [100, 13], [104, 10], [109, 21], [121, 25], [122, 31],
    [130, 38], [140, 36], [142, 43], [135, 50], [100, 55], [60, 55], [48, 42],
    [35, 45], [27, 41],
  ], // Asia
  [
    [113, -22], [115, -32], [131, -12], [142, -11], [145, -17], [153, -28],
    [151, -34], [140, -38], [135, -35], [113, -22],
  ], // Australia
];

// --- Overlay: title drawn in the reserved top margin -------------------------
// Plain SVG <text>, not ChartsText: ChartsText applies its own measured-width
// anchor offset on top of the native SVG text-anchor, which for a long
// middle-anchored string like this double-shifts it off-center.
function MapTitle() {
  const { width } = window.ANYPLOT_SIZE;
  return (
    <text x={width / 2} y={40} textAnchor="middle" dominantBaseline="hanging" fontSize={22} fontWeight={500} fill={t.ink}>
      {TITLE}
    </text>
  );
}

// --- Overlay: simplified land masses behind the connection arcs -------------
function WorldOutline() {
  const xScale = useXScale();
  const yScale = useYScale();
  const drawingArea = useDrawingArea();
  return (
    <g>
      <defs>
        <clipPath id="worldClip">
          <rect x={drawingArea.left} y={drawingArea.top} width={drawingArea.width} height={drawingArea.height} />
        </clipPath>
      </defs>
      <g clipPath="url(#worldClip)">
        {CONTINENTS.map((points, i) => {
          const d = points.map(([lon, lat], j) => `${j === 0 ? "M" : "L"} ${xScale(lon)},${yScale(lat)}`).join(" ") + " Z";
          return <path key={i} d={d} fill={t.grid} fillOpacity={0.6} stroke={t.inkSoft} strokeWidth={1} strokeOpacity={0.5} />;
        })}
      </g>
    </g>
  );
}

// --- Overlay: geodesic-style connection arcs + endpoint markers -------------
function ConnectionOverlay() {
  const xScale = useXScale();
  const yScale = useYScale();

  return (
    <g>
      {routes.map((route, i) => {
        const origin = airports[route.from];
        const dest = airports[route.to];
        const x1 = xScale(origin.lon);
        const y1 = yScale(origin.lat);
        const x2 = xScale(dest.lon);
        const y2 = yScale(dest.lat);

        const dx = x2 - x1;
        const dy = y2 - y1;
        const dist = Math.sqrt(dx * dx + dy * dy);
        const midX = (x1 + x2) / 2;
        const midY = (y1 + y2) / 2;
        // Perpendicular offset bows the line into a great-circle-like arc.
        const ux = dist === 0 ? 0 : -dy / dist;
        const uy = dist === 0 ? 0 : dx / dist;
        const bow = dist * 0.16;
        const controlX = midX + ux * bow;
        const controlY = midY + uy * bow;

        const ratio =
          (route.passengers - minPassengers) / (maxPassengers - minPassengers || 1);
        const strokeWidth = 2.5 + ratio * 6;
        const strokeOpacity = 0.3 + ratio * 0.3;

        return (
          <path
            key={`${route.from}-${route.to}-${i}`}
            d={`M ${x1},${y1} Q ${controlX},${controlY} ${x2},${y2}`}
            fill="none"
            stroke={t.palette[0]}
            strokeWidth={strokeWidth}
            strokeOpacity={strokeOpacity}
            strokeLinecap="round"
          />
        );
      })}
      {Object.entries(airports).map(([code, airport]) => {
        const cx = xScale(airport.lon);
        const cy = yScale(airport.lat);
        const radius = 5 + (degreeByAirport[code] || 1) * 1.8;
        const nudge = labelNudge[code] || { dx: 0, dy: -(radius + 8) };
        return (
          <g key={code}>
            <circle
              cx={cx}
              cy={cy}
              r={radius}
              fill={t.palette[0]}
              stroke={t.pageBg}
              strokeWidth={2}
            />
            <text x={cx + nudge.dx} y={cy + nudge.dy} textAnchor="middle" fontSize={14} fontWeight={500} fill={t.ink}>
              {code}
            </text>
          </g>
        );
      })}
    </g>
  );
}

// --- Overlay: caption explaining the encoding --------------------------------
function Caption() {
  const drawingArea = useDrawingArea();
  return (
    <text
      x={drawingArea.left}
      y={drawingArea.top + drawingArea.height + 74}
      textAnchor="start"
      dominantBaseline="hanging"
      fontSize={14}
      fontWeight={400}
      fill={t.inkSoft}
    >
      Line thickness and opacity encode annual passenger volume (thousands).
    </text>
  );
}

// --- Chart (default-exported component — the harness mounts it) -------------
export default function Chart() {
  return (
    <ChartContainer
      width={window.ANYPLOT_SIZE.width}
      height={window.ANYPLOT_SIZE.height}
      margin={{ top: 90, right: 60, bottom: 100, left: 70 }}
      series={[]}
      skipAnimation
      disableAxisListener
      xAxis={[
        {
          scaleType: "linear",
          min: LON_MIN,
          max: LON_MAX,
          label: "Longitude (°)",
          valueFormatter: (v) => `${v}°`,
          labelStyle: { fontSize: 16, fill: t.ink },
          tickLabelStyle: { fontSize: 14, fill: t.inkSoft },
        },
      ]}
      yAxis={[
        {
          scaleType: "linear",
          min: LAT_MIN,
          max: LAT_MAX,
          label: "Latitude (°)",
          valueFormatter: (v) => `${v}°`,
          labelStyle: { fontSize: 16, fill: t.ink },
          tickLabelStyle: { fontSize: 14, fill: t.inkSoft },
        },
      ]}
    >
      <ChartsGrid horizontal vertical />
      <WorldOutline />
      <ChartsReferenceLine
        y={0}
        label="Equator"
        labelAlign="end"
        lineStyle={{ stroke: t.inkSoft, strokeDasharray: "6 6", strokeOpacity: 0.6 }}
        labelStyle={{ fontSize: 13, fill: t.inkSoft }}
      />
      <ChartsReferenceLine
        x={0}
        label="Prime Meridian"
        labelAlign="start"
        lineStyle={{ stroke: t.inkSoft, strokeDasharray: "6 6", strokeOpacity: 0.6 }}
        labelStyle={{ fontSize: 13, fill: t.inkSoft }}
      />
      <ConnectionOverlay />
      <ChartsXAxis />
      <ChartsYAxis />
      <MapTitle />
      <Caption />
    </ChartContainer>
  );
}
Runnable source as JSON, for any HTTP client: https://api.anyplot.ai/specs/map-connection-lines/muix/code. Any spec id and library id listed in llms-full.txt fit the same URL shape; every URL below is complete and callable.
{
  "spec_id": "map-connection-lines",
  "language": "javascript",
  "library": "muix",
  "page": "https://anyplot.ai/map-connection-lines/javascript/muix",
  "hub": "https://anyplot.ai/map-connection-lines",
  "code_json": "https://api.anyplot.ai/specs/map-connection-lines/muix/code",
  "spec_json": "https://api.anyplot.ai/specs/map-connection-lines",
  "render_light_png": "https://storage.googleapis.com/anyplot-images/plots/map-connection-lines/javascript/muix/plot-light.png",
  "render_dark_png": "https://storage.googleapis.com/anyplot-images/plots/map-connection-lines/javascript/muix/plot-dark.png",
  "interactive_light_html": "https://storage.googleapis.com/anyplot-images/plots/map-connection-lines/javascript/muix/plot-light.html",
  "interactive_dark_html": "https://storage.googleapis.com/anyplot-images/plots/map-connection-lines/javascript/muix/plot-dark.html",
  "quality_score": 92.0,
  "license": "MIT",
  "guide": "https://anyplot.ai/llms.txt"
}
Part of Connection Lines Map (Origin-Destination) on anyplot.ai.