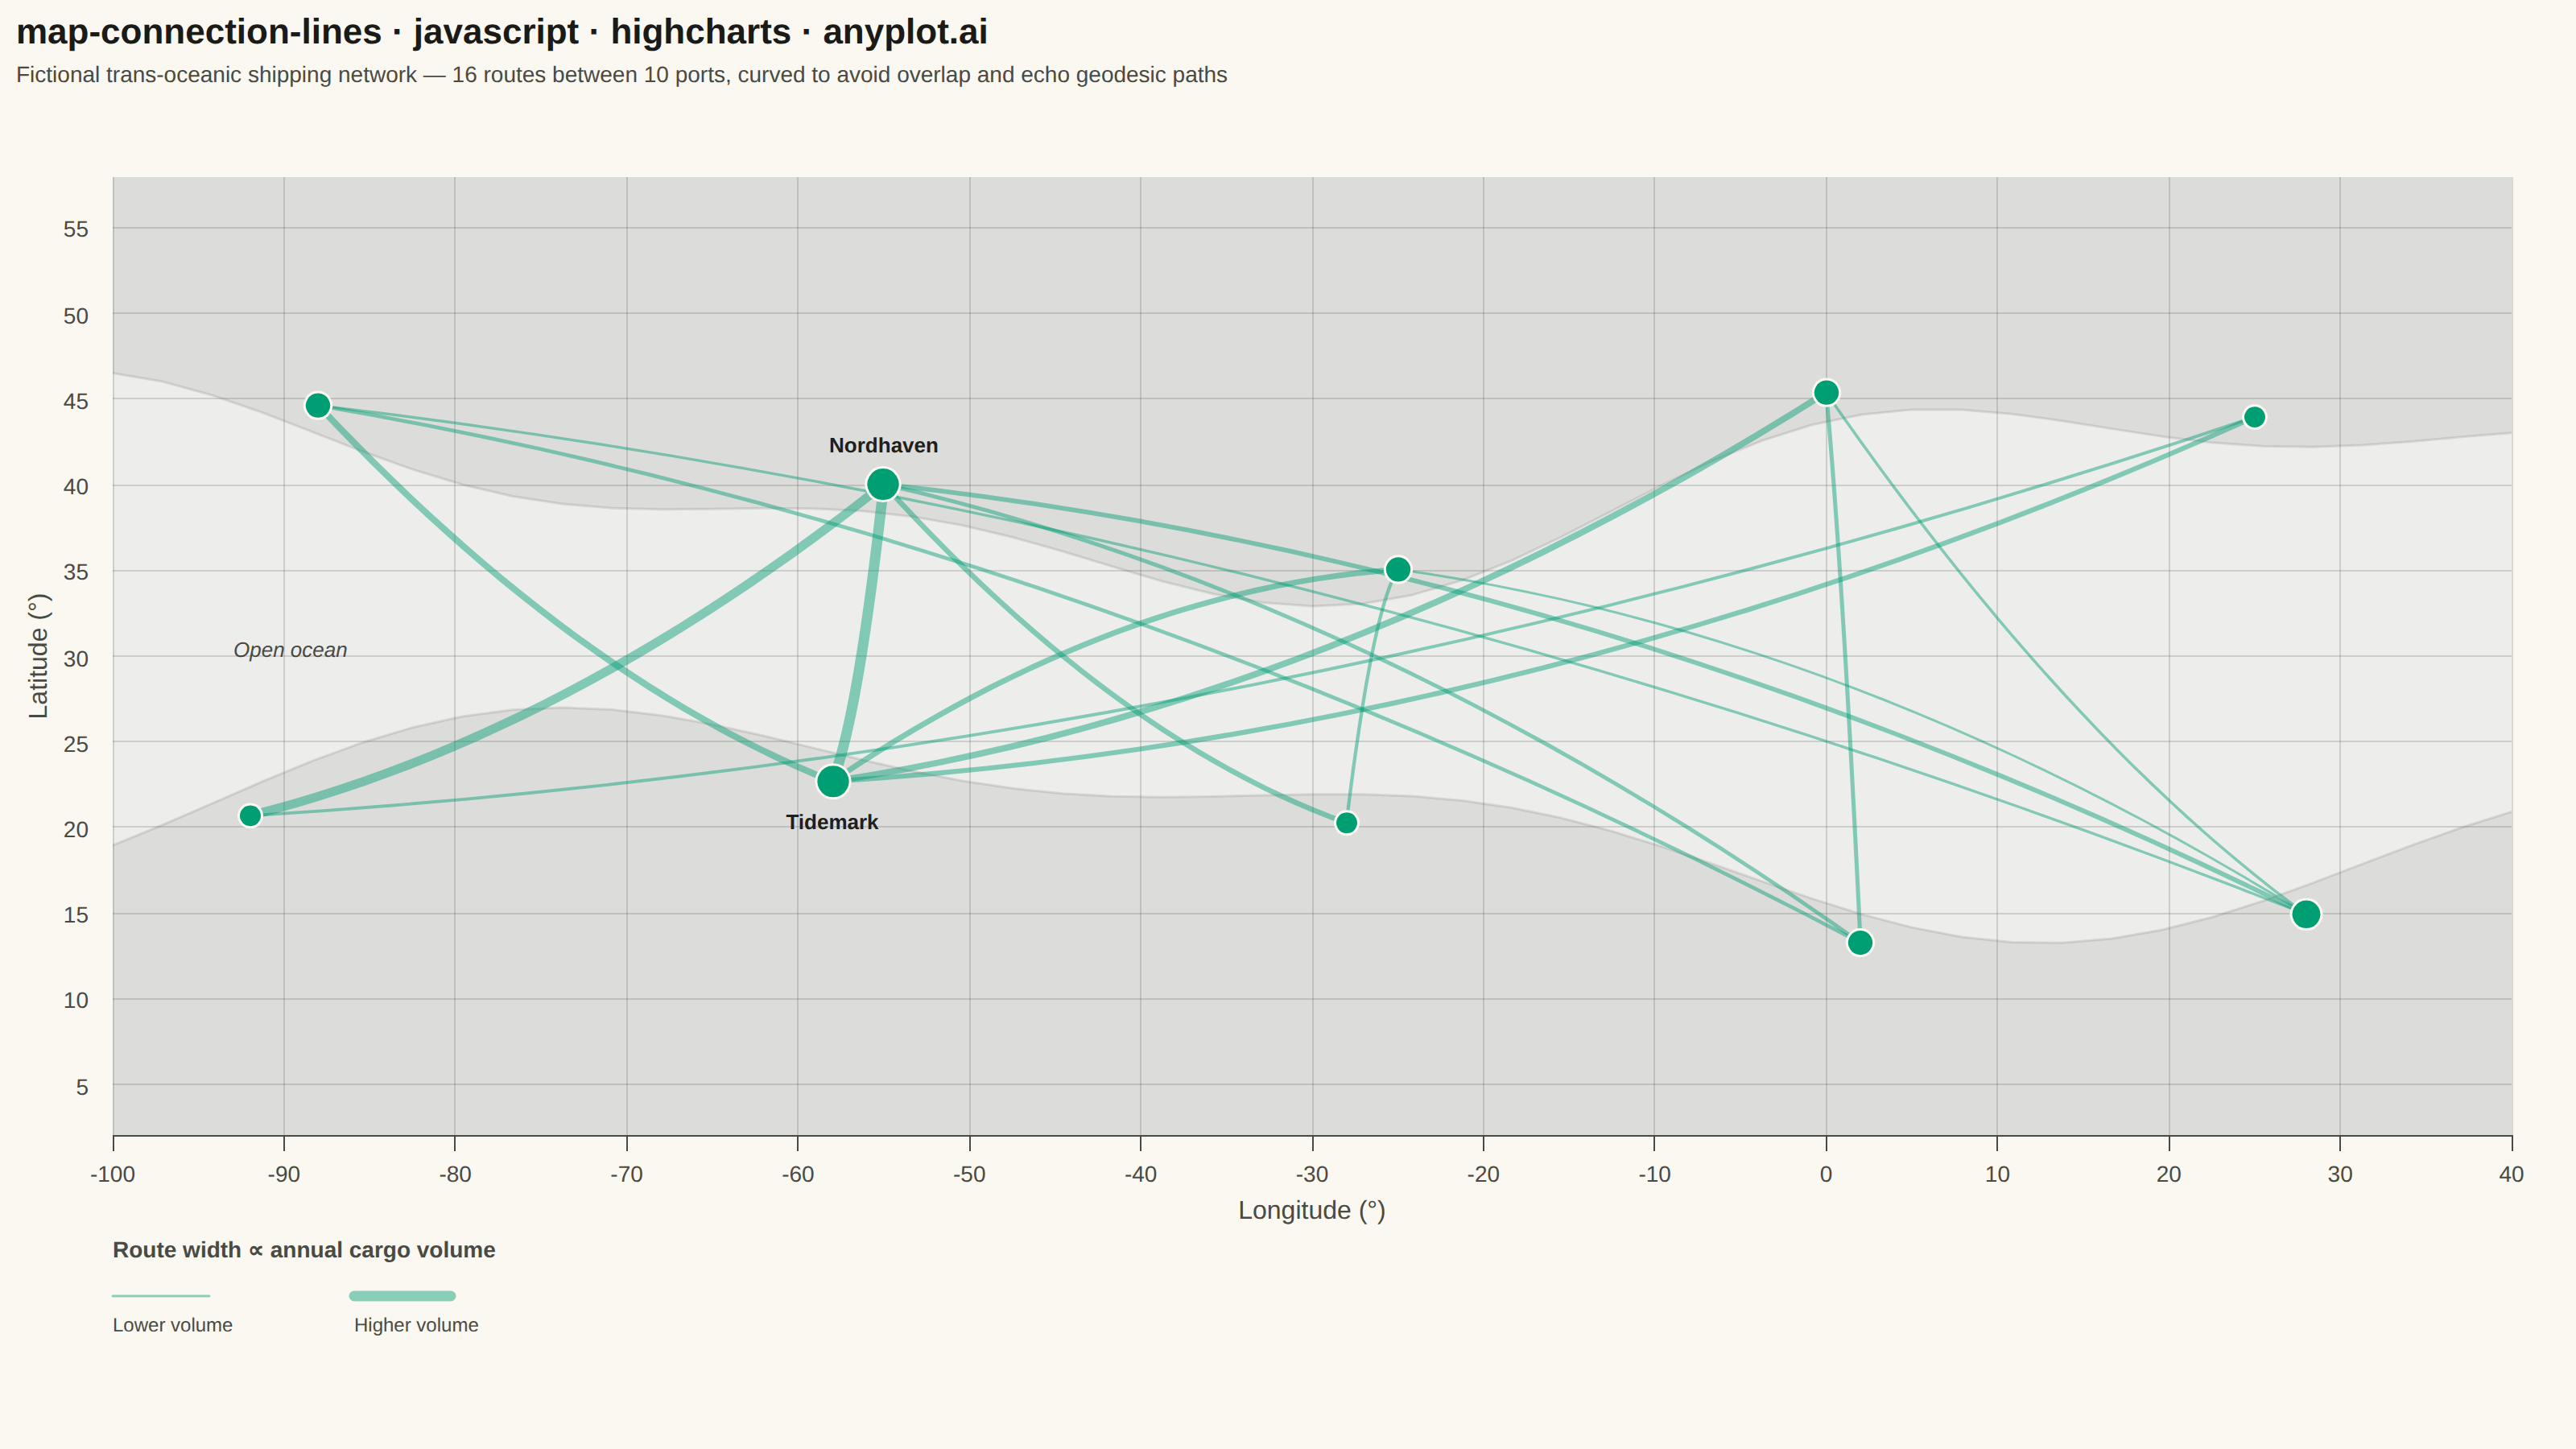
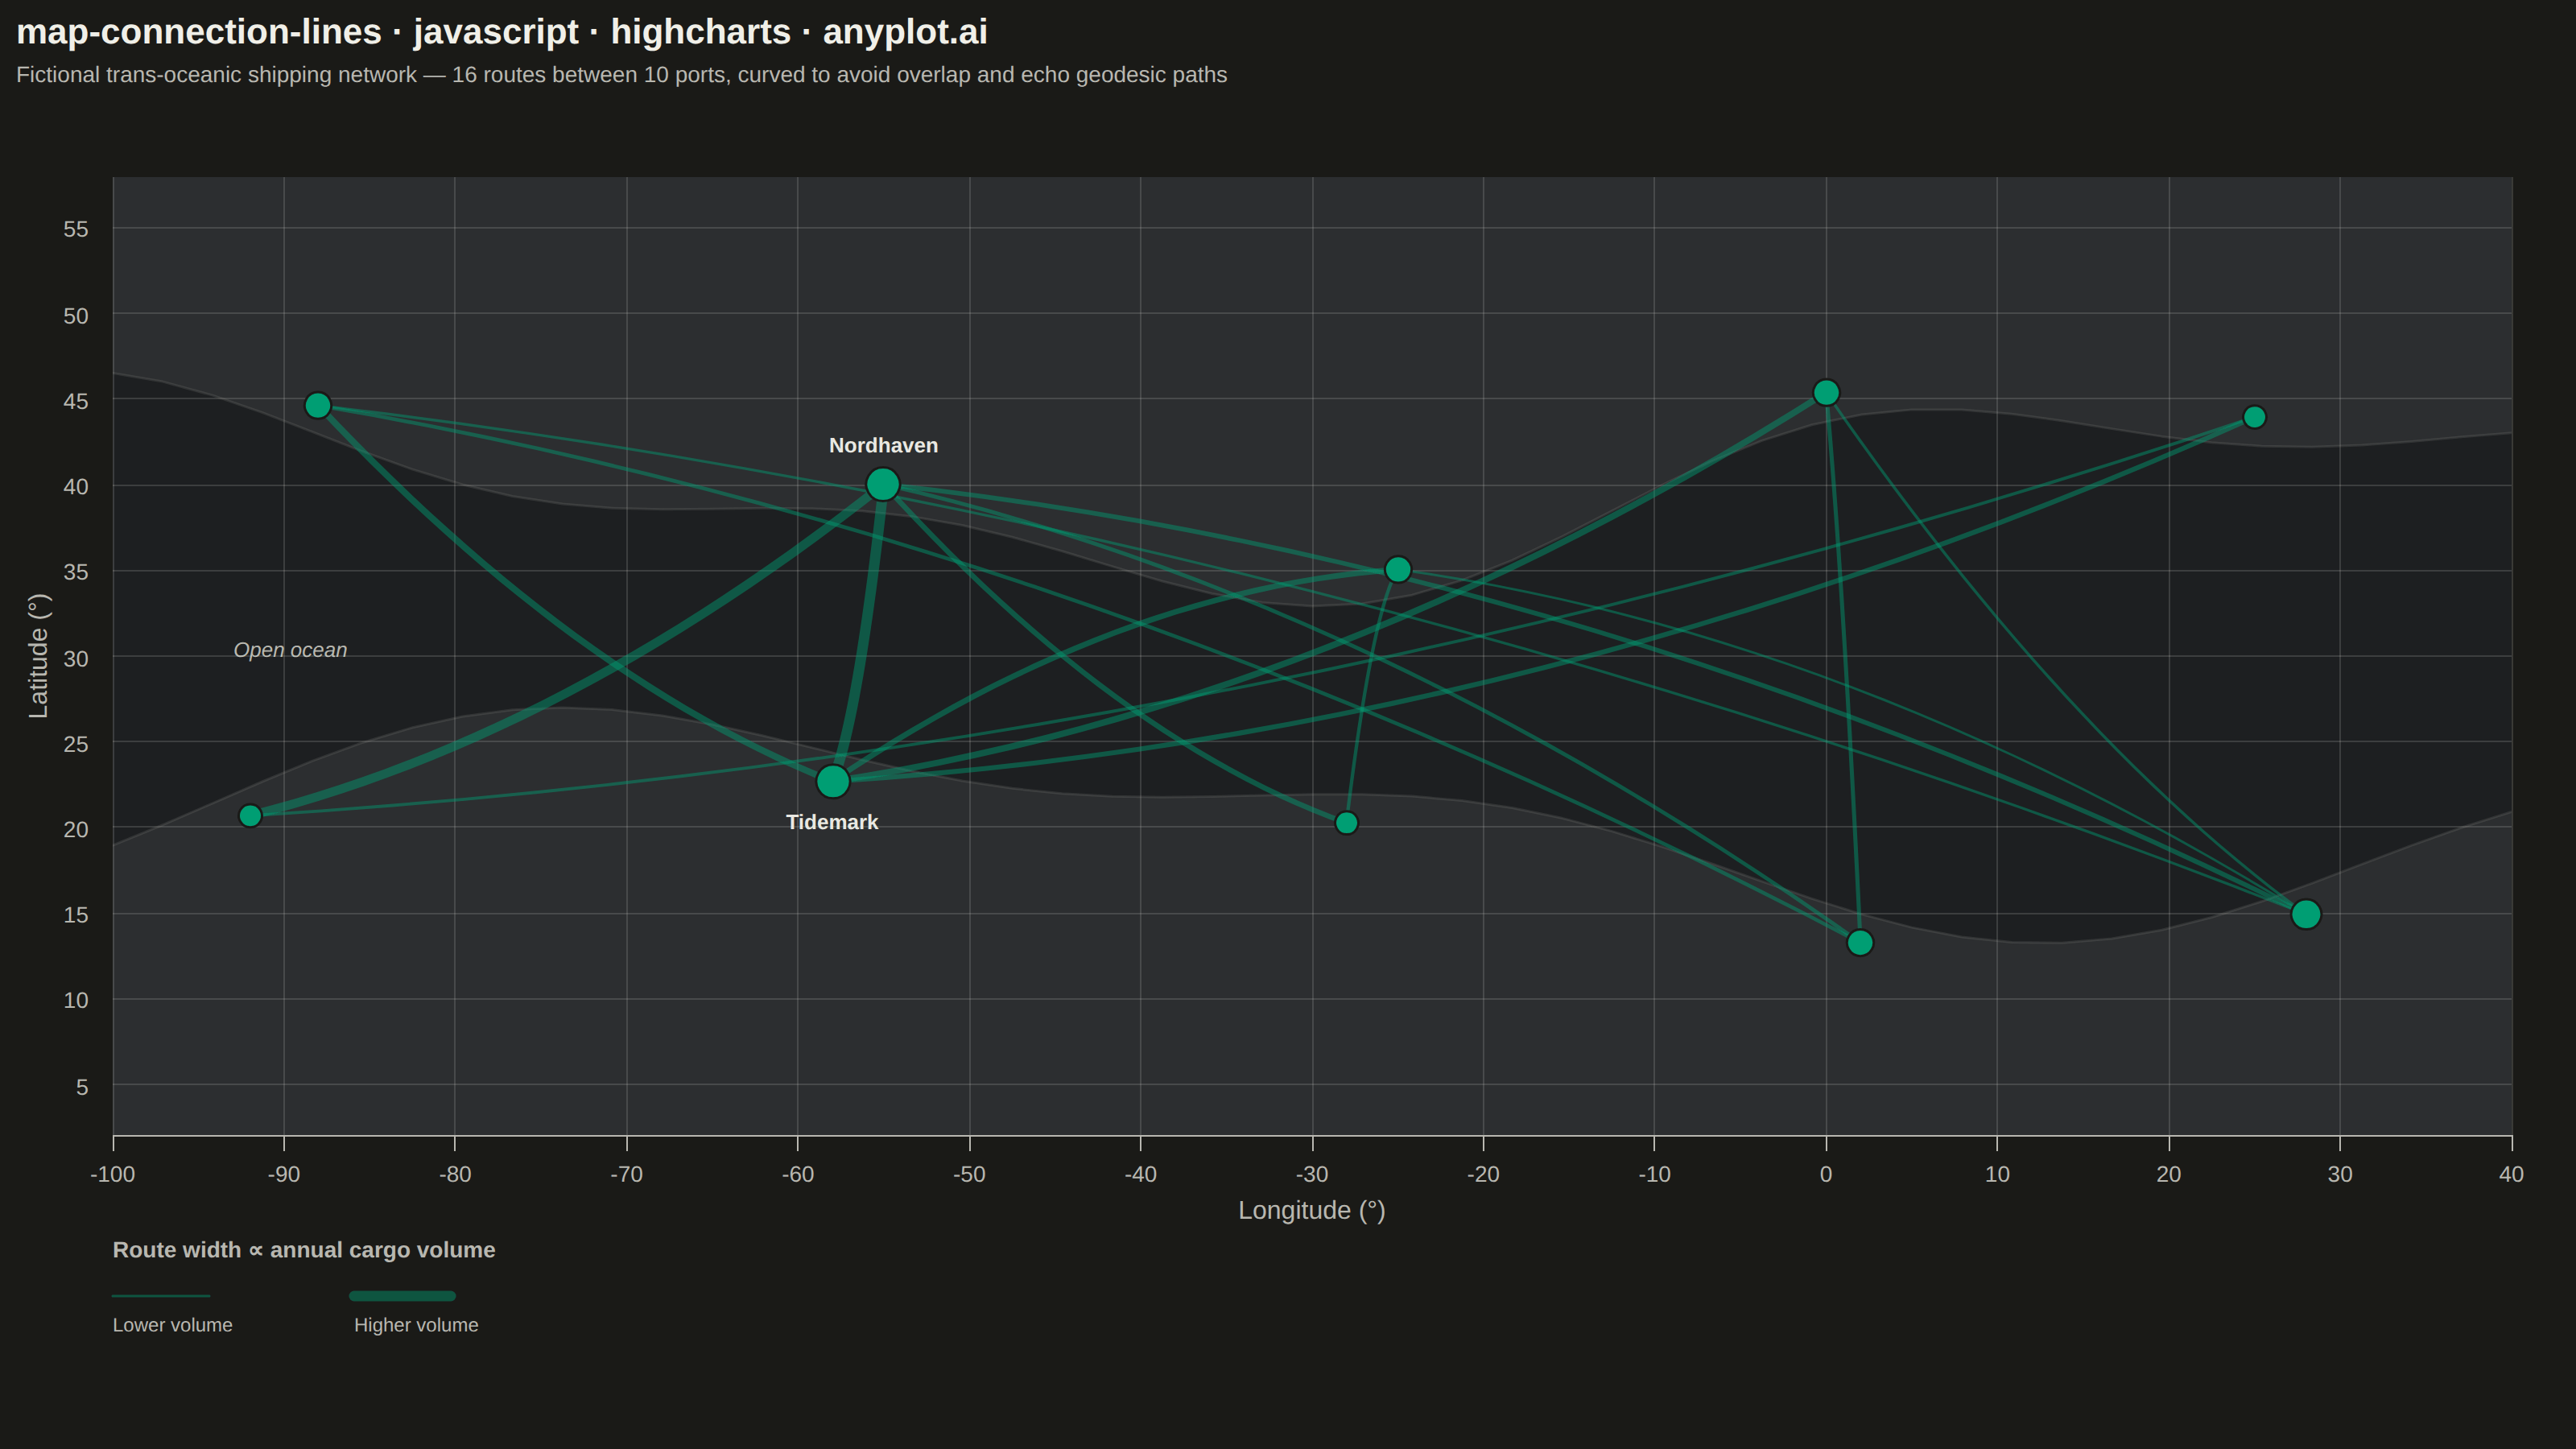
The same plot in 14 other libraries — JavaScript: Chart.js, D3.js, Apache ECharts, MUI X Charts; Python: Altair, Bokeh, lets-plot, Matplotlib, Plotly, plotnine, Pygal, Seaborn; R: ggplot2; Julia: Makie.jl. Compare all 15 side by side: Connection Lines Map (Origin-Destination) in Python, R, Julia and JavaScript.
A geographic map visualization showing connection lines (arcs or great circles) between pairs of locations. This plot excels at revealing spatial patterns in flows, routes, and relationships between places. The curved lines naturally represent shortest paths on Earth's surface while avoiding visual overlap with straight lines. Line properties like thickness or color can encode additional variables such as traffic volume or connection type.
// anyplot.ai
// map-connection-lines: Connection Lines Map (Origin-Destination)
// Library: highcharts 12.6.0 | JavaScript 22.23.2
// Quality: 93/100 | Created: 2026-08-26

const t = window.ANYPLOT_TOKENS;

// --- Layout constants --------------------------------------------------------
// The mount is a fixed 1600×900 CSS box (harness renders at deviceScaleFactor 2
// -> 3200×1800 PNG). Margins are explicit (not "spacing") so the plot-area pixel
// size is known at codegen time, letting the latitude span be derived from the
// longitude span + the plot's pixel aspect ratio (keeps the stylized coastlines
// from looking stretched).
const MOUNT_WIDTH = 1600;
const MOUNT_HEIGHT = 900;
const MARGIN_LEFT = 70;
const MARGIN_RIGHT = 40;
const MARGIN_TOP = 110;
const MARGIN_BOTTOM = 195; // x-axis title/ticks + gap + hand-drawn route-width legend
const PLOT_WIDTH = MOUNT_WIDTH - MARGIN_LEFT - MARGIN_RIGHT;
const PLOT_HEIGHT = MOUNT_HEIGHT - MARGIN_TOP - MARGIN_BOTTOM;

// Fictional trans-oceanic geography (the core Highcharts bundle has no maps
// module — see prompts/library/highcharts.md — so the coastline is a hand-drawn
// stylized curve, not surveyed data). Longitude/latitude are still genuine
// coordinates so the axes read like a real map.
const LON_MIN = -100;
const LON_MAX = 40;
const LON_RANGE = LON_MAX - LON_MIN;
const LAT_MID = 30;
const LAT_RANGE = LON_RANGE * (PLOT_HEIGHT / PLOT_WIDTH);
const LAT_MIN = LAT_MID - LAT_RANGE / 2;
const LAT_MAX = LAT_MID + LAT_RANGE / 2;

// --- Stylized coastlines (base-map context) ----------------------------------
// North landmass sits above northCoastY(lon); south landmass sits below
// southCoastY(lon). The band between them is open ocean, wide enough for the
// route arcs to bow through without hugging the coastline.
function northCoastY(x) {
  const base = LAT_MID + 0.17 * LAT_RANGE;
  return (
    base +
    0.09 * LAT_RANGE * Math.sin((x / LON_RANGE) * Math.PI * 2.3 + 0.4) +
    0.04 * LAT_RANGE * Math.sin((x / LON_RANGE) * Math.PI * 5.4 + 1.6)
  );
}
function southCoastY(x) {
  const base = LAT_MID - 0.17 * LAT_RANGE;
  return (
    base -
    0.09 * LAT_RANGE * Math.sin((x / LON_RANGE) * Math.PI * 1.9 + 1.1) -
    0.04 * LAT_RANGE * Math.sin((x / LON_RANGE) * Math.PI * 4.6 + 0.2)
  );
}
const COAST_SAMPLES = 48;
const northCoastline = [];
const southCoastline = [];
for (let i = 0; i <= COAST_SAMPLES; i++) {
  const x = LON_MIN + (i / COAST_SAMPLES) * LON_RANGE;
  northCoastline.push([x, northCoastY(x)]);
  southCoastline.push([x, southCoastY(x)]);
}

// --- Ports (origin/destination endpoints) ------------------------------------
// Longitude picked freely; latitude is pinned to the local coastline value plus
// a small inset so every port sits right at the shoreline.
const PORT_INSET = 0.03 * LAT_RANGE;
function northPort(name, lon) {
  return { name, lon, lat: northCoastY(lon) + PORT_INSET };
}
function southPort(name, lon) {
  return { name, lon, lat: southCoastY(lon) - PORT_INSET };
}

const NORTH_PORTS = [
  northPort("Portavale", -88),
  northPort("Nordhaven", -55),
  northPort("Calderport", -25),
  northPort("Ashcliff", 0),
  northPort("Brightmoor", 25),
];
const SOUTH_PORTS = [
  southPort("Suncastle", -92),
  southPort("Tidemark", -58),
  southPort("Coralbay", -28),
  southPort("Saltmere", 2),
  southPort("Palmcross", 28),
];

// --- Routes: [originIdx, destIdx, annual cargo volume in thousand TEU] -------
// Nordhaven and Tidemark are the two hub ports — busiest by connection count,
// carrying the story of a hub-and-spoke shipping network.
const ROUTES = [
  [0, 1, 180],
  [0, 3, 90],
  [0, 4, 55],
  [1, 0, 260],
  [1, 1, 310],
  [1, 2, 140],
  [1, 3, 95],
  [1, 4, 120],
  [2, 1, 150],
  [2, 2, 80],
  [2, 4, 45],
  [3, 1, 175],
  [3, 3, 100],
  [3, 4, 60],
  [4, 0, 70],
  [4, 1, 130],
];
const ROUTE_VALUES = ROUTES.map((r) => r[2]);
const MIN_VALUE = Math.min(...ROUTE_VALUES);
const MAX_VALUE = Math.max(...ROUTE_VALUES);
const MIN_WIDTH = 1.5;
const MAX_WIDTH = 6.5;
function widthForValue(value) {
  const frac = (value - MIN_VALUE) / (MAX_VALUE - MIN_VALUE);
  return MIN_WIDTH + frac * (MAX_WIDTH - MIN_WIDTH);
}

// --- Arc geometry -------------------------------------------------------------
// Quadratic Bezier with the control point's longitude fixed at the midpoint
// collapses x(t) to a plain linear interpolation between the endpoints, so the
// sampled longitude is always monotonic — each arc is safe as its own
// Highcharts line series (core `requireSorting` would otherwise reorder a
// non-monotonic point list and scramble the curve, exactly like the coastline
// pitfall documented in prompts/library/highcharts.md-adjacent implementations).
// The latitude control point bows toward the ocean's mid-line, approximating
// the curvature of a great-circle path.
const ARC_SAMPLES = 28;
function arcPoints(origin, dest) {
  const avgLat = (origin.lat + dest.lat) / 2;
  // Capped so the bulge stays inside the open-ocean band regardless of route
  // length — an uncapped bow on the longest routes would arc into the
  // landmasses instead of curving through water.
  const bow = Math.min(8, Math.max(5, 0.12 * Math.abs(dest.lon - origin.lon)));
  // Bow toward the ocean's mid-latitude so the arc bulges through open water
  // instead of cutting the straight chord closer to either coastline.
  const controlLat = avgLat + Math.sign(LAT_MID - avgLat || 1) * bow;
  const points = [];
  for (let i = 0; i <= ARC_SAMPLES; i++) {
    const tt = i / ARC_SAMPLES;
    const lon = origin.lon + tt * (dest.lon - origin.lon);
    const lat =
      (1 - tt) * (1 - tt) * origin.lat +
      2 * (1 - tt) * tt * controlLat +
      tt * tt * dest.lat;
    points.push([lon, lat]);
  }
  return points;
}

// --- Colors --------------------------------------------------------------
function hexToRgb(hex) {
  const n = parseInt(hex.slice(1), 16);
  return [(n >> 16) & 255, (n >> 8) & 255, n & 255];
}
const brandRgb = hexToRgb(t.palette[0]);
const routeColor = `rgba(${brandRgb[0]},${brandRgb[1]},${brandRgb[2]},0.45)`;
const landRgb = hexToRgb(t.inkSoft);
const landColor = `rgba(${landRgb[0]},${landRgb[1]},${landRgb[2]},0.14)`; // land -> neutral chrome, recessive
const waterRgb = hexToRgb(t.palette[2]); // #4467A3 -> semantic water/sky exception
const waterColor = `rgba(${waterRgb[0]},${waterRgb[1]},${waterRgb[2]},0.07)`;

// --- Port markers, sized by connection count ----------------------------------
function portDegree(list, idx) {
  return ROUTES.filter((r) =>
    list === NORTH_PORTS ? r[0] === idx : r[1] === idx,
  ).length;
}
function portData(list) {
  return list.map((p, idx) => {
    const degree = portDegree(list, idx);
    return {
      x: p.lon,
      y: p.lat,
      name: p.name,
      degree,
      marker: { radius: 5 + degree * 1.1 },
    };
  });
}
const portSeriesData = [...portData(NORTH_PORTS), ...portData(SOUTH_PORTS)];

// --- Route (arc) series --------------------------------------------------
const routeSeries = ROUTES.map(([oIdx, dIdx, value]) => {
  const origin = NORTH_PORTS[oIdx];
  const dest = SOUTH_PORTS[dIdx];
  return {
    type: "line",
    name: `${origin.name} → ${dest.name}`,
    data: arcPoints(origin, dest),
    color: routeColor,
    lineWidth: widthForValue(value),
    marker: { enabled: false },
    showInLegend: false,
    zIndex: 2,
    custom: { value },
    tooltip: {
      pointFormatter() {
        return `<b>${this.series.name}</b><br/>Cargo: ${this.series.userOptions.custom.value}k TEU / yr`;
      },
    },
  };
});

// --- Chart -----------------------------------------------------------------
const title = "map-connection-lines · javascript · highcharts · anyplot.ai";

function drawWidthLegend(chart) {
  const r = chart.renderer;
  const x0 = chart.plotLeft;
  const y0 = chart.plotTop + chart.plotHeight + 90;
  const gap = 150;
  const samples = [
    { label: "Lower volume", w: MIN_WIDTH },
    { label: "Higher volume", w: MAX_WIDTH },
  ];
  r.text("Route width ∝ annual cargo volume", x0, y0 - 14)
    .css({ color: t.inkSoft, fontSize: "14px", fontWeight: "600" })
    .add();
  samples.forEach((s, i) => {
    const lx = x0 + i * gap;
    r.path(["M", lx, y0 + 10, "L", lx + 60, y0 + 10])
      .attr({
        "stroke-width": s.w,
        stroke: routeColor,
        "stroke-linecap": "round",
      })
      .add();
    r.text(s.label, lx, y0 + 32)
      .css({ color: t.inkSoft, fontSize: "12px" })
      .add();
  });
}

function drawHubLabels(chart) {
  const hubs = [NORTH_PORTS[1], SOUTH_PORTS[1]]; // Nordhaven, Tidemark
  hubs.forEach((h) => {
    const px = chart.xAxis[0].toPixels(h.lon, false);
    const py =
      chart.yAxis[0].toPixels(h.lat, false) + (h === NORTH_PORTS[1] ? -20 : 30);
    chart.renderer
      .text(h.name, px, py)
      .attr({ align: "center" })
      .css({ color: t.ink, fontSize: "13px", fontWeight: "700" })
      .add();
  });
}

function drawOceanLabel(chart) {
  const px = chart.xAxis[0].toPixels(LON_MIN + 0.05 * LON_RANGE, false);
  const py = chart.yAxis[0].toPixels(LAT_MID, false);
  chart.renderer
    .text("Open ocean", px, py)
    .css({ color: t.inkSoft, fontSize: "13px", fontStyle: "italic" })
    .add();
}

Highcharts.chart(
  "container",
  {
    chart: {
      type: "line",
      backgroundColor: "transparent",
      plotBackgroundColor: waterColor, // whole plot area reads as ocean; land fills sit on top
      animation: false,
      style: { fontFamily: "inherit" },
      marginLeft: MARGIN_LEFT,
      marginRight: MARGIN_RIGHT,
      marginTop: MARGIN_TOP,
      marginBottom: MARGIN_BOTTOM,
    },
    credits: { enabled: false },
    colors: t.palette,
    title: {
      text: title,
      align: "left",
      style: { color: t.ink, fontSize: "22px", fontWeight: "600" },
    },
    subtitle: {
      text: "Fictional trans-oceanic shipping network — 16 routes between 10 ports, curved to avoid overlap and echo geodesic paths",
      align: "left",
      style: { color: t.inkSoft, fontSize: "14px" },
    },
    xAxis: {
      min: LON_MIN,
      max: LON_MAX,
      startOnTick: false,
      endOnTick: false,
      title: {
        text: "Longitude (°)",
        style: { color: t.inkSoft, fontSize: "16px" },
      },
      lineColor: t.inkSoft,
      tickColor: t.inkSoft,
      gridLineColor: t.grid,
      gridLineWidth: 1,
      labels: { style: { color: t.inkSoft, fontSize: "14px" } },
    },
    yAxis: {
      min: LAT_MIN,
      max: LAT_MAX,
      startOnTick: false,
      endOnTick: false,
      title: {
        text: "Latitude (°)",
        style: { color: t.inkSoft, fontSize: "16px" },
      },
      lineColor: t.inkSoft,
      tickColor: t.inkSoft,
      gridLineColor: t.grid,
      gridLineWidth: 1,
      labels: { style: { color: t.inkSoft, fontSize: "14px" } },
    },
    legend: { enabled: false },
    tooltip: {
      backgroundColor: t.elevatedBg,
      borderColor: t.inkSoft,
      style: { color: t.ink, fontSize: "13px" },
      useHTML: false,
    },
    plotOptions: {
      series: { animation: false },
    },
    series: [
      {
        type: "area",
        name: "North landmass",
        data: northCoastline,
        threshold: LAT_MAX,
        color: landColor,
        lineWidth: 1.5,
        lineColor: landColor,
        marker: { enabled: false },
        enableMouseTracking: false,
        showInLegend: false,
        zIndex: 0,
      },
      {
        type: "area",
        name: "South landmass",
        data: southCoastline,
        threshold: LAT_MIN,
        color: landColor,
        lineWidth: 1.5,
        lineColor: landColor,
        marker: { enabled: false },
        enableMouseTracking: false,
        showInLegend: false,
        zIndex: 0,
      },
      ...routeSeries,
      {
        type: "scatter",
        name: "Ports",
        data: portSeriesData,
        color: t.palette[0],
        marker: { symbol: "circle", lineWidth: 1.5, lineColor: t.pageBg },
        showInLegend: false,
        zIndex: 3,
        tooltip: {
          pointFormatter() {
            return `<b>${this.name}</b><br/>${this.degree} route${this.degree === 1 ? "" : "s"}`;
          },
        },
      },
    ],
  },
  function (chart) {
    drawWidthLegend(chart);
    drawHubLabels(chart);
    drawOceanLabel(chart);
  },
);
Runnable source as JSON, for any HTTP client: https://api.anyplot.ai/specs/map-connection-lines/highcharts/code. Any spec id and library id listed in llms-full.txt fit the same URL shape; every URL below is complete and callable.
{
  "spec_id": "map-connection-lines",
  "language": "javascript",
  "library": "highcharts",
  "page": "https://anyplot.ai/map-connection-lines/javascript/highcharts",
  "hub": "https://anyplot.ai/map-connection-lines",
  "code_json": "https://api.anyplot.ai/specs/map-connection-lines/highcharts/code",
  "spec_json": "https://api.anyplot.ai/specs/map-connection-lines",
  "render_light_png": "https://storage.googleapis.com/anyplot-images/plots/map-connection-lines/javascript/highcharts/plot-light.png",
  "render_dark_png": "https://storage.googleapis.com/anyplot-images/plots/map-connection-lines/javascript/highcharts/plot-dark.png",
  "interactive_light_html": "https://storage.googleapis.com/anyplot-images/plots/map-connection-lines/javascript/highcharts/plot-light.html",
  "interactive_dark_html": "https://storage.googleapis.com/anyplot-images/plots/map-connection-lines/javascript/highcharts/plot-dark.html",
  "quality_score": 93.0,
  "license": "MIT",
  "guide": "https://anyplot.ai/llms.txt"
}
Part of Connection Lines Map (Origin-Destination) on anyplot.ai.