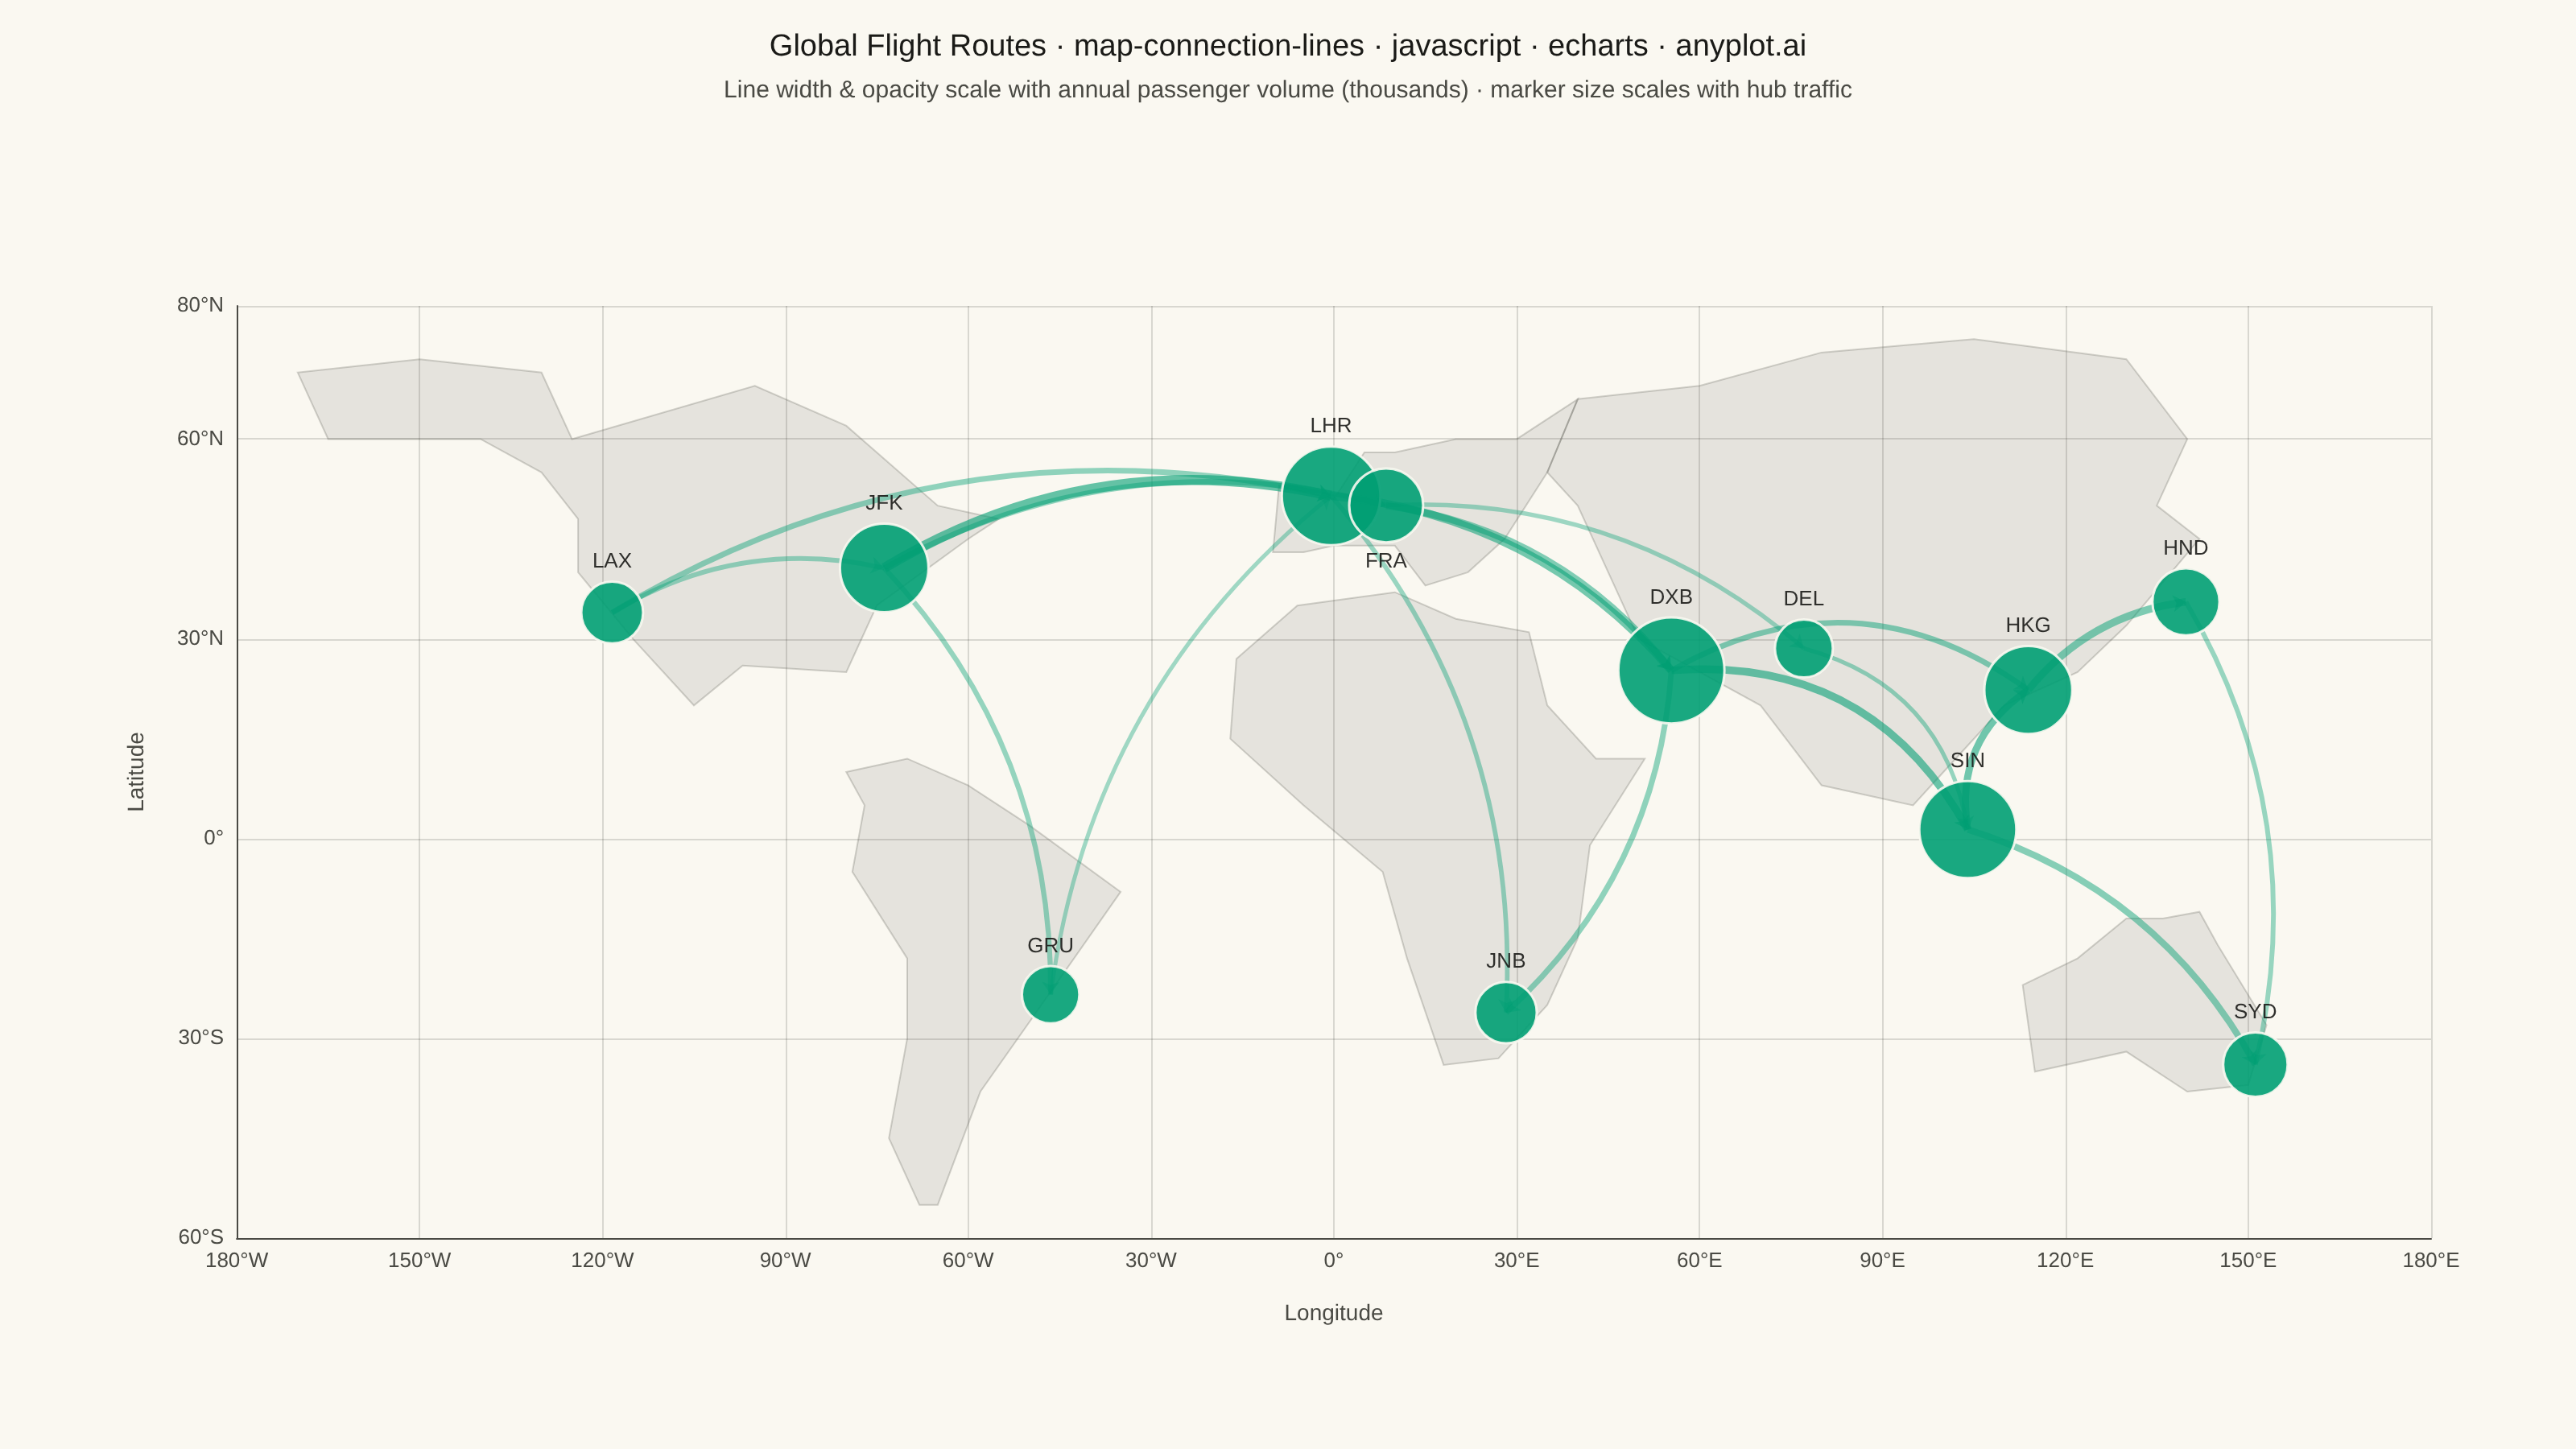
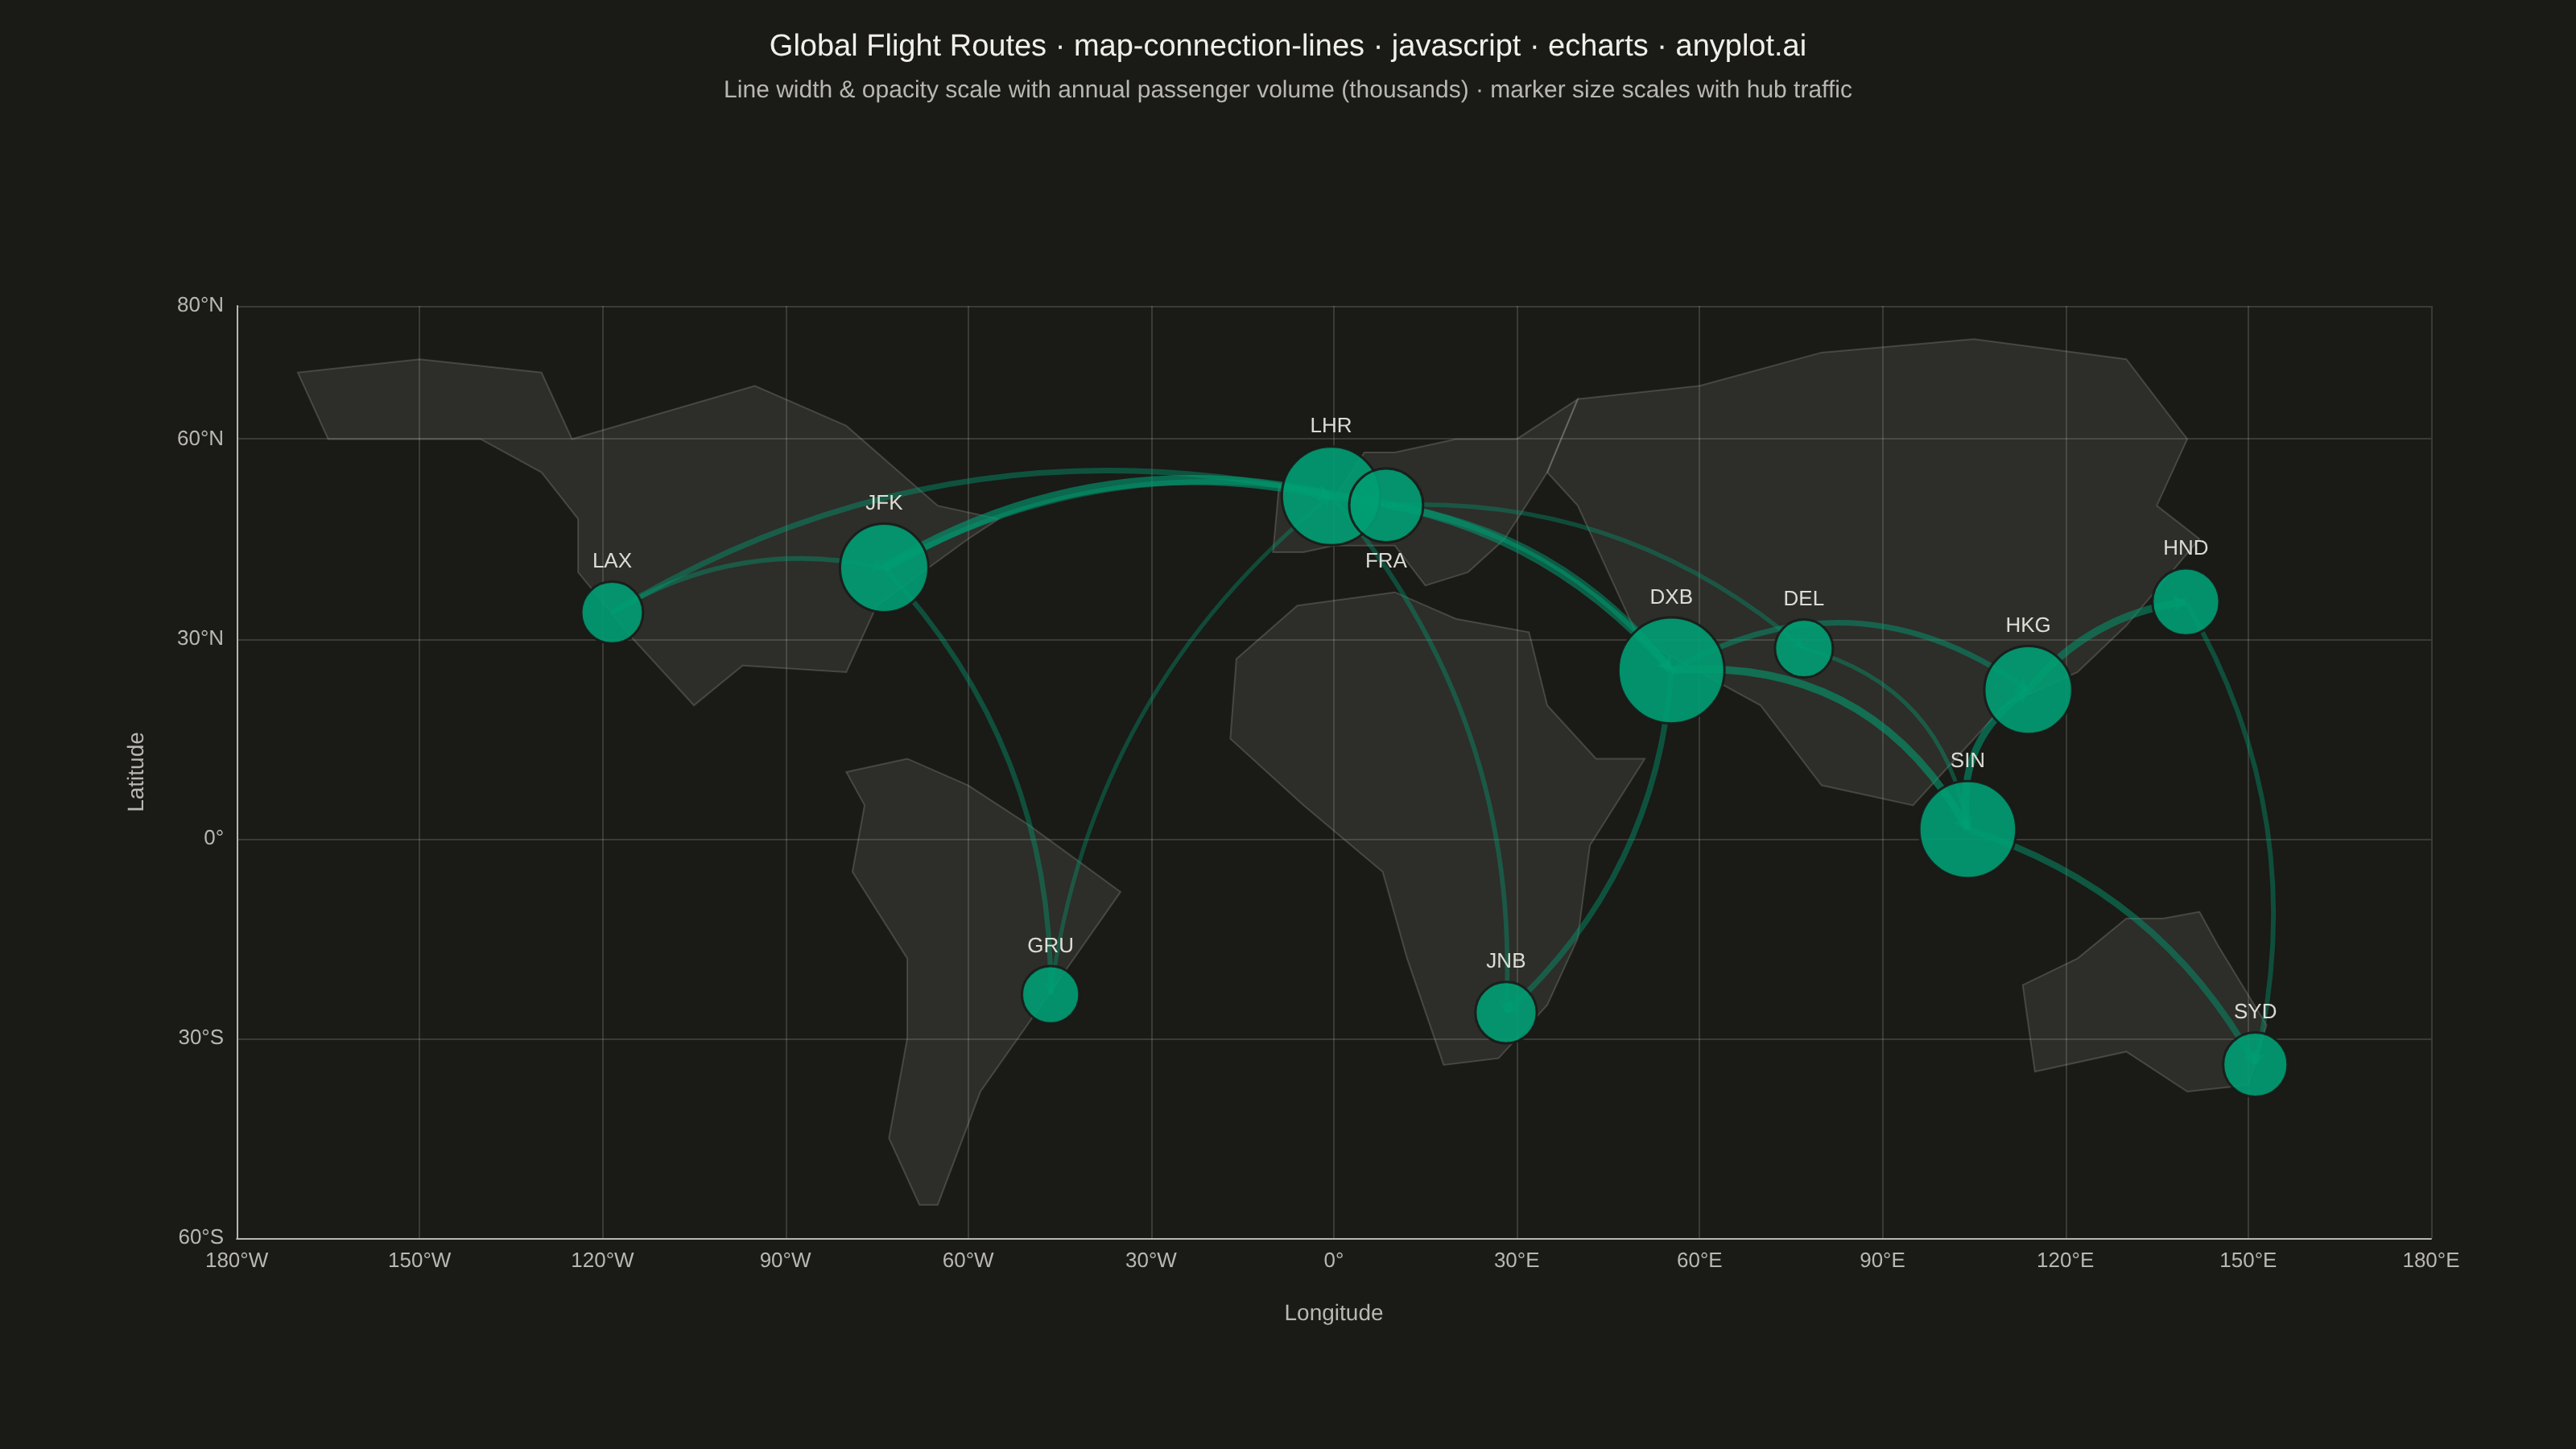
The same plot in 14 other libraries — JavaScript: Chart.js, D3.js, Highcharts, MUI X Charts; Python: Altair, Bokeh, lets-plot, Matplotlib, Plotly, plotnine, Pygal, Seaborn; R: ggplot2; Julia: Makie.jl. Compare all 15 side by side: Connection Lines Map (Origin-Destination) in Python, R, Julia and JavaScript.
A geographic map visualization showing connection lines (arcs or great circles) between pairs of locations. This plot excels at revealing spatial patterns in flows, routes, and relationships between places. The curved lines naturally represent shortest paths on Earth's surface while avoiding visual overlap with straight lines. Line properties like thickness or color can encode additional variables such as traffic volume or connection type.
// anyplot.ai
// map-connection-lines: Connection Lines Map (Origin-Destination)
// Library: echarts 6.1.0 | JavaScript 22.23.2
// Quality: 88/100 | Created: 2026-08-26

const t = window.ANYPLOT_TOKENS;

// --- Data (in-memory, deterministic): a global hub-airport flight network --
const airports = [
  { code: "JFK", lon: -73.7781, lat: 40.6413 },
  { code: "LAX", lon: -118.4085, lat: 33.9416 },
  { code: "GRU", lon: -46.4731, lat: -23.4356 },
  { code: "LHR", lon: -0.4614, lat: 51.47 },
  { code: "FRA", lon: 8.5706, lat: 50.0379 },
  { code: "JNB", lon: 28.246, lat: -26.1392 },
  { code: "DXB", lon: 55.3644, lat: 25.2532 },
  { code: "DEL", lon: 77.1025, lat: 28.5562 },
  { code: "SIN", lon: 103.9915, lat: 1.3644 },
  { code: "HKG", lon: 113.9185, lat: 22.308 },
  { code: "HND", lon: 139.7798, lat: 35.5494 },
  { code: "SYD", lon: 151.1772, lat: -33.9399 },
];

// [origin, destination, annual passengers in thousands]
const routes = [
  ["JFK", "LHR", 2800],
  ["JFK", "FRA", 1200],
  ["JFK", "GRU", 1100],
  ["LAX", "JFK", 1000],
  ["LAX", "LHR", 1300],
  ["GRU", "LHR", 750],
  ["LHR", "DXB", 2200],
  ["LHR", "JNB", 950],
  ["FRA", "DXB", 1800],
  ["FRA", "DEL", 800],
  ["DXB", "JNB", 1300],
  ["DXB", "SIN", 2600],
  ["DXB", "HKG", 1700],
  ["DEL", "SIN", 1100],
  ["SIN", "HKG", 2400],
  ["SIN", "SYD", 1600],
  ["HKG", "HND", 1900],
  ["HND", "SYD", 1000],
];

const byCode = Object.fromEntries(airports.map((a) => [a.code, a]));
const maxPassengers = Math.max(...routes.map((r) => r[2]));

const traffic = {};
for (const [origin, dest, passengers] of routes) {
  traffic[origin] = (traffic[origin] || 0) + passengers;
  traffic[dest] = (traffic[dest] || 0) + passengers;
}

// Hand-simplified continent silhouettes (lon/lat vertex lists) so the plot
// reads as a base map — no bundled world GeoJSON or network fetch is
// available to this offline browser runtime, so the coastlines are
// hard-coded low-vertex approximations rather than authoritative data.
const landmasses = [
  [[-170, 70], [-150, 72], [-130, 70], [-125, 60], [-95, 68], [-80, 62], [-65, 50], [-55, 48], [-60, 45], [-75, 35], [-80, 25], [-97, 26], [-105, 20], [-115, 30], [-124, 40], [-124, 48], [-130, 55], [-140, 60], [-165, 60], [-170, 70]],
  [[-80, 10], [-77, 5], [-79, -5], [-70, -18], [-70, -30], [-73, -45], [-68, -55], [-65, -55], [-58, -38], [-48, -25], [-35, -8], [-50, 2], [-60, 8], [-70, 12], [-80, 10]],
  [[-10, 43], [-9, 53], [0, 51], [5, 58], [10, 58], [20, 60], [30, 60], [40, 66], [35, 55], [28, 45], [22, 40], [15, 38], [10, 44], [0, 44], [-5, 43], [-10, 43]],
  [[-17, 15], [-16, 27], [-6, 35], [10, 37], [20, 33], [32, 31], [35, 20], [43, 12], [51, 12], [42, -1], [40, -15], [35, -25], [27, -33], [18, -34], [12, -18], [8, -5], [-5, 5], [-17, 15]],
  [[40, 66], [60, 68], [80, 73], [105, 75], [130, 72], [140, 60], [135, 50], [142, 45], [130, 32], [122, 25], [110, 20], [100, 10], [95, 5], [80, 8], [70, 20], [60, 25], [50, 30], [45, 40], [40, 50], [35, 55], [40, 66]],
  [[113, -22], [122, -18], [130, -12], [136, -12], [142, -11], [145, -16], [153, -28], [150, -37], [140, -38], [130, -32], [115, -35], [113, -22]],
];

// The DXB/DEL/HKG/SIN hub cluster sits close together, so its arcs converge
// and overlap; bow those routes out further and thin them slightly so
// individual connections stay distinguishable.
const denseCluster = new Set(["DXB", "DEL", "HKG", "SIN"]);
// LHR and FRA sit ~9° of longitude apart, close enough that two top-anchored
// labels crowd each other; drop FRA's label below its marker instead.
const labelPositionOverrides = { FRA: "bottom" };

const lineData = routes.map(([origin, dest, passengers]) => {
  const share = passengers / maxPassengers;
  const inDenseCluster = denseCluster.has(origin) && denseCluster.has(dest);
  return {
    coords: [
      [byCode[origin].lon, byCode[origin].lat],
      [byCode[dest].lon, byCode[dest].lat],
    ],
    value: passengers,
    lineStyle: {
      width: (1.2 + share * 5) * (inDenseCluster ? 0.8 : 1),
      opacity: 0.28 + share * 0.32,
      curveness: inDenseCluster ? 0.32 : 0.2,
    },
  };
});

const nodeData = airports.map((a) => ({
  name: a.code,
  value: [a.lon, a.lat, traffic[a.code]],
  label: labelPositionOverrides[a.code] ? { position: labelPositionOverrides[a.code] } : undefined,
}));

// --- Init --------------------------------------------------------------
const chart = echarts.init(document.getElementById("container"));

// --- Option --------------------------------------------------------------
const title = "Global Flight Routes · map-connection-lines · javascript · echarts · anyplot.ai";
const titleFontSize = Math.round(22 * Math.min(1, 67 / title.length));

chart.setOption({
  animation: false,
  backgroundColor: "transparent",
  color: [t.palette[0]],
  title: {
    text: title,
    subtext: "Line width & opacity scale with annual passenger volume (thousands) · marker size scales with hub traffic",
    left: "center",
    textStyle: { color: t.ink, fontSize: titleFontSize, fontWeight: 500 },
    subtextStyle: { color: t.inkSoft, fontSize: 15 },
  },
  tooltip: {
    trigger: "item",
    formatter: (p) =>
      p.seriesType === "lines" ? `${p.data.value}k passengers/yr` : `${p.name}: ${p.value[2]}k passengers`,
  },
  grid: { left: 110, right: 90, top: 190, bottom: 110, containLabel: true },
  xAxis: {
    type: "value",
    min: -180,
    max: 180,
    interval: 30,
    name: "Longitude",
    nameLocation: "middle",
    nameGap: 40,
    nameTextStyle: { color: t.inkSoft, fontSize: 14 },
    axisLabel: {
      color: t.inkSoft,
      fontSize: 13,
      formatter: (v) => `${Math.abs(v)}°${v > 0 ? "E" : v < 0 ? "W" : ""}`,
    },
    axisLine: { onZero: false, lineStyle: { color: t.inkSoft } },
    axisTick: { show: false },
    splitLine: { show: true, lineStyle: { color: t.grid } },
  },
  yAxis: {
    type: "value",
    min: -60,
    max: 80,
    interval: 30,
    name: "Latitude",
    nameLocation: "middle",
    nameGap: 55,
    nameTextStyle: { color: t.inkSoft, fontSize: 14 },
    axisLabel: {
      color: t.inkSoft,
      fontSize: 13,
      formatter: (v) => `${Math.abs(v)}°${v > 0 ? "N" : v < 0 ? "S" : ""}`,
    },
    axisLine: { onZero: false, lineStyle: { color: t.inkSoft } },
    axisTick: { show: false },
    splitLine: { show: true, lineStyle: { color: t.grid } },
  },
  series: [
    {
      name: "Landmasses",
      type: "custom",
      coordinateSystem: "cartesian2d",
      xAxisIndex: 0,
      yAxisIndex: 0,
      silent: true,
      z: 1,
      data: landmasses.map((_, i) => i),
      renderItem: (params, api) => ({
        type: "polygon",
        shape: { points: landmasses[params.dataIndex].map((p) => api.coord(p)) },
        style: { fill: t.grid, opacity: 0.6, stroke: t.inkSoft, lineWidth: 1, strokeOpacity: 0.4 },
      }),
    },
    {
      name: "Routes",
      type: "lines",
      coordinateSystem: "cartesian2d",
      xAxisIndex: 0,
      yAxisIndex: 0,
      symbol: ["none", "arrow"],
      symbolSize: [0, 8],
      data: lineData,
      lineStyle: { color: t.palette[0] },
      z: 2,
    },
    {
      name: "Airports",
      type: "scatter",
      xAxisIndex: 0,
      yAxisIndex: 0,
      data: nodeData,
      symbolSize: (val) => 12 + Math.sqrt(val[2]) * 0.55,
      itemStyle: { color: t.palette[0], opacity: 0.9, borderColor: t.pageBg, borderWidth: 1.5 },
      label: { show: true, formatter: "{b}", position: "top", color: t.ink, fontSize: 13, fontWeight: 500 },
      z: 3,
    },
  ],
});
Runnable source as JSON, for any HTTP client: https://api.anyplot.ai/specs/map-connection-lines/echarts/code. Any spec id and library id listed in llms-full.txt fit the same URL shape; every URL below is complete and callable.
{
  "spec_id": "map-connection-lines",
  "language": "javascript",
  "library": "echarts",
  "page": "https://anyplot.ai/map-connection-lines/javascript/echarts",
  "hub": "https://anyplot.ai/map-connection-lines",
  "code_json": "https://api.anyplot.ai/specs/map-connection-lines/echarts/code",
  "spec_json": "https://api.anyplot.ai/specs/map-connection-lines",
  "render_light_png": "https://storage.googleapis.com/anyplot-images/plots/map-connection-lines/javascript/echarts/plot-light.png",
  "render_dark_png": "https://storage.googleapis.com/anyplot-images/plots/map-connection-lines/javascript/echarts/plot-dark.png",
  "interactive_light_html": "https://storage.googleapis.com/anyplot-images/plots/map-connection-lines/javascript/echarts/plot-light.html",
  "interactive_dark_html": "https://storage.googleapis.com/anyplot-images/plots/map-connection-lines/javascript/echarts/plot-dark.html",
  "quality_score": 88.0,
  "license": "MIT",
  "guide": "https://anyplot.ai/llms.txt"
}
Part of Connection Lines Map (Origin-Destination) on anyplot.ai.