The same plot in 14 other libraries — JavaScript: D3.js, Apache ECharts, Highcharts, MUI X Charts; Python: Altair, Bokeh, lets-plot, Matplotlib, Plotly, plotnine, Pygal, Seaborn; R: ggplot2; Julia: Makie.jl. Compare all 15 side by side: Route Path Map in Python, R, Julia and JavaScript.
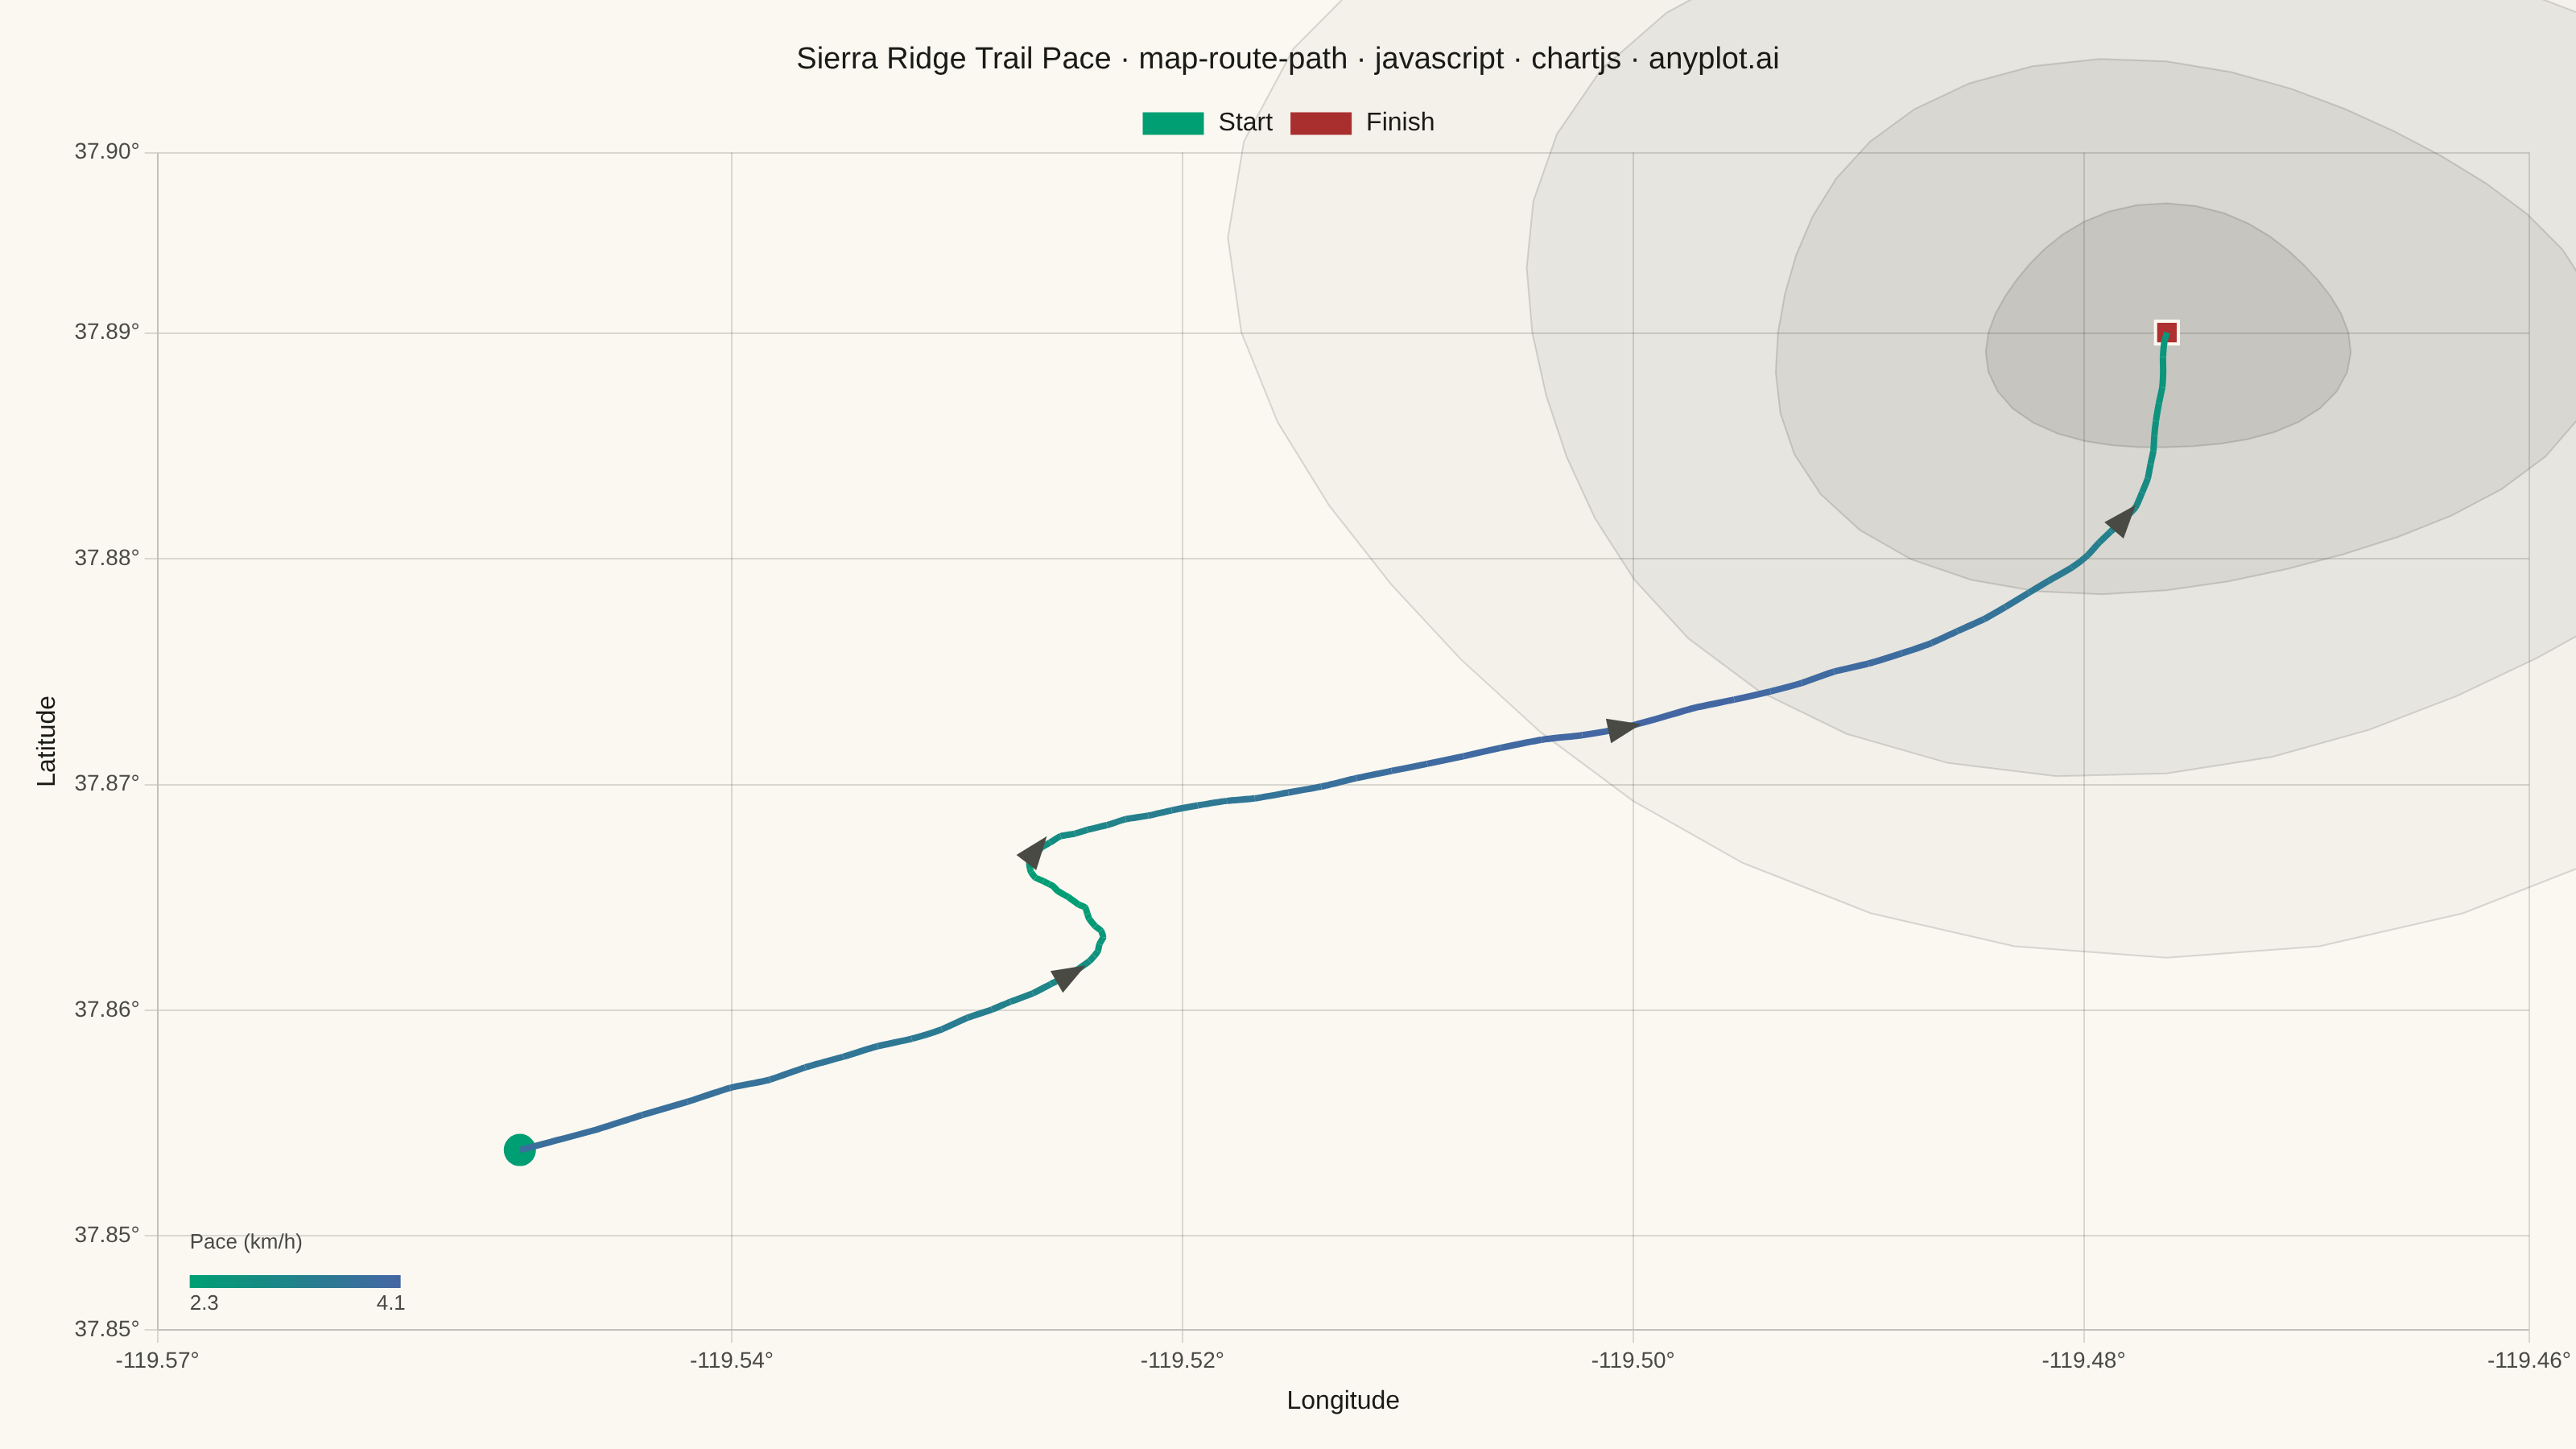
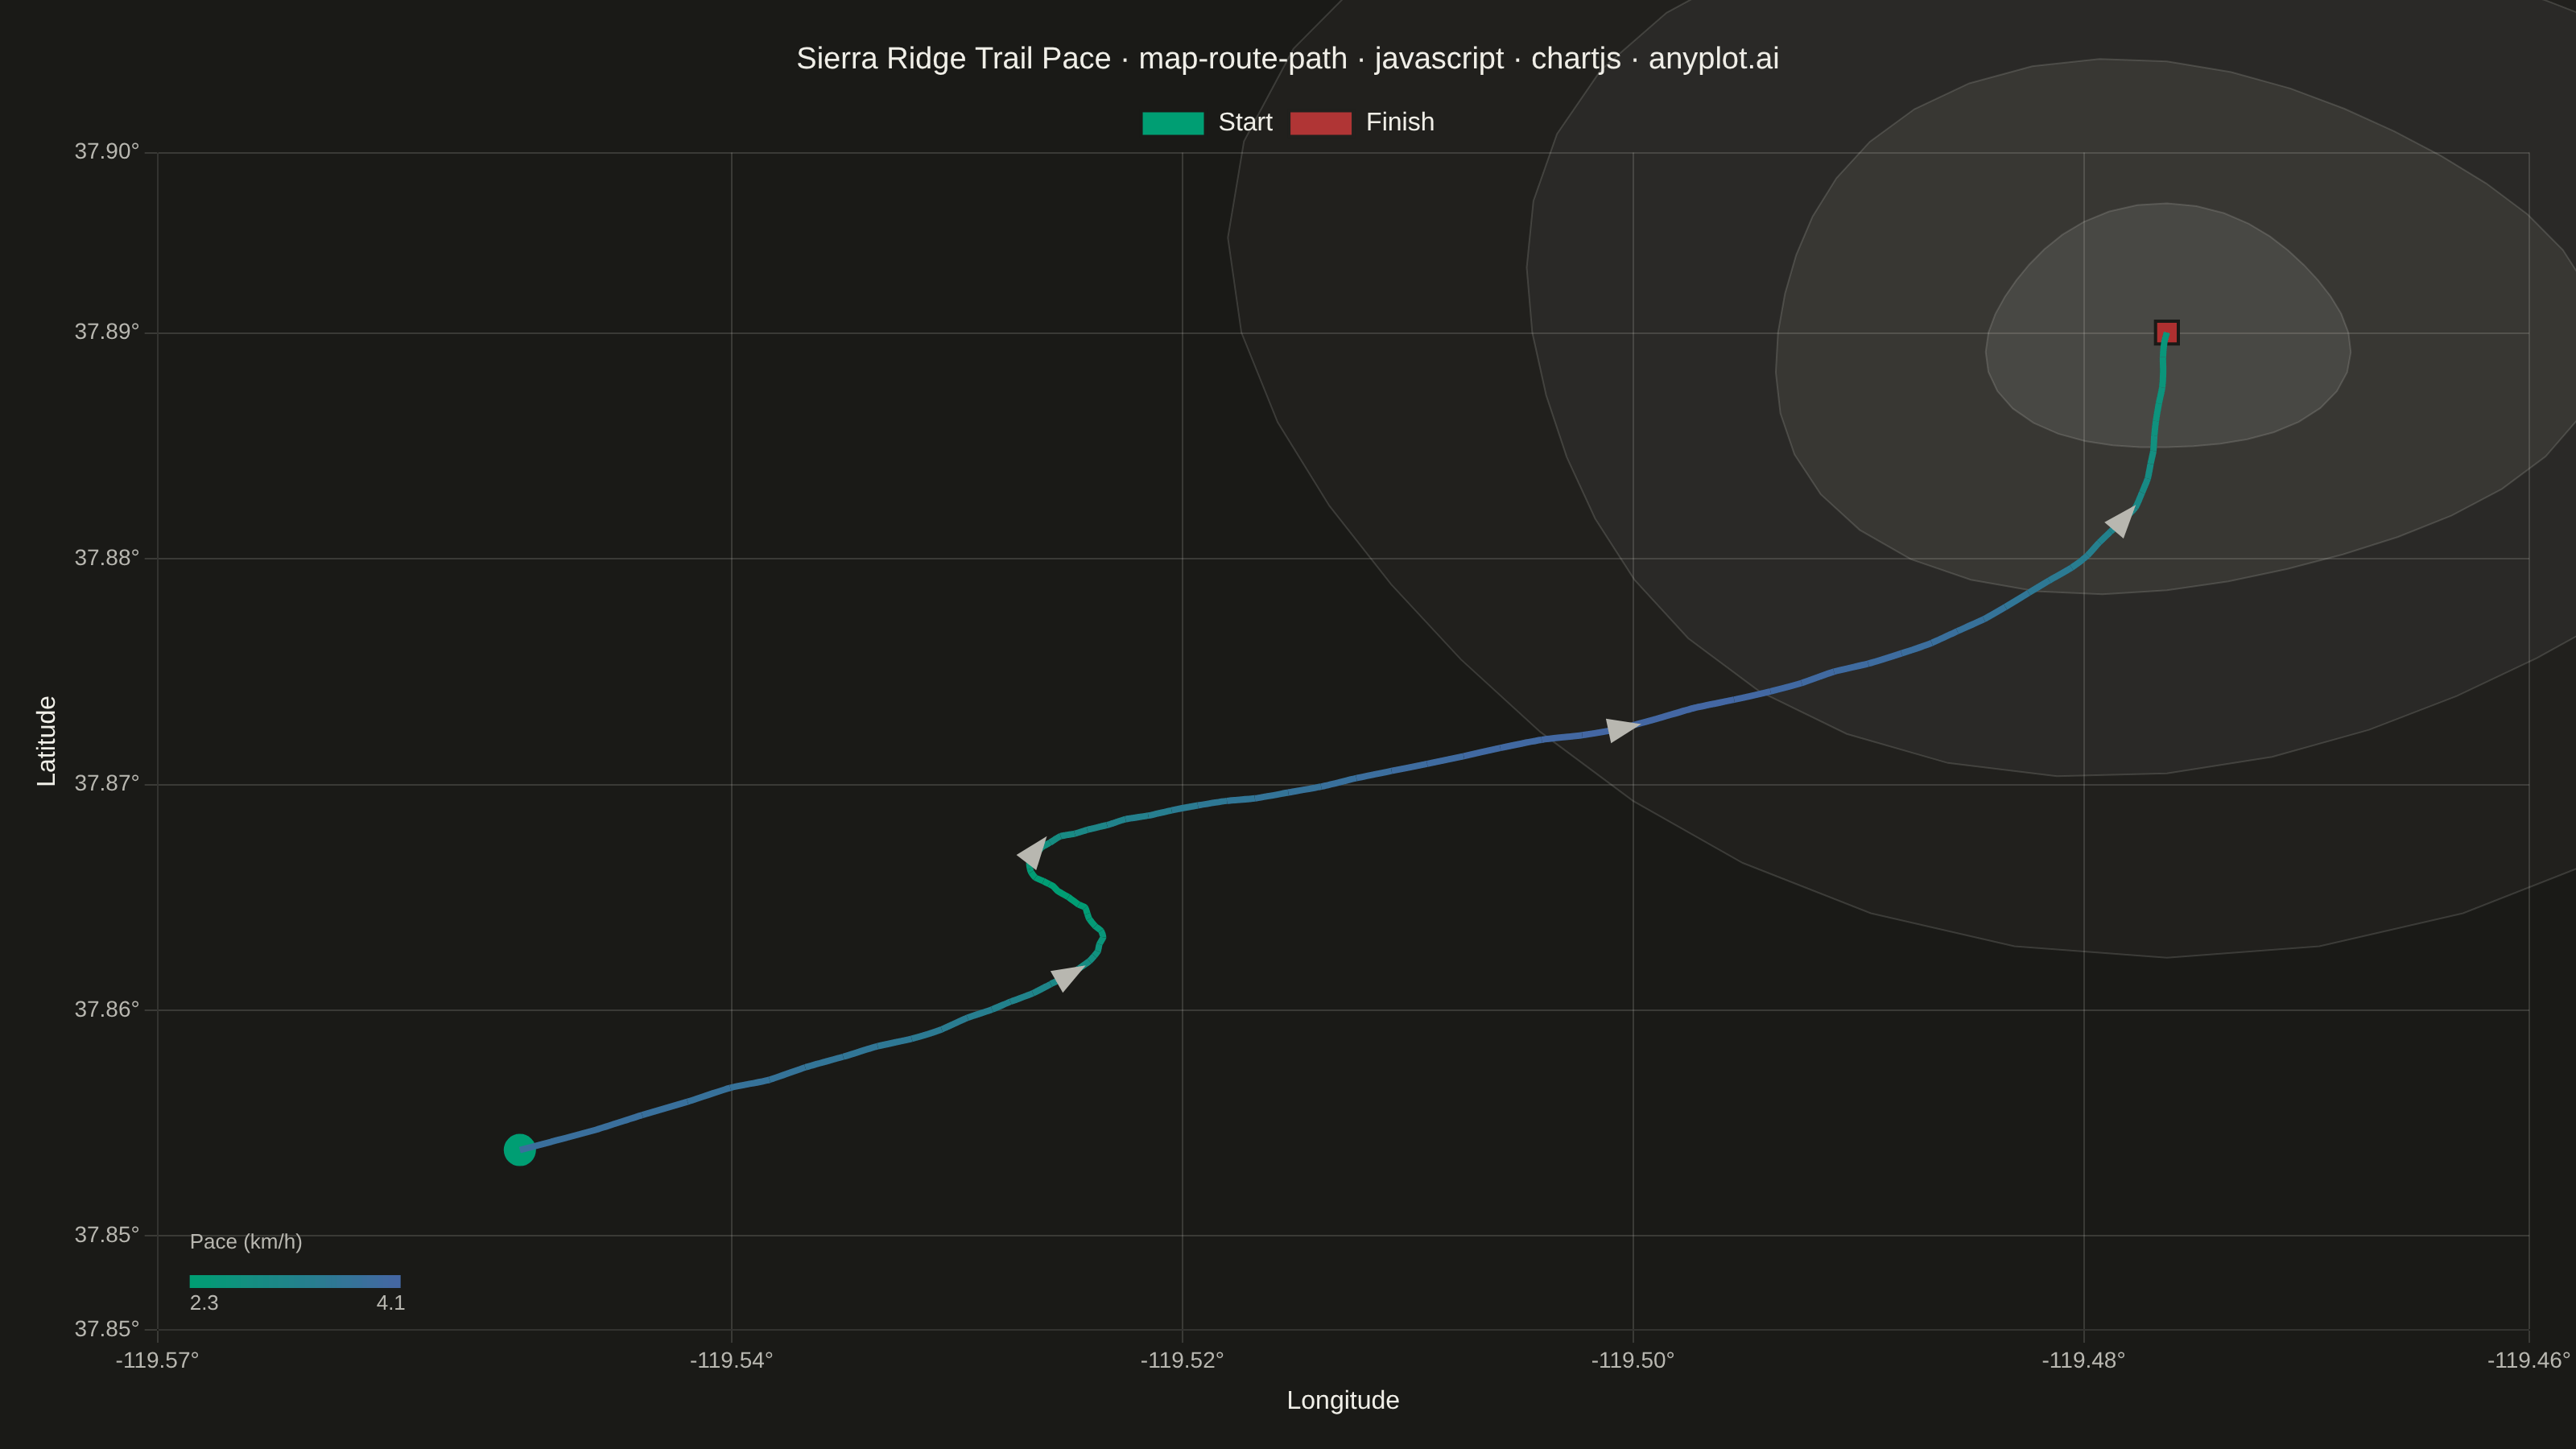
A geographic map visualization showing a connected path or route between sequential waypoints. Unlike scatter maps that display discrete points, this plot connects coordinates in order to reveal journeys, tracks, and navigation paths. Ideal for GPS data, delivery routes, and travel visualization where the sequence and continuity of movement matters.
// anyplot.ai
// map-route-path: Route Path Map
// Library: chartjs 4.4.7 | JavaScript 22.23.2
// Quality: 92/100 | Created: 2026-09-02

const t = window.ANYPLOT_TOKENS;

// --- Deterministic PRNG (LCG) ------------------------------------------------
let seed = 42;
const rand = () => {
  seed = (seed * 1664525 + 1013904223) % 4294967296;
  return seed / 4294967296;
};

// --- Data: Sierra ridge hiking-trail GPS track ------------------------------
// Local km-scale offsets converted to lon/lat around a fixed trailhead so the
// track sits on a real-looking small patch of the globe (~37.85N).
const LAT0 = 37.85;
const LON0 = -119.55;
const KM_PER_DEG_LAT = 111.0;
const KM_PER_DEG_LON = 111.0 * Math.cos((LAT0 * Math.PI) / 180);

const N = 96; // waypoints, within the spec's 50-1000 range
const rawPoints = [];
for (let i = 0; i < N; i++) {
  const s = i / (N - 1);
  // Switchback ascent profile in local km offsets (east, north of trailhead).
  const east = 6.5 * s + 1.1 * Math.sin(s * 9.5) * (1 - 0.4 * s);
  const north = 4.5 * s + 0.5 * Math.sin(s * 5.2 + 1);
  rawPoints.push({ east: east + (rand() - 0.5) * 0.05, north: north + (rand() - 0.5) * 0.05 });
}

// 3-point moving-average smoothing — raw consumer GPS tracks are noisy, per
// the spec's "apply line smoothing for noisy GPS data" note.
const points = rawPoints.map((p, i) => {
  const prev = rawPoints[Math.max(0, i - 1)];
  const next = rawPoints[Math.min(N - 1, i + 1)];
  return { east: (prev.east + p.east + next.east) / 3, north: (prev.north + p.north + next.north) / 3 };
});

// Elevation profile: climbing ridge with two false summits, in meters.
const elevations = points.map((p, i) => {
  const s = i / (N - 1);
  return 2180 + 1050 * s - 90 * Math.sin(s * 9.5) + 60 * Math.sin(s * 3.1);
});

// Cumulative time + Naismith-like pace: uphill sections cost more minutes per
// km than downhill ones, so pace naturally slows on the steep switchbacks.
const speeds = [null];
let cumMinutes = 0;
for (let i = 1; i < N; i++) {
  const dEast = (points[i].east - points[i - 1].east) * 1000; // meters
  const dNorth = (points[i].north - points[i - 1].north) * 1000;
  const distM = Math.hypot(dEast, dNorth);
  const climbM = elevations[i] - elevations[i - 1];
  const speedKmh = Math.max(1.0, 4.2 - (climbM > 0 ? climbM * 0.09 : climbM * 0.03));
  speeds.push(speedKmh);
  cumMinutes += (distM / 1000 / speedKmh) * 60;
}
speeds[0] = speeds[1];

const minSpeed = Math.min(...speeds);
const maxSpeed = Math.max(...speeds);

const waypoints = points.map((p, i) => ({
  lon: LON0 + p.east / KM_PER_DEG_LON,
  lat: LAT0 + p.north / KM_PER_DEG_LAT,
  speed: speeds[i],
}));

// --- Color helpers -----------------------------------------------------------
const hexToRgb = (hex) => {
  const h = hex.replace("#", "");
  return [parseInt(h.substring(0, 2), 16), parseInt(h.substring(2, 4), 16), parseInt(h.substring(4, 6), 16)];
};
const [r0, g0, b0] = hexToRgb(t.seq[0]);
const [r1, g1, b1] = hexToRgb(t.seq[1]);
const paceColor = (speedKmh) => {
  const f = (speedKmh - minSpeed) / (maxSpeed - minSpeed);
  const r = Math.round(r0 + (r1 - r0) * f);
  const g = Math.round(g0 + (g1 - g0) * f);
  const b = Math.round(b0 + (b1 - b0) * f);
  return `rgb(${r}, ${g}, ${b})`;
};

const project = (chart, lon, lat) => ({
  x: chart.scales.x.getPixelForValue(lon),
  y: chart.scales.y.getPixelForValue(lat),
});

// --- Basemap: stylized terrain contours --------------------------------------
// Chart.js has no native geo/terrain layer; nested rings around the trail's
// high point stand in for elevation-band contour lines (a topographic-map
// convention), giving spatial context without claiming survey accuracy.
const peakIdx = elevations.indexOf(Math.max(...elevations));
const peak = waypoints[peakIdx];
const CONTOUR_RINGS = [
  { rx: 3.6, ry: 2.9 },
  { rx: 2.6, ry: 2.1 },
  { rx: 1.6, ry: 1.3 },
  { rx: 0.7, ry: 0.6 },
];
const RING_STEPS = 40;

const terrainPlugin = {
  id: "terrainContours",
  beforeDatasetsDraw(chart) {
    const { ctx } = chart;
    ctx.save();
    ctx.lineWidth = 1;
    ctx.strokeStyle = t.grid;
    CONTOUR_RINGS.forEach((ring, ringIdx) => {
      ctx.beginPath();
      for (let i = 0; i <= RING_STEPS; i++) {
        const theta = (i / RING_STEPS) * Math.PI * 2;
        const wobble = 1 + 0.06 * Math.sin(theta * 3 + ringIdx);
        const east = (ring.rx * wobble * Math.cos(theta)) / KM_PER_DEG_LON;
        const north = (ring.ry * wobble * Math.sin(theta)) / KM_PER_DEG_LAT;
        const p = project(chart, peak.lon + east, peak.lat + north);
        if (i === 0) ctx.moveTo(p.x, p.y);
        else ctx.lineTo(p.x, p.y);
      }
      ctx.closePath();
      ctx.fillStyle =
        window.ANYPLOT_THEME === "light"
          ? `rgba(26, 26, 23, ${0.03 + ringIdx * 0.02})`
          : `rgba(240, 239, 232, ${0.03 + ringIdx * 0.02})`;
      ctx.fill();
      ctx.stroke();
    });
    ctx.restore();
  },
};

// --- Direction arrows ---------------------------------------------------------
// A few evenly spaced heading markers along the route, per the spec's
// "optional direction arrows indicate travel direction" note.
const ARROW_FRACTIONS = [0.18, 0.42, 0.66, 0.86];
const directionArrowsPlugin = {
  id: "directionArrows",
  afterDatasetsDraw(chart) {
    const { ctx } = chart;
    ctx.save();
    ctx.fillStyle = t.inkSoft;
    ARROW_FRACTIONS.forEach((f) => {
      const i = Math.round(f * (N - 1));
      const prev = waypoints[Math.max(0, i - 2)];
      const next = waypoints[Math.min(N - 1, i + 2)];
      const p0 = project(chart, prev.lon, prev.lat);
      const p1 = project(chart, next.lon, next.lat);
      const mid = project(chart, waypoints[i].lon, waypoints[i].lat);
      const angle = Math.atan2(p1.y - p0.y, p1.x - p0.x);
      const size = 13;
      ctx.save();
      ctx.translate(mid.x, mid.y);
      ctx.rotate(angle);
      ctx.beginPath();
      ctx.moveTo(size, 0);
      ctx.lineTo(-size * 0.6, size * 0.6);
      ctx.lineTo(-size * 0.6, -size * 0.6);
      ctx.closePath();
      ctx.fill();
      ctx.restore();
    });
    ctx.restore();
  },
};

// --- Pace legend ---------------------------------------------------------------
// Translates the sequential path color back into km/h, placed in the empty
// lower-left corner so it never collides with the trail or the terrain rings.
const paceLegendPlugin = {
  id: "paceLegend",
  afterDatasetsDraw(chart) {
    const { ctx, chartArea } = chart;
    ctx.save();
    ctx.textBaseline = "middle";
    ctx.font = "13px sans-serif";
    const x0 = chartArea.left + 20;
    const barW = 130;
    const y = chartArea.bottom - 34;
    ctx.fillStyle = t.inkSoft;
    ctx.fillText("Pace (km/h)", x0, y - 20);
    const steps = 40;
    for (let i = 0; i < steps; i++) {
      const f = i / (steps - 1);
      ctx.fillStyle = `rgb(${Math.round(r0 + (r1 - r0) * f)}, ${Math.round(g0 + (g1 - g0) * f)}, ${Math.round(b0 + (b1 - b0) * f)})`;
      ctx.fillRect(x0 + (barW * i) / steps, y, barW / steps + 1, 8);
    }
    ctx.fillStyle = t.inkSoft;
    ctx.fillText(minSpeed.toFixed(1), x0, y + 18);
    ctx.fillText(maxSpeed.toFixed(1), x0 + barW - 14, y + 18);
    ctx.restore();
  },
};

// --- Mount -------------------------------------------------------------------
const canvas = document.createElement("canvas");
document.getElementById("container").appendChild(canvas);

// --- Title (scale fontsize to the rendered length, see plot-generator.md) ---
const title = "Sierra Ridge Trail Pace · map-route-path · javascript · chartjs · anyplot.ai";
const titleFontSize = Math.max(15, Math.round(22 * Math.min(1, 67 / title.length)));

// --- Scale bounds (trail extent + padding) -----------------------------------
const lons = waypoints.map((w) => w.lon);
const lats = waypoints.map((w) => w.lat);
const lonPad = (Math.max(...lons) - Math.min(...lons)) * 0.22;
const latPad = (Math.max(...lats) - Math.min(...lats)) * 0.22;

// --- Chart ---------------------------------------------------------------
new Chart(canvas, {
  type: "scatter",
  data: {
    datasets: [
      {
        label: "GPS Track",
        data: waypoints.map((w) => ({ x: w.lon, y: w.lat })),
        showLine: true,
        fill: false,
        borderWidth: 4,
        pointRadius: 0,
        tension: 0.2,
        segment: {
          borderColor: (ctx) => paceColor((waypoints[ctx.p0DataIndex].speed + waypoints[ctx.p1DataIndex].speed) / 2),
        },
      },
      {
        label: "Start",
        data: [{ x: waypoints[0].lon, y: waypoints[0].lat }],
        showLine: false,
        pointStyle: "circle",
        pointRadius: 11,
        pointBackgroundColor: t.palette[0],
        pointBorderColor: t.pageBg,
        pointBorderWidth: 2,
      },
      {
        label: "Finish",
        data: [{ x: waypoints[N - 1].lon, y: waypoints[N - 1].lat }],
        showLine: false,
        pointStyle: "rect",
        pointRadius: 10,
        pointBackgroundColor: t.palette[4],
        pointBorderColor: t.pageBg,
        pointBorderWidth: 2,
      },
    ],
  },
  plugins: [terrainPlugin, directionArrowsPlugin, paceLegendPlugin],
  options: {
    responsive: true,
    maintainAspectRatio: false,
    animation: false,
    layout: { padding: 16 },
    plugins: {
      title: { display: true, text: title, color: t.ink, font: { size: titleFontSize, weight: "500" } },
      legend: {
        labels: {
          color: t.ink,
          font: { size: 16 },
          filter: (item) => item.text !== "GPS Track",
        },
      },
      tooltip: { callbacks: { label: (ctx) => `${ctx.dataset.label} (${waypoints[ctx.dataIndex]?.speed.toFixed(1) ?? "-"} km/h)` } },
    },
    scales: {
      x: {
        type: "linear",
        min: Math.min(...lons) - lonPad,
        max: Math.max(...lons) + lonPad,
        title: { display: true, text: "Longitude", color: t.ink, font: { size: 16 } },
        ticks: { color: t.inkSoft, font: { size: 14 }, callback: (v) => `${v.toFixed(2)}°` },
        grid: { color: t.grid },
      },
      y: {
        type: "linear",
        min: Math.min(...lats) - latPad,
        max: Math.max(...lats) + latPad,
        title: { display: true, text: "Latitude", color: t.ink, font: { size: 16 } },
        ticks: { color: t.inkSoft, font: { size: 14 }, callback: (v) => `${v.toFixed(2)}°` },
        grid: { color: t.grid },
      },
    },
  },
});
Runnable source as JSON, for any HTTP client: https://api.anyplot.ai/specs/map-route-path/chartjs/code. Any spec id and library id listed in llms-full.txt fit the same URL shape; every URL below is complete and callable.
{
  "spec_id": "map-route-path",
  "language": "javascript",
  "library": "chartjs",
  "page": "https://anyplot.ai/map-route-path/javascript/chartjs",
  "hub": "https://anyplot.ai/map-route-path",
  "code_json": "https://api.anyplot.ai/specs/map-route-path/chartjs/code",
  "spec_json": "https://api.anyplot.ai/specs/map-route-path",
  "render_light_png": "https://storage.googleapis.com/anyplot-images/plots/map-route-path/javascript/chartjs/plot-light.png",
  "render_dark_png": "https://storage.googleapis.com/anyplot-images/plots/map-route-path/javascript/chartjs/plot-dark.png",
  "interactive_light_html": "https://storage.googleapis.com/anyplot-images/plots/map-route-path/javascript/chartjs/plot-light.html",
  "interactive_dark_html": "https://storage.googleapis.com/anyplot-images/plots/map-route-path/javascript/chartjs/plot-dark.html",
  "quality_score": 92.0,
  "license": "MIT",
  "guide": "https://anyplot.ai/llms.txt"
}
Part of Route Path Map on anyplot.ai.