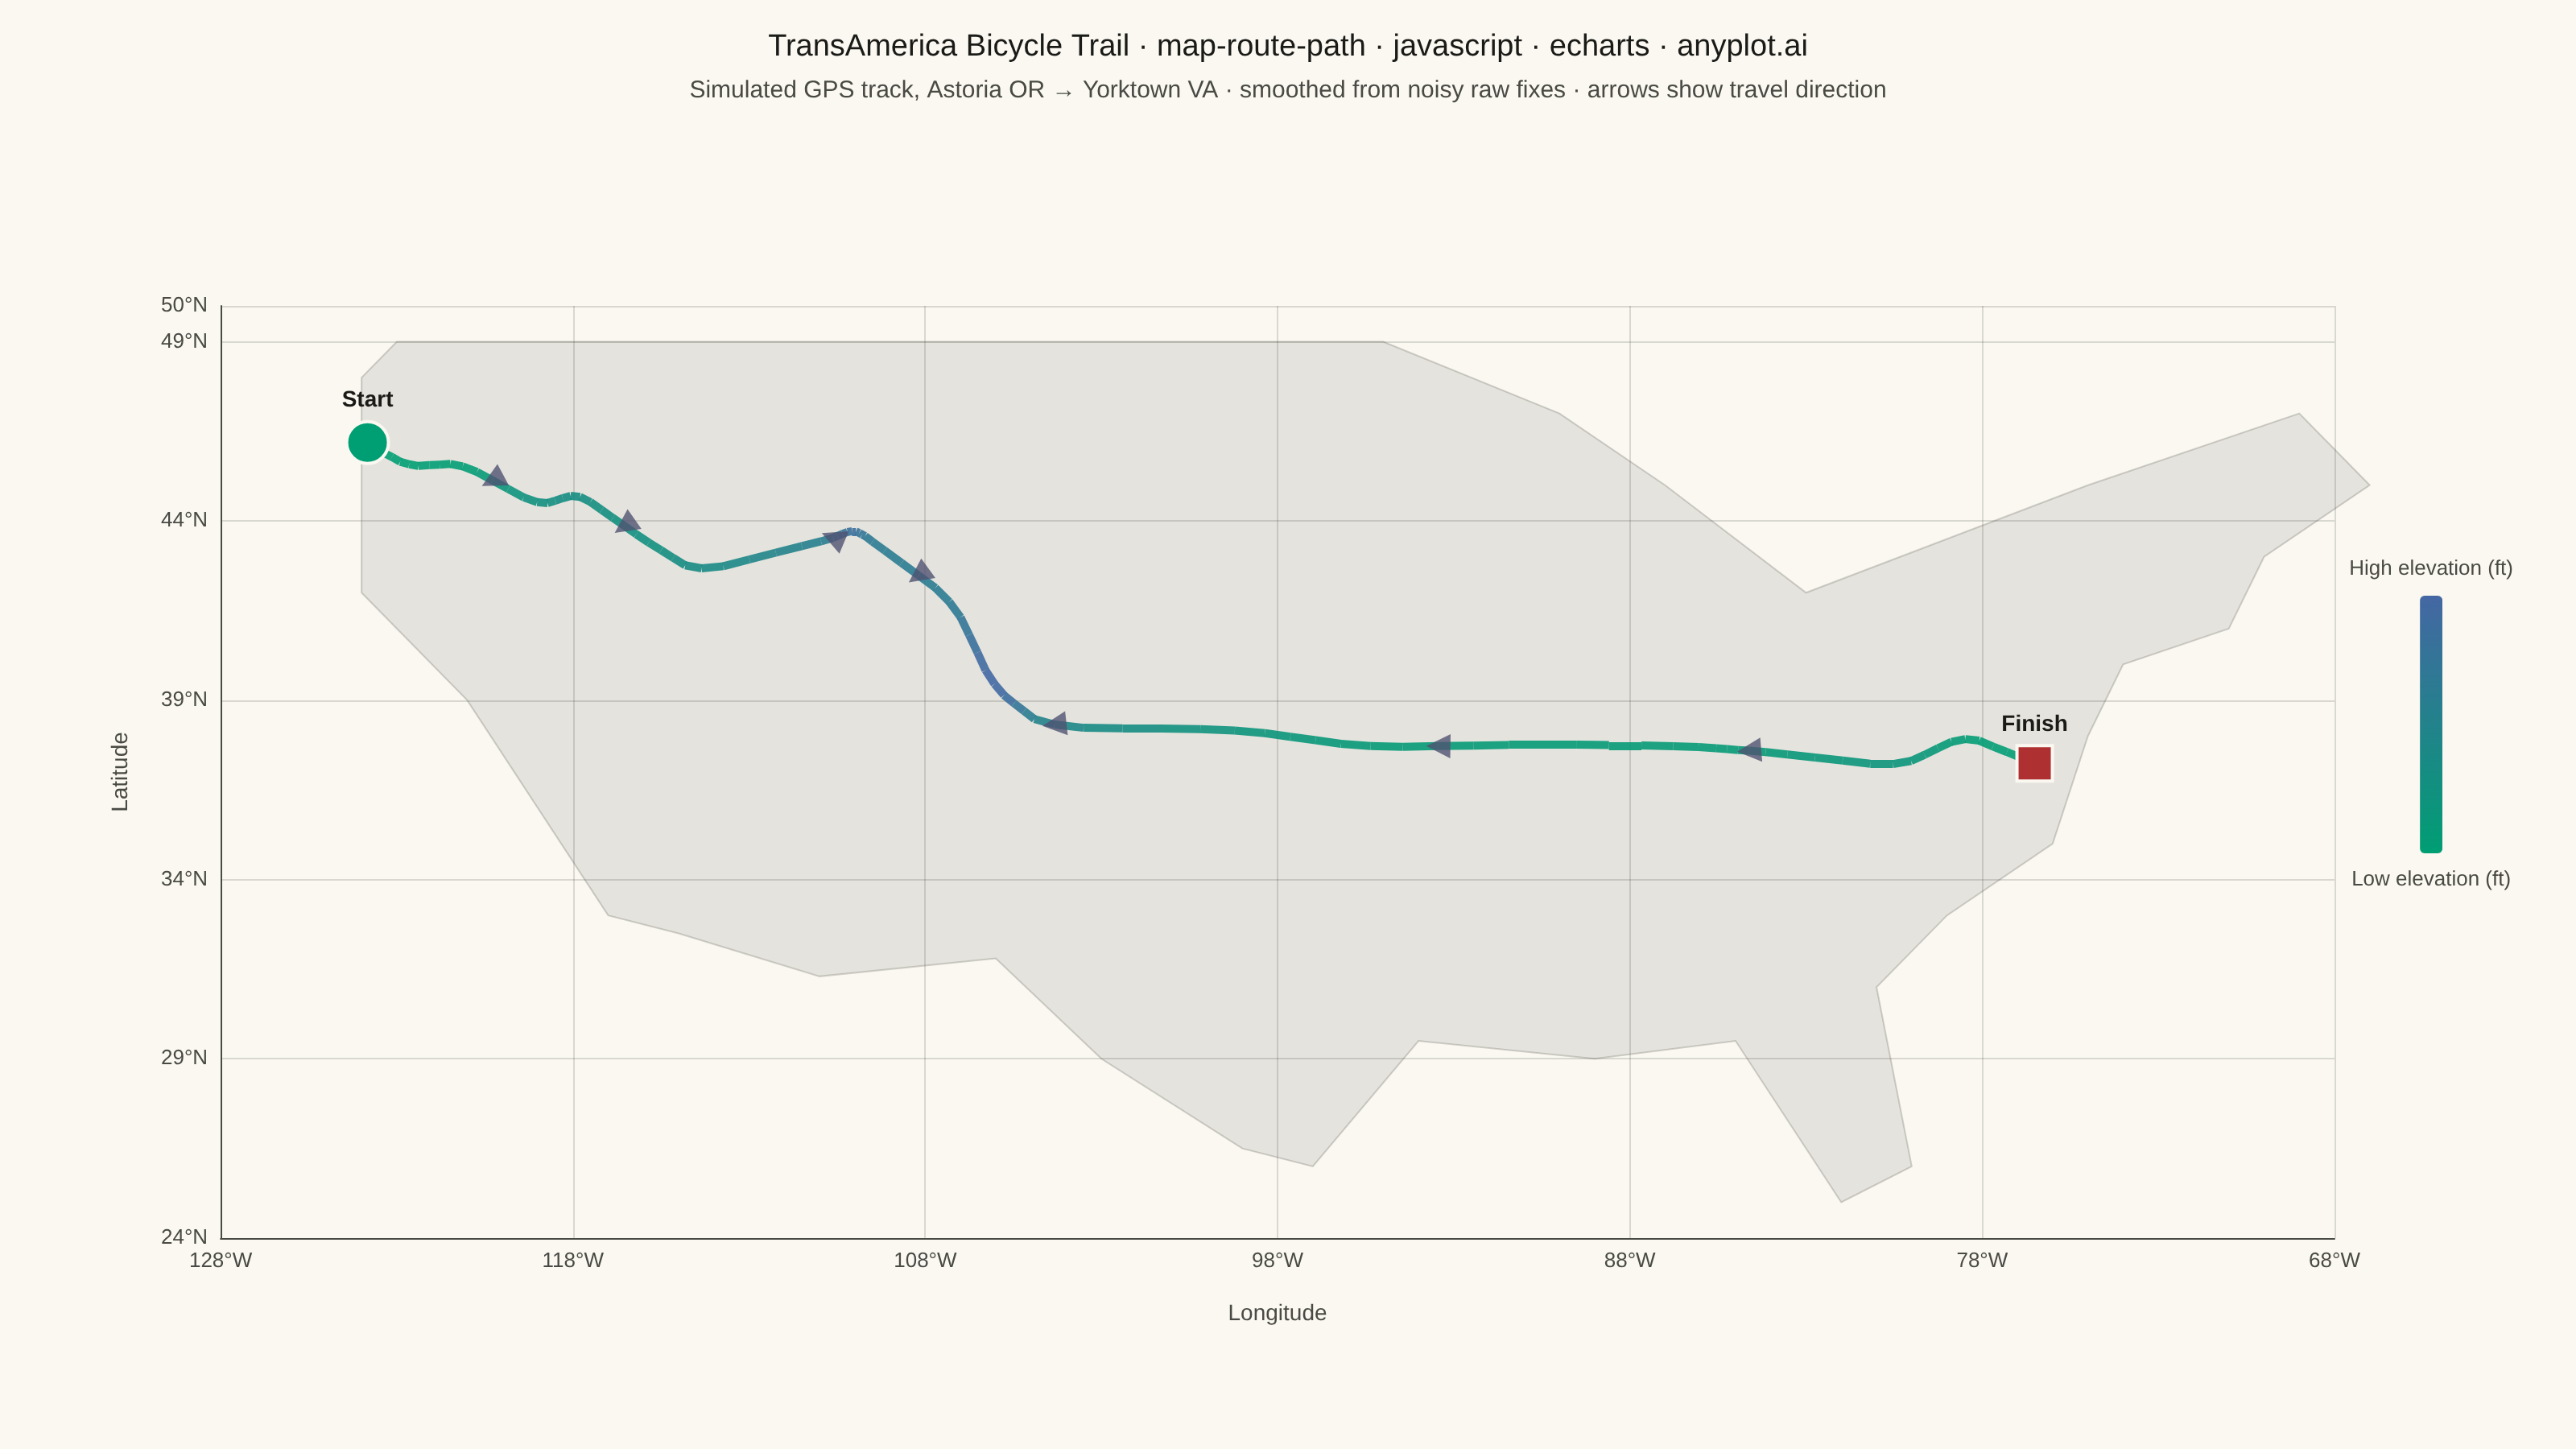
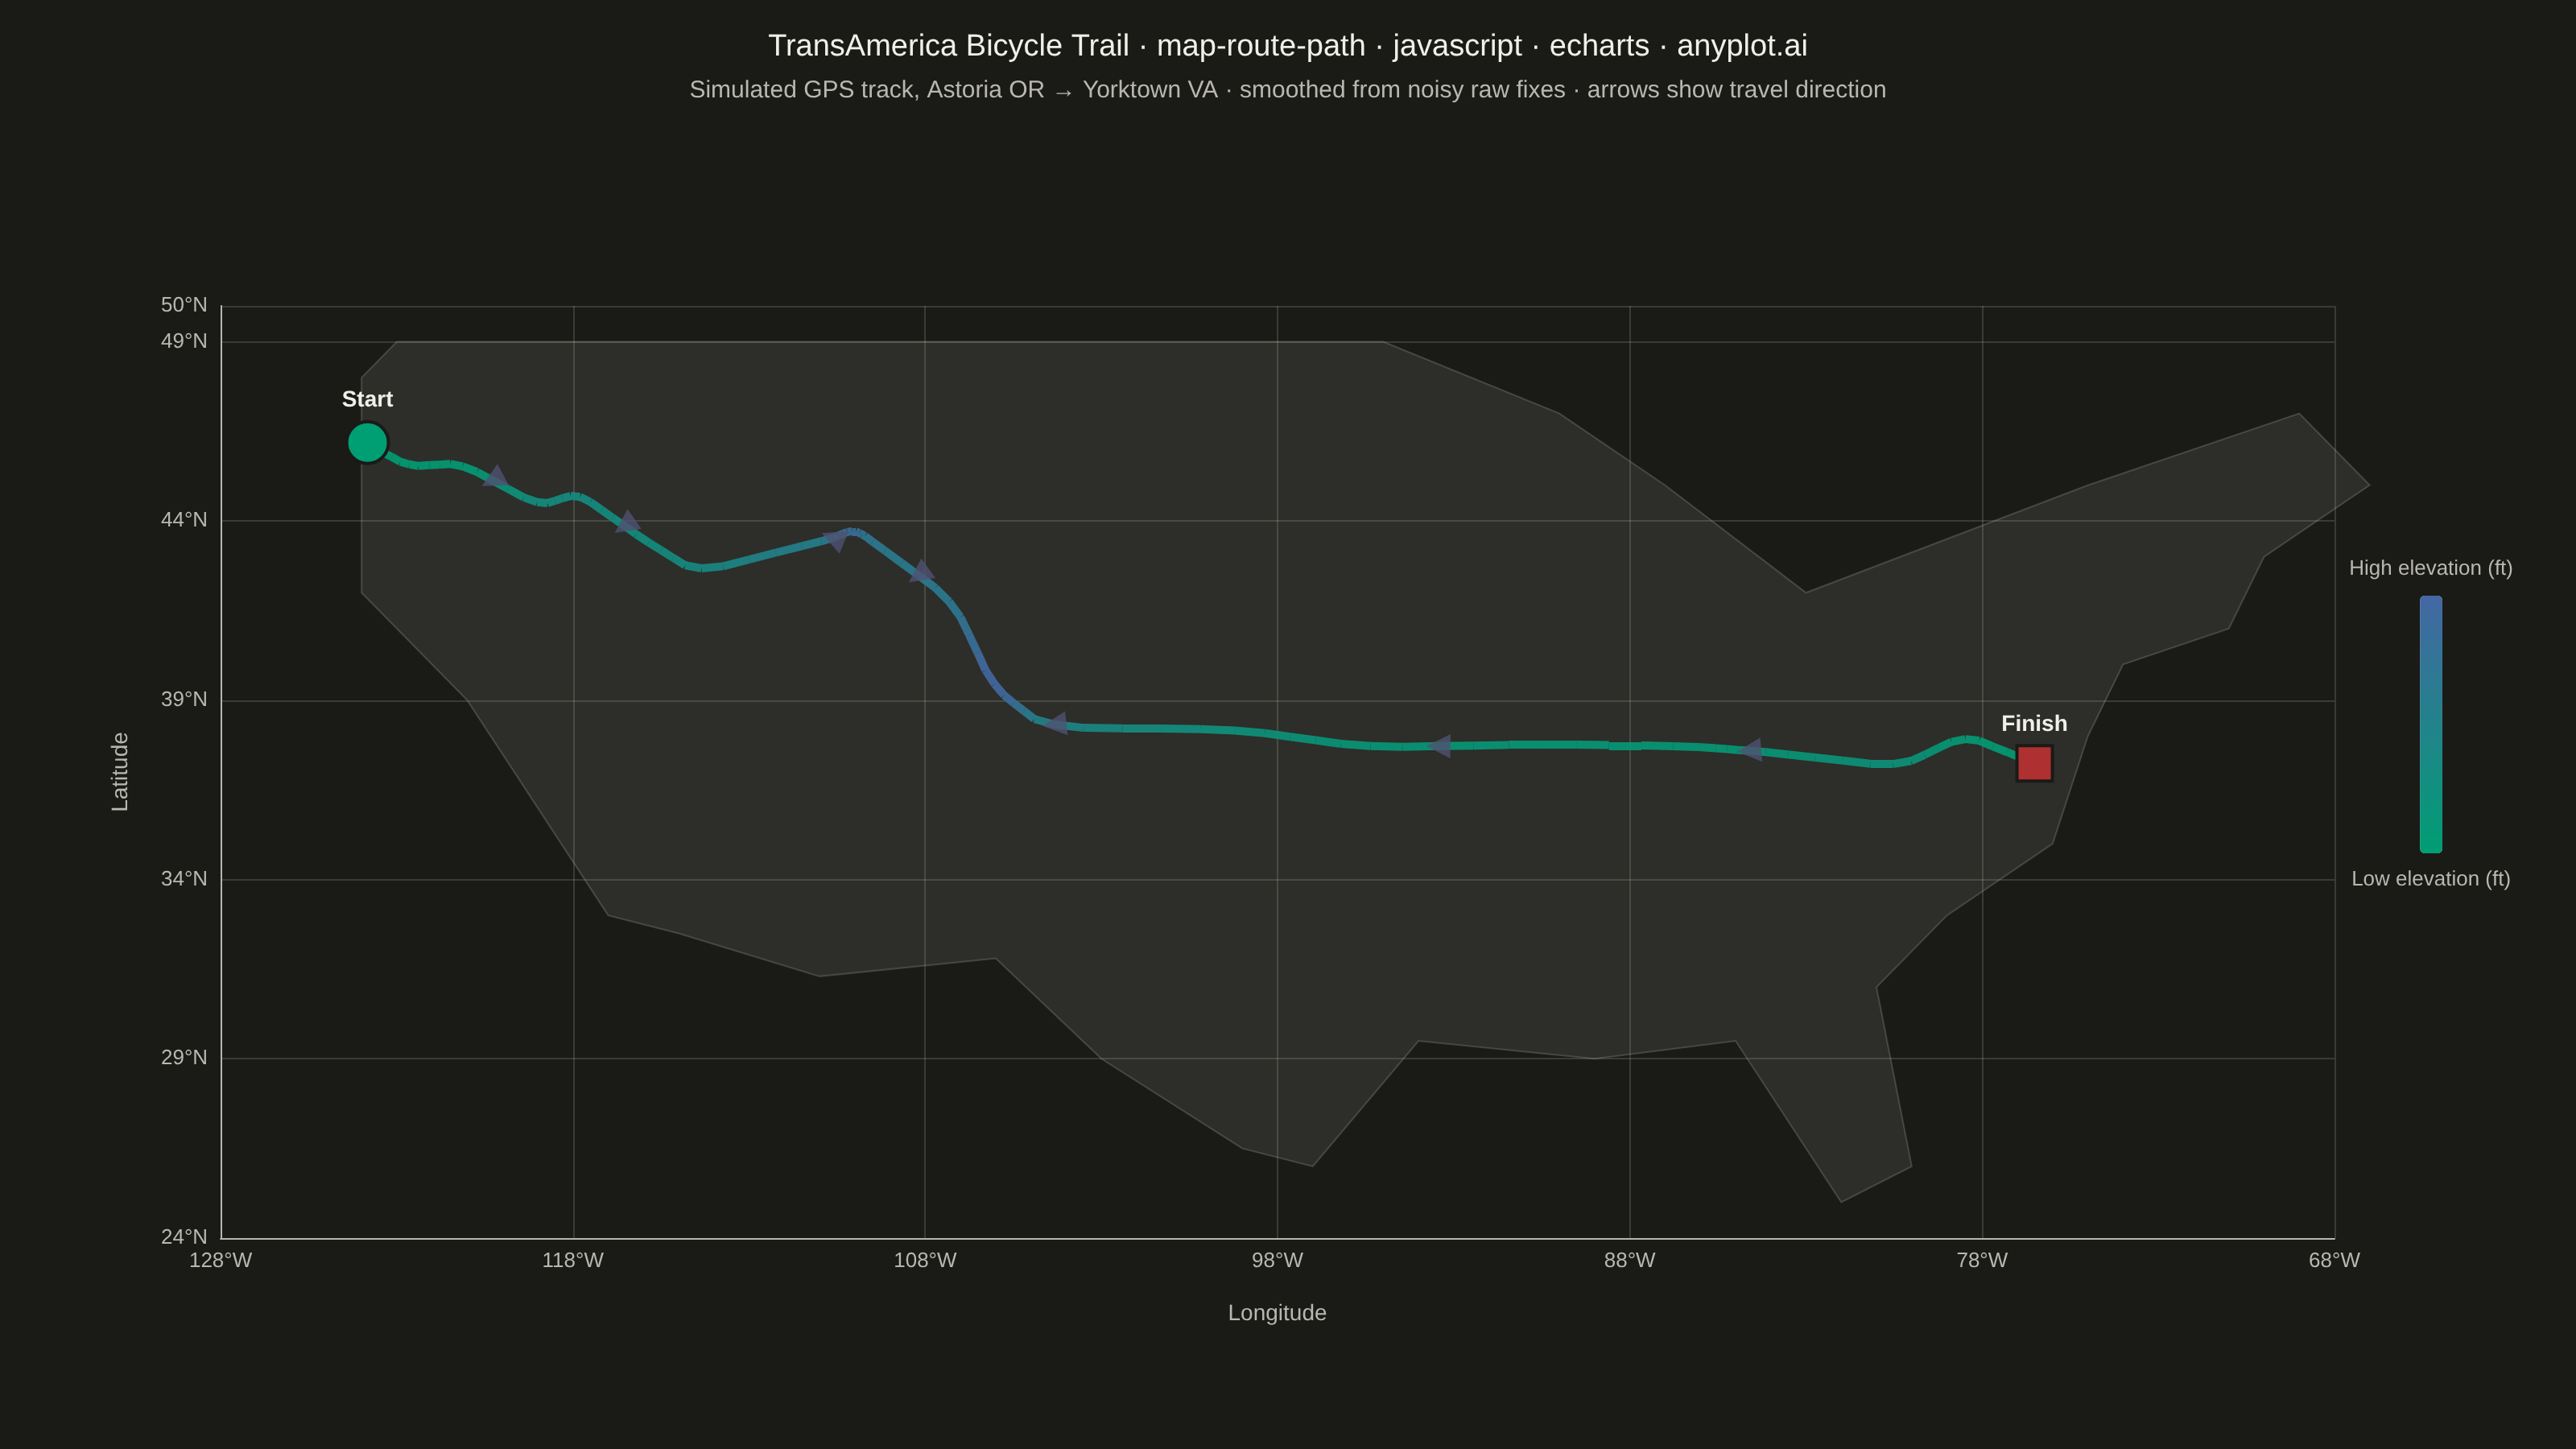
The same plot in 14 other libraries — JavaScript: Chart.js, D3.js, Highcharts, MUI X Charts; Python: Altair, Bokeh, lets-plot, Matplotlib, Plotly, plotnine, Pygal, Seaborn; R: ggplot2; Julia: Makie.jl. Compare all 15 side by side: Route Path Map in Python, R, Julia and JavaScript.
A geographic map visualization showing a connected path or route between sequential waypoints. Unlike scatter maps that display discrete points, this plot connects coordinates in order to reveal journeys, tracks, and navigation paths. Ideal for GPS data, delivery routes, and travel visualization where the sequence and continuity of movement matters.
// anyplot.ai
// map-route-path: Route Path Map
// Library: echarts 6.1.0 | JavaScript 22.23.2
// Quality: 92/100 | Created: 2026-09-02

const t = window.ANYPLOT_TOKENS;

// --- Data (in-memory, deterministic): TransAmerica-style cycling route -----
// Named waypoints along a coast-to-coast bicycle route, west to east.
const ANCHORS = [
  { name: "Astoria, OR", lon: -123.83, lat: 46.19, elev: 10 },
  { name: "Portland, OR", lon: -122.68, lat: 45.52, elev: 50 },
  { name: "The Dalles, OR", lon: -121.18, lat: 45.6, elev: 100 },
  { name: "John Day, OR", lon: -118.95, lat: 44.42, elev: 3080 },
  { name: "Baker City, OR", lon: -117.83, lat: 44.77, elev: 3451 },
  { name: "Boise, ID", lon: -116.2, lat: 43.62, elev: 2704 },
  { name: "Twin Falls, ID", lon: -114.47, lat: 42.56, elev: 3745 },
  { name: "Jackson, WY", lon: -110.76, lat: 43.48, elev: 6237 },
  { name: "Togwotee Pass, WY", lon: -110.06, lat: 43.75, elev: 9658 },
  { name: "Dubois, WY", lon: -109.62, lat: 43.53, elev: 6917 },
  { name: "Rawlins, WY", lon: -107.24, lat: 41.79, elev: 6742 },
  { name: "Hoosier Pass, CO", lon: -106.06, lat: 39.36, elev: 11542 },
  { name: "Pueblo, CO", lon: -104.61, lat: 38.25, elev: 4692 },
  { name: "Larned, KS", lon: -99.1, lat: 38.18, elev: 2016 },
  { name: "Chanute, KS", lon: -95.46, lat: 37.68, elev: 972 },
  { name: "Farmington, MO", lon: -90.42, lat: 37.78, elev: 928 },
  { name: "Elizabethtown, KY", lon: -85.86, lat: 37.69, elev: 771 },
  { name: "Berea, KY", lon: -84.3, lat: 37.57, elev: 1043 },
  { name: "Christiansburg, VA", lon: -80.41, lat: 37.13, elev: 2076 },
  { name: "Charlottesville, VA", lon: -78.48, lat: 38.03, elev: 480 },
  { name: "Yorktown, VA", lon: -76.51, lat: 37.24, elev: 10 },
];

// Fixed-seed LCG so the "raw GPS noise" is reproducible across renders.
let seed = 42;
const rand = () => {
  seed = (seed * 1664525 + 1013904223) % 4294967296;
  return seed / 4294967296;
};

// Densify each anchor-to-anchor leg into noisy intermediate fixes, mimicking
// a real GPS track, then smooth with a moving average to clean the noise —
// the anchors themselves stay exact so the named waypoints keep their place.
const STEPS = 5;
const rawTrack = [{ ...ANCHORS[0] }];
for (let i = 0; i < ANCHORS.length - 1; i++) {
  const a = ANCHORS[i];
  const b = ANCHORS[i + 1];
  for (let s = 1; s < STEPS; s++) {
    const f = s / STEPS;
    rawTrack.push({
      lon: a.lon + (b.lon - a.lon) * f + (rand() - 0.5) * 0.05,
      lat: a.lat + (b.lat - a.lat) * f + (rand() - 0.5) * 0.05,
      elev: a.elev + (b.elev - a.elev) * f + (rand() - 0.5) * 220,
    });
  }
  rawTrack.push({ ...b });
}

const track = rawTrack.map((p, i) => {
  if (i === 0 || i === rawTrack.length - 1) return p;
  const prev = rawTrack[i - 1];
  const next = rawTrack[i + 1];
  return {
    lon: (prev.lon + p.lon + next.lon) / 3,
    lat: (prev.lat + p.lat + next.lat) / 3,
    elev: (prev.elev + p.elev + next.elev) / 3,
  };
});

const elevations = track.map((p) => p.elev);
const minElev = Math.min(...elevations);
const maxElev = Math.max(...elevations);

const routeSegments = track.slice(0, -1).map((p, i) => {
  const n = track[i + 1];
  return {
    coords: [
      [p.lon, p.lat],
      [n.lon, n.lat],
    ],
    value: (p.elev + n.elev) / 2,
  };
});

// Direction arrows every N points, rotated to the bearing of the next fix.
const ARROW_STEP = 12;
const arrowData = [];
for (let i = ARROW_STEP; i < track.length - ARROW_STEP / 2; i += ARROW_STEP) {
  const p = track[i];
  const n = track[i + 1];
  const bearing = Math.atan2(n.lon - p.lon, n.lat - p.lat) * (180 / Math.PI);
  arrowData.push({ value: [p.lon, p.lat], symbolRotate: bearing });
}

const start = track[0];
const finish = track[track.length - 1];

// Hand-simplified continental-US coastline (lon/lat vertex list) so the route
// reads against a base map — no bundled GeoJSON or network fetch is
// available to this offline browser runtime, so this is a low-vertex
// approximation, not authoritative coastline data.
const usOutline = [
  [-124, 48], [-124, 42], [-121, 39], [-117, 33], [-115, 32.5],
  [-111, 31.3], [-106, 31.8], [-103, 29], [-99, 26.5], [-97, 26],
  [-94, 29.5], [-89, 29], [-85, 29.5], [-82, 25], [-80, 26],
  [-81, 31], [-79, 33], [-76, 35], [-75, 38], [-74, 40],
  [-71, 41], [-70, 43], [-67, 45], [-69, 47], [-75, 45],
  [-83, 42], [-87, 45], [-90, 47], [-95, 49], [-104, 49],
  [-114, 49], [-123, 49], [-124, 48],
];

// --- Init --------------------------------------------------------------
const chart = echarts.init(document.getElementById("container"));

// --- Option --------------------------------------------------------------
const title = "TransAmerica Bicycle Trail · map-route-path · javascript · echarts · anyplot.ai";
const titleFontSize = Math.round(22 * Math.min(1, 67 / title.length));

chart.setOption({
  animation: false,
  backgroundColor: "transparent",
  title: {
    text: title,
    subtext: "Simulated GPS track, Astoria OR → Yorktown VA · smoothed from noisy raw fixes · arrows show travel direction",
    left: "center",
    textStyle: { color: t.ink, fontSize: titleFontSize, fontWeight: 500 },
    subtextStyle: { color: t.inkSoft, fontSize: 15 },
  },
  tooltip: {
    trigger: "item",
    formatter: (p) =>
      p.seriesType === "lines" ? `${Math.round(p.data.value).toLocaleString()} ft` : p.name,
  },
  visualMap: {
    type: "continuous",
    min: minElev,
    max: maxElev,
    seriesIndex: 1,
    orient: "vertical",
    right: 24,
    top: "middle",
    itemWidth: 14,
    itemHeight: 160,
    text: ["High elevation (ft)", "Low elevation (ft)"],
    textStyle: { color: t.inkSoft, fontSize: 13 },
    inRange: { color: t.seq },
    calculable: false,
    hoverLink: false,
  },
  grid: { left: 100, right: 150, top: 190, bottom: 110, containLabel: true },
  dataZoom: [
    { type: "inside", xAxisIndex: 0, filterMode: "none" },
    { type: "inside", yAxisIndex: 0, filterMode: "none" },
  ],
  xAxis: {
    type: "value",
    min: -128,
    max: -68,
    interval: 10,
    name: "Longitude",
    nameLocation: "middle",
    nameGap: 40,
    nameTextStyle: { color: t.inkSoft, fontSize: 14 },
    axisLabel: { color: t.inkSoft, fontSize: 13, formatter: (v) => `${Math.abs(v)}°W` },
    axisLine: { onZero: false, lineStyle: { color: t.inkSoft } },
    axisTick: { show: false },
    splitLine: { show: true, lineStyle: { color: t.grid } },
  },
  yAxis: {
    type: "value",
    min: 24,
    max: 50,
    interval: 5,
    name: "Latitude",
    nameLocation: "middle",
    nameGap: 55,
    nameTextStyle: { color: t.inkSoft, fontSize: 14 },
    axisLabel: { color: t.inkSoft, fontSize: 13, formatter: (v) => `${v}°N` },
    axisLine: { onZero: false, lineStyle: { color: t.inkSoft } },
    axisTick: { show: false },
    splitLine: { show: true, lineStyle: { color: t.grid } },
  },
  series: [
    {
      name: "Landmass",
      type: "custom",
      coordinateSystem: "cartesian2d",
      xAxisIndex: 0,
      yAxisIndex: 0,
      silent: true,
      z: 1,
      data: [0],
      renderItem: (params, api) => ({
        type: "polygon",
        shape: { points: usOutline.map((p) => api.coord(p)) },
        style: { fill: t.grid, opacity: 0.6, stroke: t.inkSoft, lineWidth: 1, strokeOpacity: 0.4 },
      }),
    },
    {
      name: "Route",
      type: "lines",
      coordinateSystem: "cartesian2d",
      xAxisIndex: 0,
      yAxisIndex: 0,
      symbol: ["none", "none"],
      lineStyle: { width: 5, opacity: 0.9 },
      data: routeSegments,
      z: 2,
    },
    {
      name: "Direction",
      type: "scatter",
      xAxisIndex: 0,
      yAxisIndex: 0,
      silent: true,
      symbol: "triangle",
      symbolSize: 15,
      itemStyle: { color: t.muted, opacity: 0.8 },
      data: arrowData,
      z: 3,
    },
    {
      name: "Start",
      type: "scatter",
      xAxisIndex: 0,
      yAxisIndex: 0,
      symbol: "circle",
      symbolSize: 26,
      data: [{ value: [start.lon, start.lat], name: "Start" }],
      itemStyle: { color: t.palette[0], borderColor: t.pageBg, borderWidth: 2, opacity: 1 },
      label: { show: true, formatter: "Start", position: "top", color: t.ink, fontSize: 14, fontWeight: 600 },
      z: 4,
    },
    {
      name: "Finish",
      type: "scatter",
      xAxisIndex: 0,
      yAxisIndex: 0,
      symbol: "rect",
      symbolSize: 22,
      data: [{ value: [finish.lon, finish.lat], name: "Finish" }],
      itemStyle: { color: t.palette[4], borderColor: t.pageBg, borderWidth: 2, opacity: 1 },
      label: { show: true, formatter: "Finish", position: "top", color: t.ink, fontSize: 14, fontWeight: 600 },
      z: 4,
    },
  ],
});
Runnable source as JSON, for any HTTP client: https://api.anyplot.ai/specs/map-route-path/echarts/code. Any spec id and library id listed in llms-full.txt fit the same URL shape; every URL below is complete and callable.
{
  "spec_id": "map-route-path",
  "language": "javascript",
  "library": "echarts",
  "page": "https://anyplot.ai/map-route-path/javascript/echarts",
  "hub": "https://anyplot.ai/map-route-path",
  "code_json": "https://api.anyplot.ai/specs/map-route-path/echarts/code",
  "spec_json": "https://api.anyplot.ai/specs/map-route-path",
  "render_light_png": "https://storage.googleapis.com/anyplot-images/plots/map-route-path/javascript/echarts/plot-light.png",
  "render_dark_png": "https://storage.googleapis.com/anyplot-images/plots/map-route-path/javascript/echarts/plot-dark.png",
  "interactive_light_html": "https://storage.googleapis.com/anyplot-images/plots/map-route-path/javascript/echarts/plot-light.html",
  "interactive_dark_html": "https://storage.googleapis.com/anyplot-images/plots/map-route-path/javascript/echarts/plot-dark.html",
  "quality_score": 92.0,
  "license": "MIT",
  "guide": "https://anyplot.ai/llms.txt"
}
Part of Route Path Map on anyplot.ai.