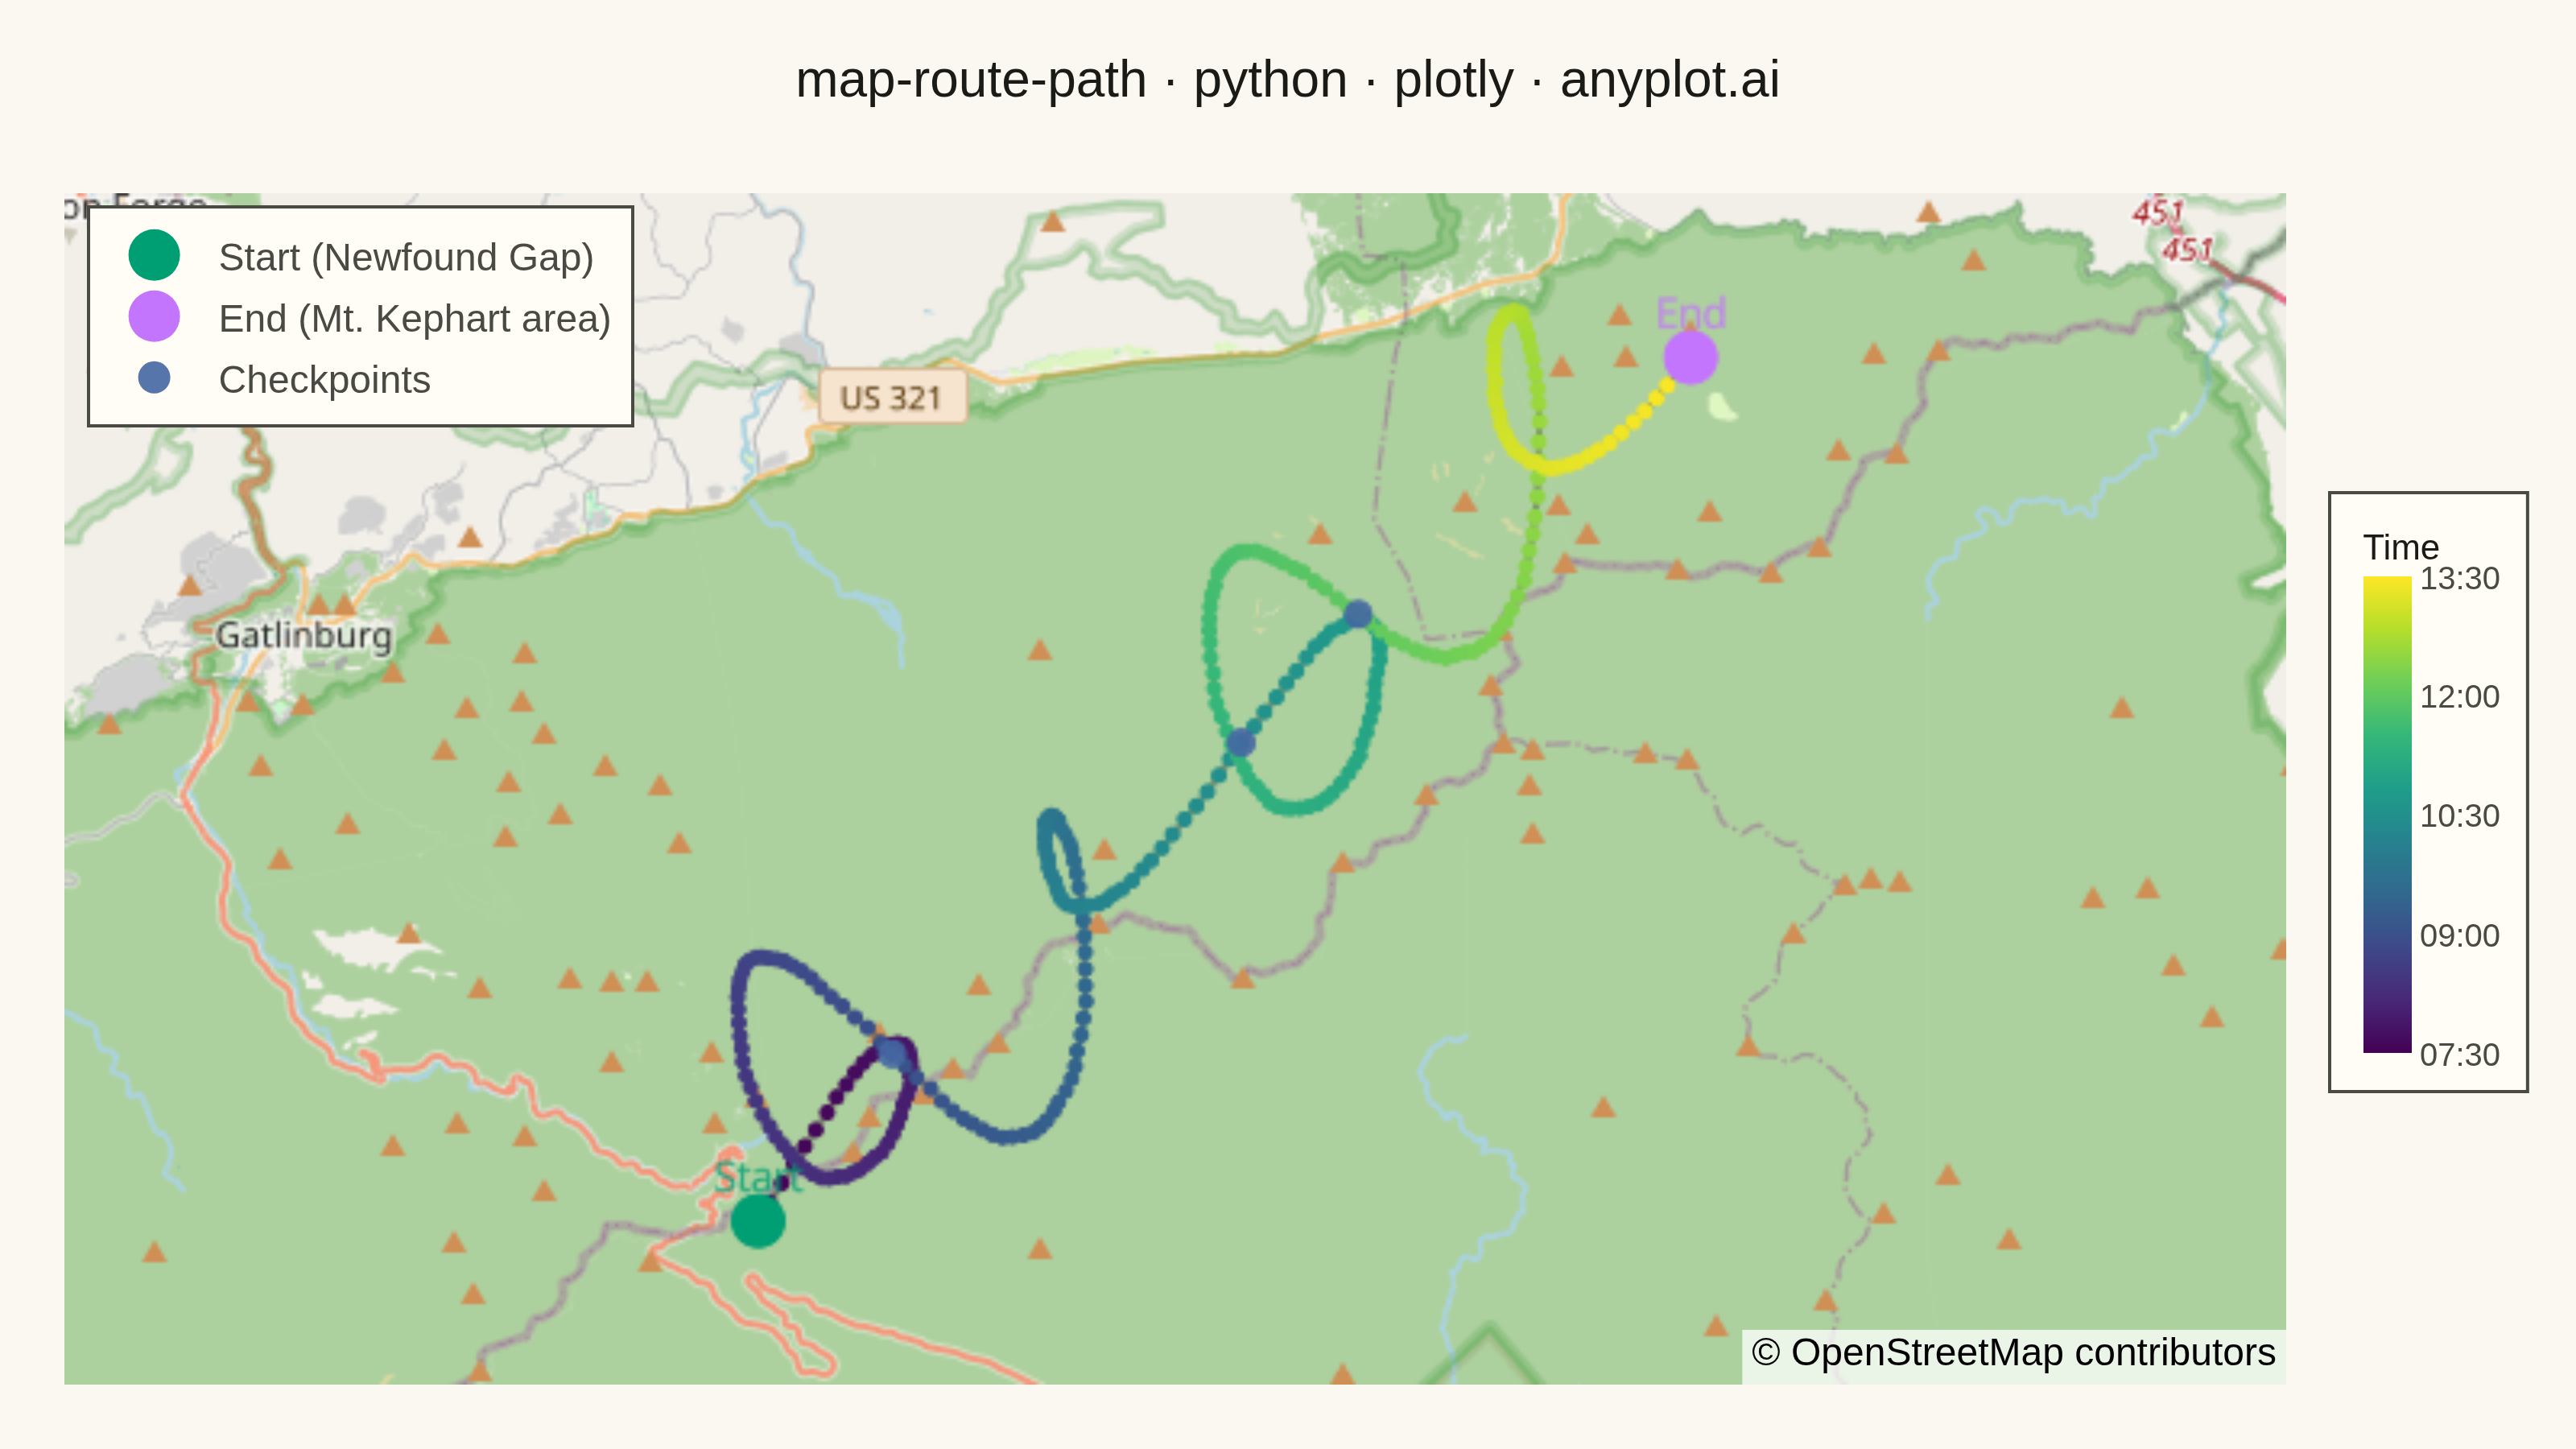
A geographic map visualization showing a connected path or route between sequential waypoints. Unlike scatter maps that display discrete points, this plot connects coordinates in order to reveal journeys, tracks, and navigation paths. Ideal for GPS data, delivery routes, and travel visualization where the sequence and continuity of movement matters.
""" anyplot.ai
map-route-path: Route Path Map
Library: plotly 6.7.0 | Python 3.13.13
Quality: 84/100 | Updated: 2026-05-21
"""

import os
import sys


# Remove this script's directory from sys.path so 'plotly' resolves to the
# installed package, not this file (which shares the name).
_here = os.path.dirname(os.path.abspath(__file__))
sys.path = [p for p in sys.path if os.path.abspath(p) != _here]

import numpy as np
import pandas as pd
import plotly.graph_objects as go


THEME = os.getenv("ANYPLOT_THEME", "light")

PAGE_BG = "#FAF8F1" if THEME == "light" else "#1A1A17"
ELEVATED_BG = "#FFFDF6" if THEME == "light" else "#242420"
INK = "#1A1A17" if THEME == "light" else "#F0EFE8"
INK_SOFT = "#4A4A44" if THEME == "light" else "#B8B7B0"

# Okabe-Ito: position 1 = start, position 2 = end, position 3 = waypoints
START_COLOR = "#009E73"
END_COLOR = "#C475FD"
WAYPOINT_COLOR = "#4467A3"

# Data: Appalachian Trail section through Great Smoky Mountains, Tennessee
np.random.seed(42)

start_lat, start_lon = 35.6127, -83.4254  # Newfound Gap, TN
n_points = 300

t = np.linspace(0, 1, n_points)

# Trail winds northeast with characteristic Smoky Mountain undulations
lat_drift = 0.15 * t + 0.018 * np.sin(12 * np.pi * t) + 0.009 * np.sin(5 * np.pi * t)
lon_drift = 0.20 * t + 0.022 * np.sin(8 * np.pi * t) + 0.012 * np.cos(4 * np.pi * t)

# Reduced noise amplitude for a more realistic trail path (was 0.0007)
lat = start_lat + lat_drift + np.cumsum(np.random.randn(n_points) * 0.0002)
lon = start_lon + lon_drift + np.cumsum(np.random.randn(n_points) * 0.0002)

timestamps = pd.date_range("2024-09-14 07:30", periods=n_points, freq="72s")
t_values = np.arange(n_points, dtype=float)

df = pd.DataFrame({"lat": lat, "lon": lon, "sequence": range(n_points), "timestamp": timestamps})

fig = go.Figure()

# Thin route line for path connectivity
fig.add_trace(
    go.Scattermap(
        lat=df["lat"],
        lon=df["lon"],
        mode="lines",
        line={"width": 2, "color": INK_SOFT},
        opacity=0.5,
        hoverinfo="skip",
        showlegend=False,
    )
)

# Single marker trace with viridis colorscale for time progression; colorbar provides the time scale
hover_times = [ts.strftime("%H:%M") for ts in timestamps]
fig.add_trace(
    go.Scattermap(
        lat=df["lat"],
        lon=df["lon"],
        mode="markers",
        marker={
            "size": 6,
            "color": t_values,
            "colorscale": "Viridis",
            "showscale": True,
            "colorbar": {
                "title": {"text": "Time", "font": {"size": 11, "color": INK}},
                "tickvals": [0, 75, 150, 225, 299],
                "ticktext": ["07:30", "09:00", "10:30", "12:00", "13:30"],
                "tickfont": {"size": 10, "color": INK_SOFT},
                "bgcolor": ELEVATED_BG,
                "bordercolor": INK_SOFT,
                "borderwidth": 1,
                "len": 0.5,
                "thickness": 15,
            },
        },
        hovertemplate="<b>%{text}</b><br>Lat: %{lat:.4f}<br>Lon: %{lon:.4f}<extra></extra>",
        text=hover_times,
        showlegend=False,
    )
)

# Start marker — Okabe-Ito position 1 (bluish green)
fig.add_trace(
    go.Scattermap(
        lat=[df["lat"].iloc[0]],
        lon=[df["lon"].iloc[0]],
        mode="markers+text",
        marker={"size": 18, "color": START_COLOR},
        text=["Start"],
        textposition="top center",
        textfont={"size": 13, "color": START_COLOR},
        name="Start (Newfound Gap)",
        hovertemplate="<b>Start — Newfound Gap</b><br>Lat: %{lat:.4f}<br>Lon: %{lon:.4f}<br>Time: 07:30<extra></extra>",
    )
)

# End marker — Okabe-Ito position 2 (vermillion)
fig.add_trace(
    go.Scattermap(
        lat=[df["lat"].iloc[-1]],
        lon=[df["lon"].iloc[-1]],
        mode="markers+text",
        marker={"size": 18, "color": END_COLOR},
        text=["End"],
        textposition="top center",
        textfont={"size": 13, "color": END_COLOR},
        name="End (Mt. Kephart area)",
        hovertemplate="<b>End — Mt. Kephart area</b><br>Lat: %{lat:.4f}<br>Lon: %{lon:.4f}<br>Time: 13:30<extra></extra>",
    )
)

# Waypoints at regular intervals — Okabe-Ito position 3 (blue)
interval = 75
waypoints = df.iloc[interval::interval]
wp_labels = [
    f"{int(row.timestamp.strftime('%H')) % 12 or 12}:{row.timestamp.strftime('%M')}" for _, row in waypoints.iterrows()
]
fig.add_trace(
    go.Scattermap(
        lat=waypoints["lat"],
        lon=waypoints["lon"],
        mode="markers",
        marker={"size": 10, "color": WAYPOINT_COLOR, "opacity": 0.9},
        name="Checkpoints",
        hovertemplate="<b>Checkpoint at %{text}</b><br>Lat: %{lat:.4f}<br>Lon: %{lon:.4f}<extra></extra>",
        text=wp_labels,
    )
)

center_lat = df["lat"].mean()
center_lon = df["lon"].mean()

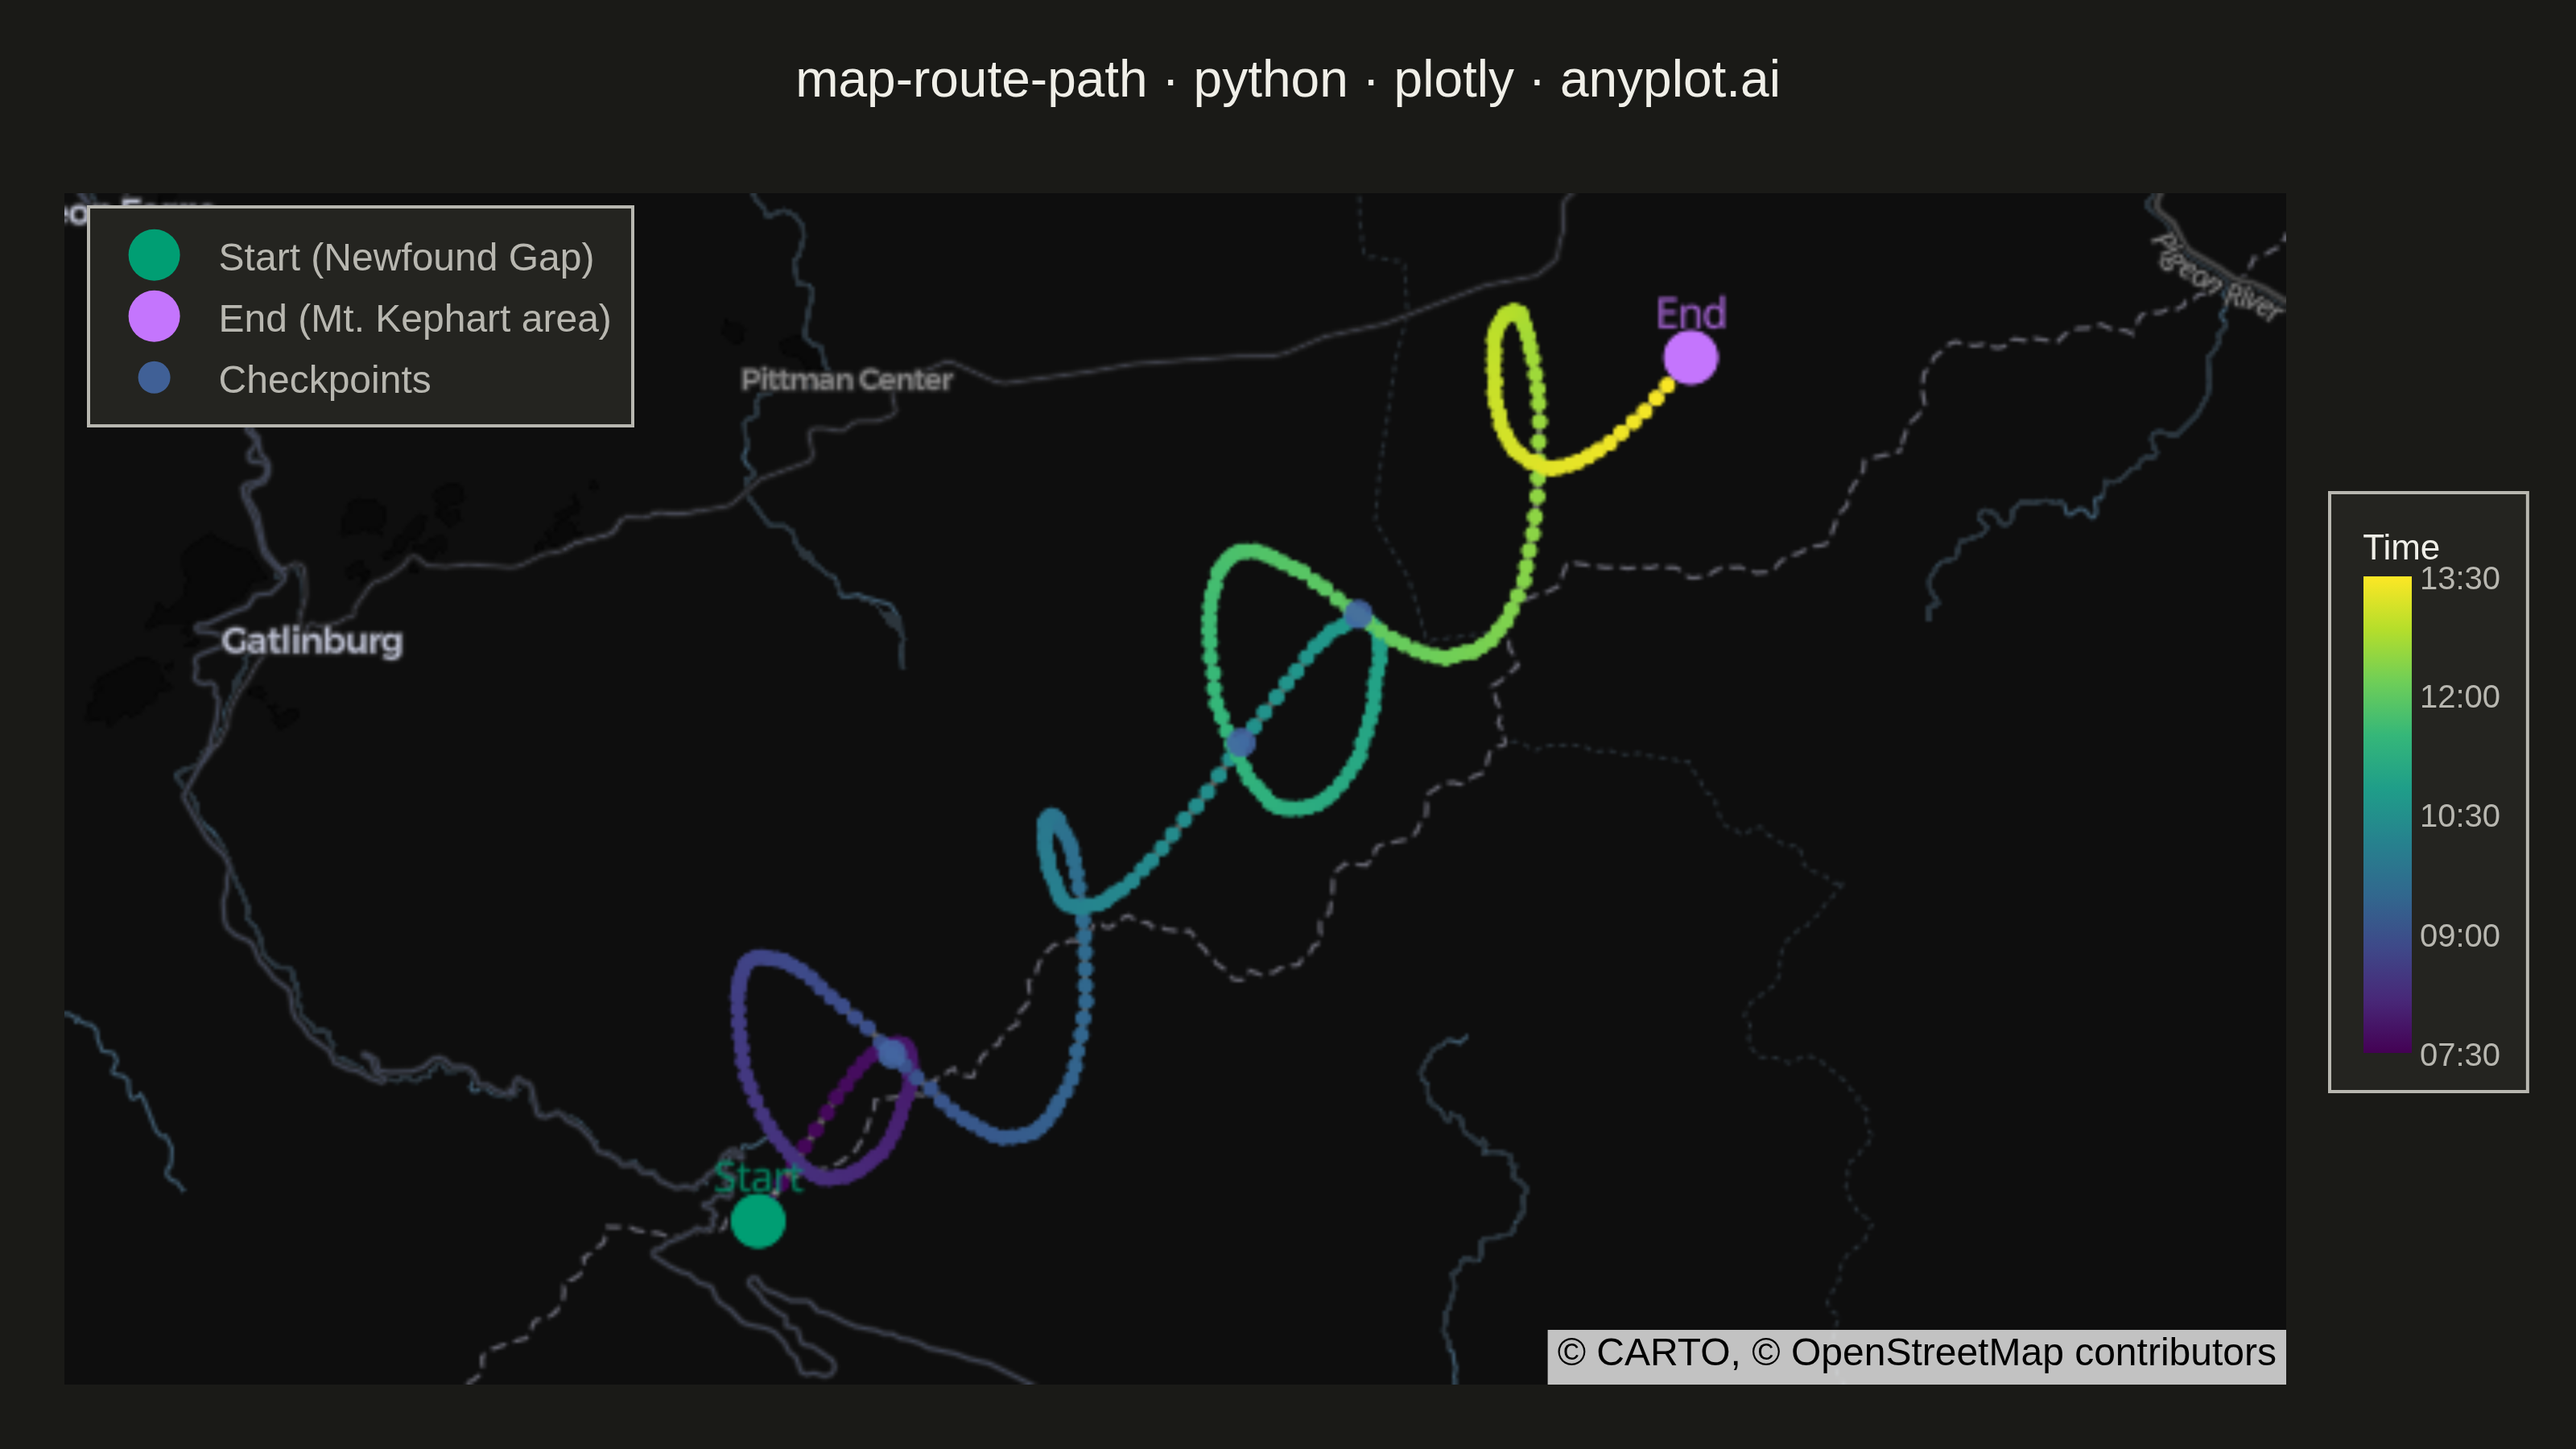
# Use dark tiles for dark theme to maintain visual coherence with dark chrome
map_style = "carto-darkmatter" if THEME == "dark" else "open-street-map"

fig.update_layout(
    autosize=False,
    title={
        "text": "map-route-path · python · plotly · anyplot.ai",
        "font": {"size": 16, "color": INK},
        "x": 0.5,
        "xanchor": "center",
    },
    map={"style": map_style, "center": {"lat": center_lat, "lon": center_lon}, "zoom": 10},
    paper_bgcolor=PAGE_BG,
    font={"color": INK},
    margin={"l": 20, "r": 90, "t": 60, "b": 20},
    legend={
        "x": 0.01,
        "y": 0.99,
        "xanchor": "left",
        "yanchor": "top",
        "bgcolor": ELEVATED_BG,
        "bordercolor": INK_SOFT,
        "borderwidth": 1,
        "font": {"size": 12, "color": INK_SOFT},
    },
)

fig.write_image(f"plot-{THEME}.png", width=800, height=450, scale=4)
fig.write_html(f"plot-{THEME}.html", include_plotlyjs="cdn", full_html=True)
Runnable source as JSON, for any HTTP client: https://api.anyplot.ai/specs/map-route-path/plotly/code. Any spec id and library id listed in llms-full.txt fit the same URL shape; every URL below is complete and callable.
{
  "spec_id": "map-route-path",
  "language": "python",
  "library": "plotly",
  "page": "https://anyplot.ai/map-route-path/python/plotly",
  "hub": "https://anyplot.ai/map-route-path",
  "code_json": "https://api.anyplot.ai/specs/map-route-path/plotly/code",
  "spec_json": "https://api.anyplot.ai/specs/map-route-path",
  "render_light_png": "https://storage.googleapis.com/anyplot-images/plots/map-route-path/python/plotly/plot-light.png",
  "render_dark_png": "https://storage.googleapis.com/anyplot-images/plots/map-route-path/python/plotly/plot-dark.png",
  "interactive_light_html": "https://storage.googleapis.com/anyplot-images/plots/map-route-path/python/plotly/plot-light.html",
  "interactive_dark_html": "https://storage.googleapis.com/anyplot-images/plots/map-route-path/python/plotly/plot-dark.html",
  "quality_score": 84.0,
  "license": "MIT",
  "guide": "https://anyplot.ai/llms.txt"
}
Part of Route Path Map on anyplot.ai.