The same plot in 14 other libraries — JavaScript: Chart.js, D3.js, Apache ECharts, Highcharts; Python: Altair, Bokeh, lets-plot, Matplotlib, Plotly, plotnine, Pygal, Seaborn; R: ggplot2; Julia: Makie.jl. Compare all 15 side by side: Route Path Map in Python, R, Julia and JavaScript.
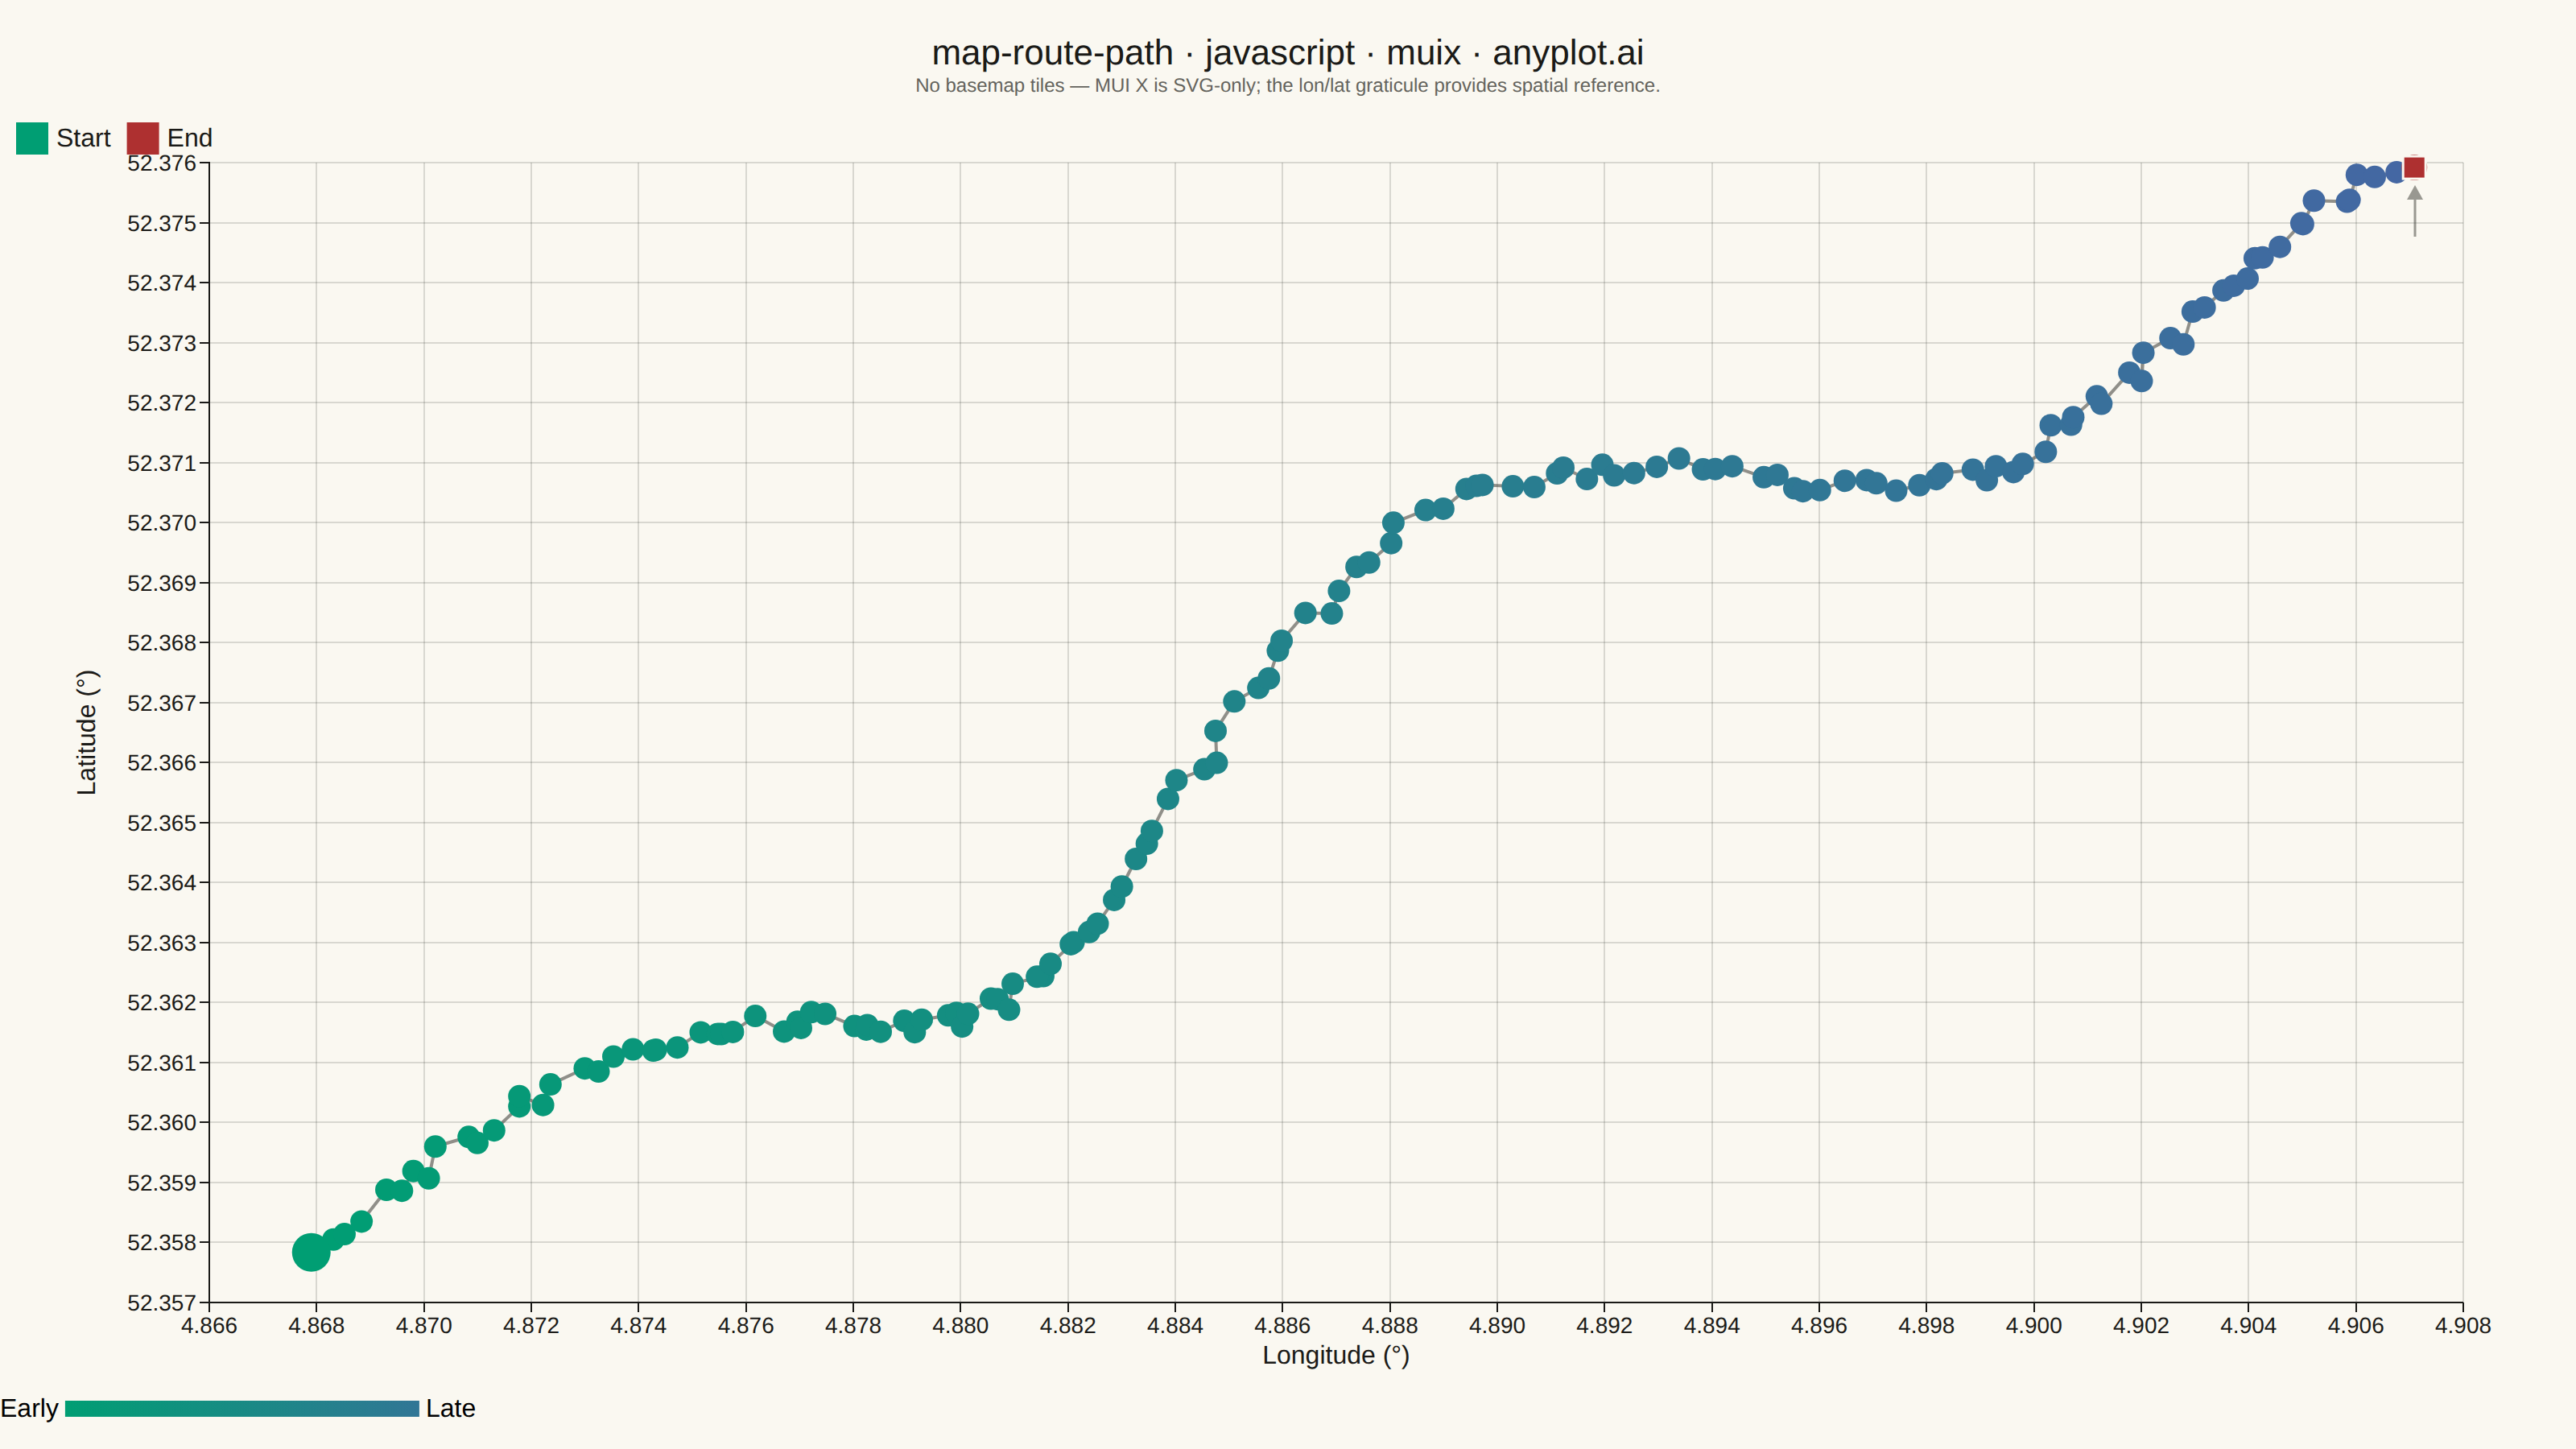
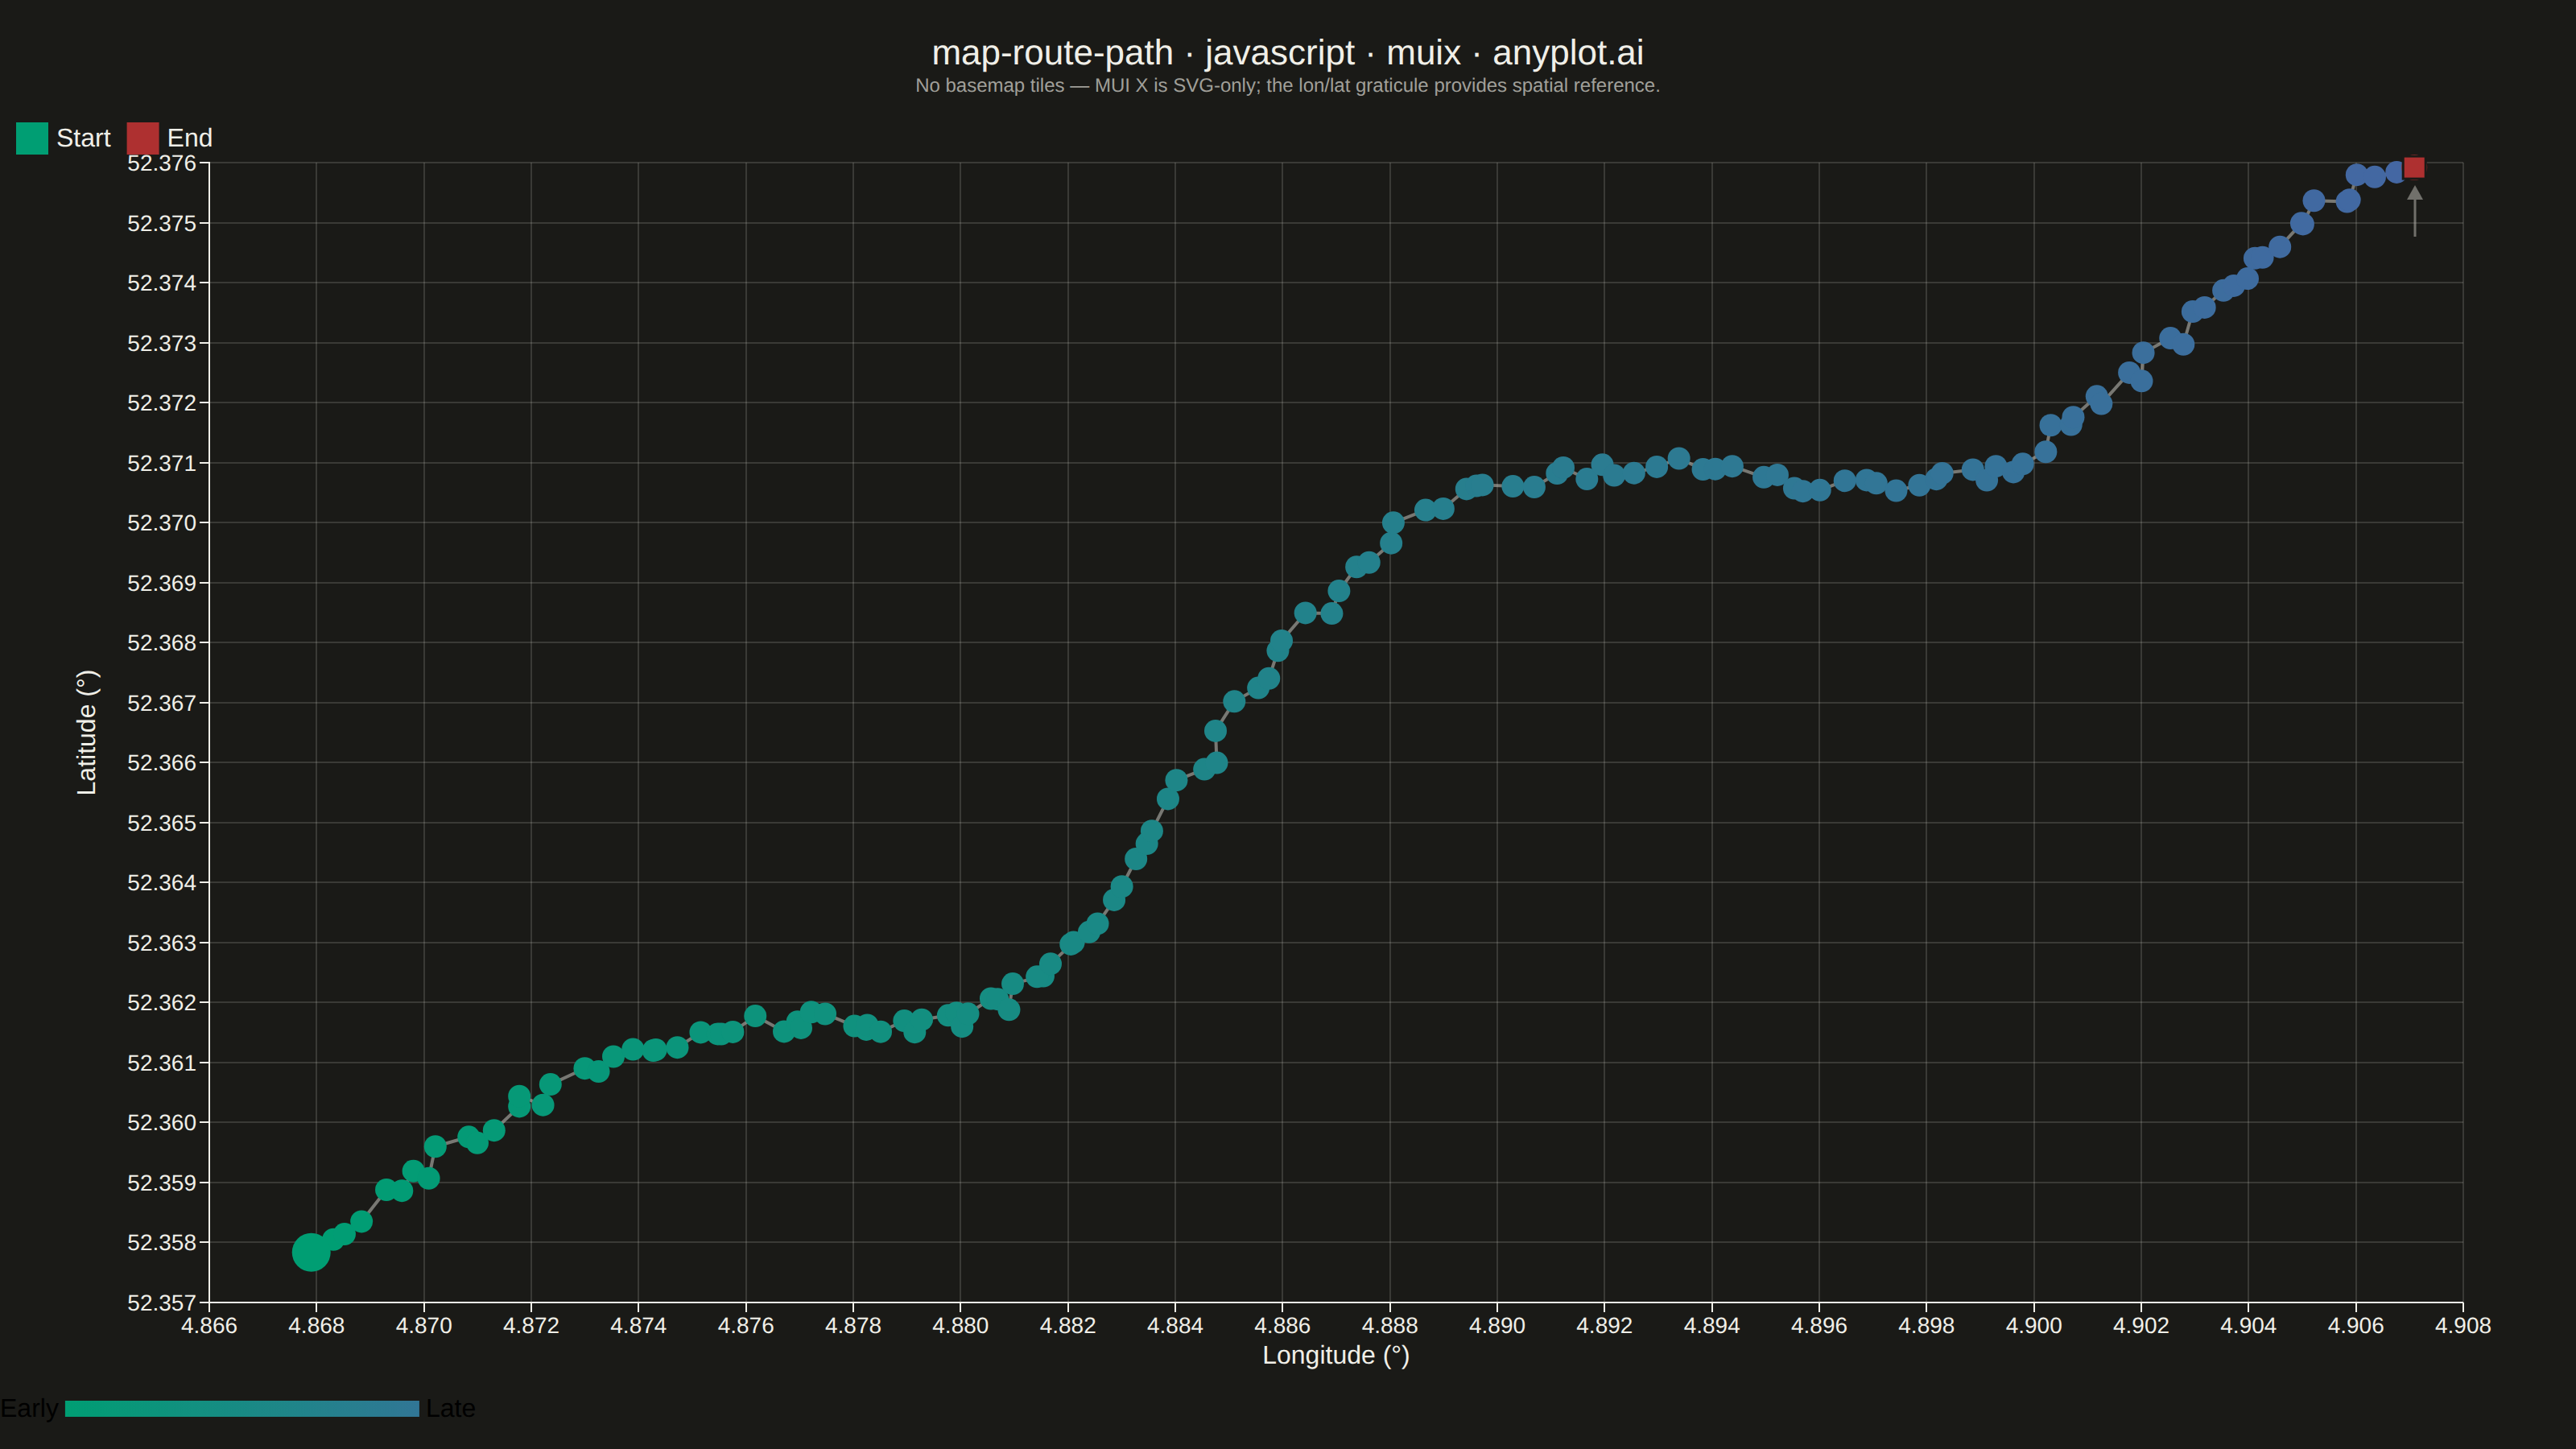
A geographic map visualization showing a connected path or route between sequential waypoints. Unlike scatter maps that display discrete points, this plot connects coordinates in order to reveal journeys, tracks, and navigation paths. Ideal for GPS data, delivery routes, and travel visualization where the sequence and continuity of movement matters.
// anyplot.ai
// map-route-path: Route Path Map
// Library: muix 7.29.1 | JavaScript 22.23.2
// Quality: 85/100 | Created: 2026-09-02
import { ChartContainer } from "@mui/x-charts/ChartContainer";
import { LinePlot } from "@mui/x-charts/LineChart";
import { ScatterPlot } from "@mui/x-charts/ScatterChart";
import { ChartsXAxis } from "@mui/x-charts/ChartsXAxis";
import { ChartsYAxis } from "@mui/x-charts/ChartsYAxis";
import { ChartsGrid } from "@mui/x-charts/ChartsGrid";
import { ChartsTooltip } from "@mui/x-charts/ChartsTooltip";
import { ChartsLegend, ContinuousColorLegend } from "@mui/x-charts/ChartsLegend";
import { useDrawingArea, useXScale, useYScale } from "@mui/x-charts/hooks";
import Box from "@mui/material/Box";
import Typography from "@mui/material/Typography";

const t = window.ANYPLOT_TOKENS;

// --- Data: deterministic LCG — a cycling commute route through Amsterdam ----
function makeLcg(seed: number) {
  let state = seed;
  return () => {
    state = (state * 1664525 + 1013904223) % 4294967296;
    return state / 4294967296;
  };
}
const rand = makeLcg(42);

const N_POINTS = 140;
const START = { lon: 4.868, lat: 52.358 }; // home, Amsterdam-West
const TARGET = { lon: 4.907, lat: 52.376 }; // office, Amsterdam city centre
const LON_SPAN = TARGET.lon - START.lon;
const LAT_SPAN = TARGET.lat - START.lat;

// Longitude advances monotonically with progress fraction `f`, which rules
// out any self-crossing loop by construction — the lateral wiggle (mostly on
// latitude) then reads as organic canal-side turns, not a tangled scribble.
const lon: number[] = [];
const lat: number[] = [];
for (let i = 0; i < N_POINTS; i++) {
  const f = i / (N_POINTS - 1);
  const lonWiggle = Math.sin(f * Math.PI * 3) * 0.0012 * Math.sin(f * Math.PI);
  const latWiggle = Math.sin(f * Math.PI * 4 + 0.6) * 0.0022 * Math.sin(f * Math.PI);
  const lonNoise = (rand() - 0.5) * 0.0004;
  const latNoise = (rand() - 0.5) * 0.0004;
  lon.push(START.lon + LON_SPAN * f + lonWiggle + lonNoise);
  lat.push(START.lat + LAT_SPAN * f + latWiggle + latNoise);
}

const routePoints = lon.map((x, i) => ({ x, y: lat[i], z: i, id: i }));

const TITLE_HEIGHT = 44;
const SUBTITLE_HEIGHT = 28;
const MARGIN = { left: 130, right: 70, top: 40, bottom: 80 };

// MUI X Charts is SVG-only — there is no tile-layer support and network
// fetches are forbidden offline, so a real streets/terrain basemap is not
// achievable here. The lon/lat graticule (ChartsGrid) plus a compass rose
// stand in as the spatial reference frame; this caption documents that
// trade-off explicitly instead of silently omitting the basemap.
const BASEMAP_CAPTION =
  "No basemap tiles — MUI X is SVG-only; the lon/lat graticule provides spatial reference.";

// A small "N" compass rose drawn in the plot's top-right corner. Purely
// decorative map framing, positioned via the real drawing-area geometry so
// it never collides with the data area regardless of margin tuning.
function CompassRose() {
  const { left, top, width } = useDrawingArea();
  const cx = left + width - 30;
  const cy = top + 32;
  return (
    <g opacity={0.55}>
      <line x1={cx} y1={cy + 14} x2={cx} y2={cy - 12} stroke={t.inkSoft} strokeWidth={1.5} />
      <path d={`M ${cx} ${cy - 18} L ${cx - 5} ${cy - 9} L ${cx + 5} ${cy - 9} Z`} fill={t.inkSoft} />
      <text x={cx} y={cy - 22} textAnchor="middle" fontSize={11} fill={t.inkSoft}>
        N
      </text>
    </g>
  );
}

// The End waypoint renders as a red square (not a circle) so start/end are
// distinguishable by shape as well as color, per the spec's example. The
// underlying "End" scatter series keeps a small hidden marker (for legend +
// tooltip) and this square is drawn on top at its exact pixel position.
function EndMarker() {
  const xScale = useXScale("lonAxis");
  const yScale = useYScale("latAxis");
  const cx = xScale(lon[N_POINTS - 1]);
  const cy = yScale(lat[N_POINTS - 1]);
  const size = 14;
  return (
    <rect
      x={cx - size / 2}
      y={cy - size / 2}
      width={size}
      height={size}
      fill={t.palette[4]}
      stroke={t.pageBg}
      strokeWidth={1.5}
    />
  );
}

// --- Chart (default-exported component — the harness mounts it) -----------
export default function Chart() {
  const { width, height } = window.ANYPLOT_SIZE;

  return (
    <Box
      sx={{
        width,
        height,
        display: "flex",
        flexDirection: "column",
        paddingTop: "20px",
      }}
    >
      <Typography
        sx={{
          color: t.ink,
          fontSize: 22,
          fontWeight: 500,
          textAlign: "center",
          lineHeight: 1.2,
        }}
      >
        map-route-path · javascript · muix · anyplot.ai
      </Typography>
      <Typography
        sx={{
          color: t.inkSoft,
          fontSize: 12,
          textAlign: "center",
          lineHeight: 1.2,
          opacity: 0.85,
        }}
      >
        {BASEMAP_CAPTION}
      </Typography>
      <ChartContainer
        width={width}
        height={height - TITLE_HEIGHT - SUBTITLE_HEIGHT}
        margin={MARGIN}
        skipAnimation
        xAxis={[
          {
            id: "lonAxis",
            data: lon,
            scaleType: "linear",
            label: "Longitude (°)",
            valueFormatter: (v: number) => v.toFixed(3),
            tickLabelStyle: { fontSize: 14 },
            labelFontSize: 16,
          },
        ]}
        yAxis={[
          {
            id: "latAxis",
            scaleType: "linear",
            label: "Latitude (°)",
            valueFormatter: (v: number) => v.toFixed(3),
            // MUI X reserves label clearance as `tickFontSize + tickSize + 10`
            // (a fixed constant, not the tick label's actual text width), so a
            // 6-digit coordinate tick ("52.367") needs a much larger tickFontSize
            // than it's actually rendered at to avoid the axis title overlapping
            // it — tickLabelStyle.fontSize below restores the real 14px size.
            tickFontSize: 55,
            tickLabelStyle: { fontSize: 14 },
            labelFontSize: 16,
          },
        ]}
        zAxis={[
          {
            id: "seqAxis",
            min: 0,
            max: N_POINTS - 1,
            colorMap: { type: "continuous", color: [t.seq[0], t.seq[1]] },
          },
          // Start/End markers opt out of the sequence colorMap (which every
          // scatter series would inherit by default via `defaultZAxisId`)
          // so their fixed `color` below is used verbatim.
          { id: "plainAxis" },
        ]}
        series={[
          {
            type: "line",
            xAxisId: "lonAxis",
            yAxisId: "latAxis",
            data: lat,
            showMark: false,
            color: t.inkSoft,
            curve: "linear",
          },
          {
            type: "scatter",
            xAxisId: "lonAxis",
            yAxisId: "latAxis",
            zAxisId: "seqAxis",
            data: routePoints,
            markerSize: 7,
            valueFormatter: (v) => `waypoint ${v.z}`,
          },
          {
            type: "scatter",
            xAxisId: "lonAxis",
            yAxisId: "latAxis",
            zAxisId: "plainAxis",
            data: [{ x: lon[0], y: lat[0], id: "start" }],
            color: t.palette[0],
            markerSize: 12,
            label: "Start",
          },
          {
            // markerSize kept small on purpose: the native circle only
            // needs to exist for the legend swatch + tooltip hit target —
            // the visible red *square* is drawn by <EndMarker /> on top.
            type: "scatter",
            xAxisId: "lonAxis",
            yAxisId: "latAxis",
            zAxisId: "plainAxis",
            data: [{ x: lon[N_POINTS - 1], y: lat[N_POINTS - 1], id: "end" }],
            color: t.palette[4],
            markerSize: 8,
            label: "End",
          },
        ]}
        sx={{
          "& .MuiChartsLegend-label": { fontSize: "14px" },
          "& .MuiLineElement-root": { strokeWidth: 2, strokeOpacity: 0.6 },
        }}
      >
        <ChartsGrid horizontal vertical />
        <CompassRose />
        <LinePlot />
        <ScatterPlot />
        <EndMarker />
        <ChartsXAxis />
        <ChartsYAxis />
        <ChartsLegend position={{ horizontal: "left", vertical: "top" }} direction="row" />
        <ContinuousColorLegend
          axisDirection="z"
          axisId="seqAxis"
          position={{ horizontal: "left", vertical: "bottom" }}
          direction="row"
          minLabel="Early"
          maxLabel="Late"
          length={220}
          thickness={10}
        />
        <ChartsTooltip trigger="item" />
      </ChartContainer>
    </Box>
  );
}
Runnable source as JSON, for any HTTP client: https://api.anyplot.ai/specs/map-route-path/muix/code. Any spec id and library id listed in llms-full.txt fit the same URL shape; every URL below is complete and callable.
{
  "spec_id": "map-route-path",
  "language": "javascript",
  "library": "muix",
  "page": "https://anyplot.ai/map-route-path/javascript/muix",
  "hub": "https://anyplot.ai/map-route-path",
  "code_json": "https://api.anyplot.ai/specs/map-route-path/muix/code",
  "spec_json": "https://api.anyplot.ai/specs/map-route-path",
  "render_light_png": "https://storage.googleapis.com/anyplot-images/plots/map-route-path/javascript/muix/plot-light.png",
  "render_dark_png": "https://storage.googleapis.com/anyplot-images/plots/map-route-path/javascript/muix/plot-dark.png",
  "interactive_light_html": "https://storage.googleapis.com/anyplot-images/plots/map-route-path/javascript/muix/plot-light.html",
  "interactive_dark_html": "https://storage.googleapis.com/anyplot-images/plots/map-route-path/javascript/muix/plot-dark.html",
  "quality_score": 85.0,
  "license": "MIT",
  "guide": "https://anyplot.ai/llms.txt"
}
Part of Route Path Map on anyplot.ai.