The same plot in 14 other libraries — Python: Altair, Bokeh, lets-plot, Matplotlib, Plotly, plotnine, Pygal, Seaborn; R: ggplot2; JavaScript: Chart.js, D3.js, Apache ECharts, Highcharts, MUI X Charts. Compare all 15 side by side: Route Path Map in Python, R, Julia and JavaScript.
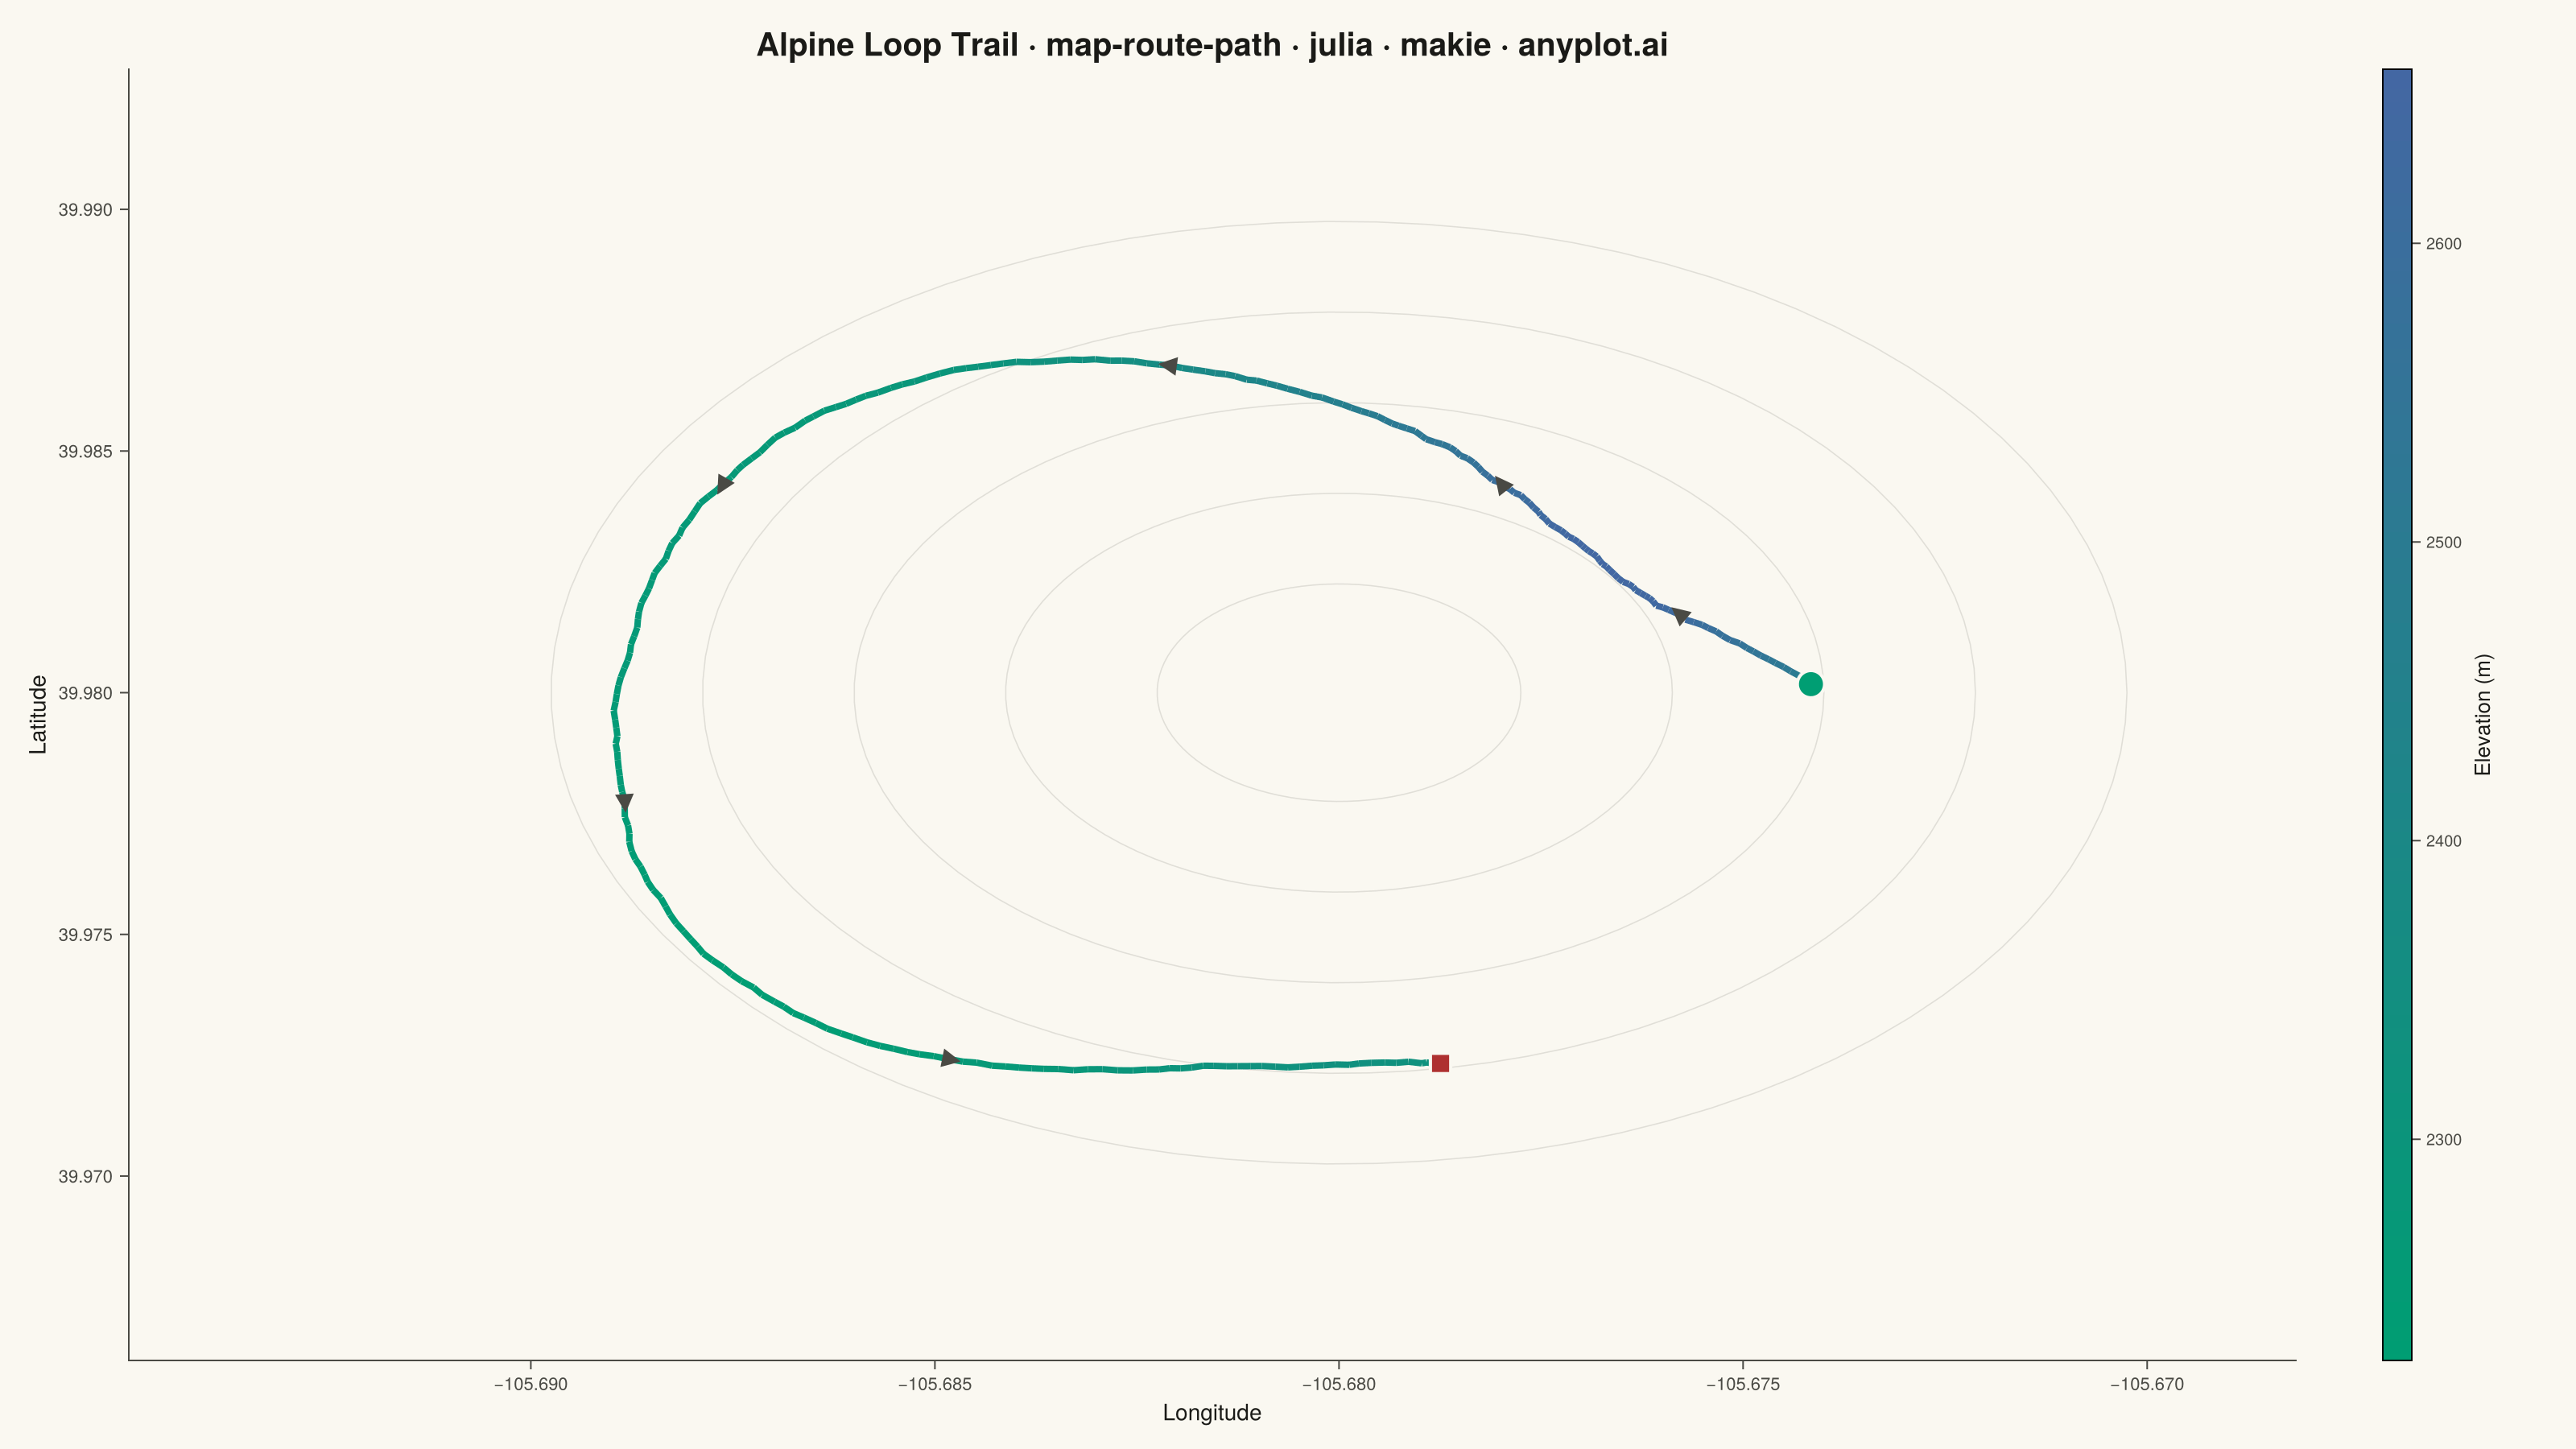
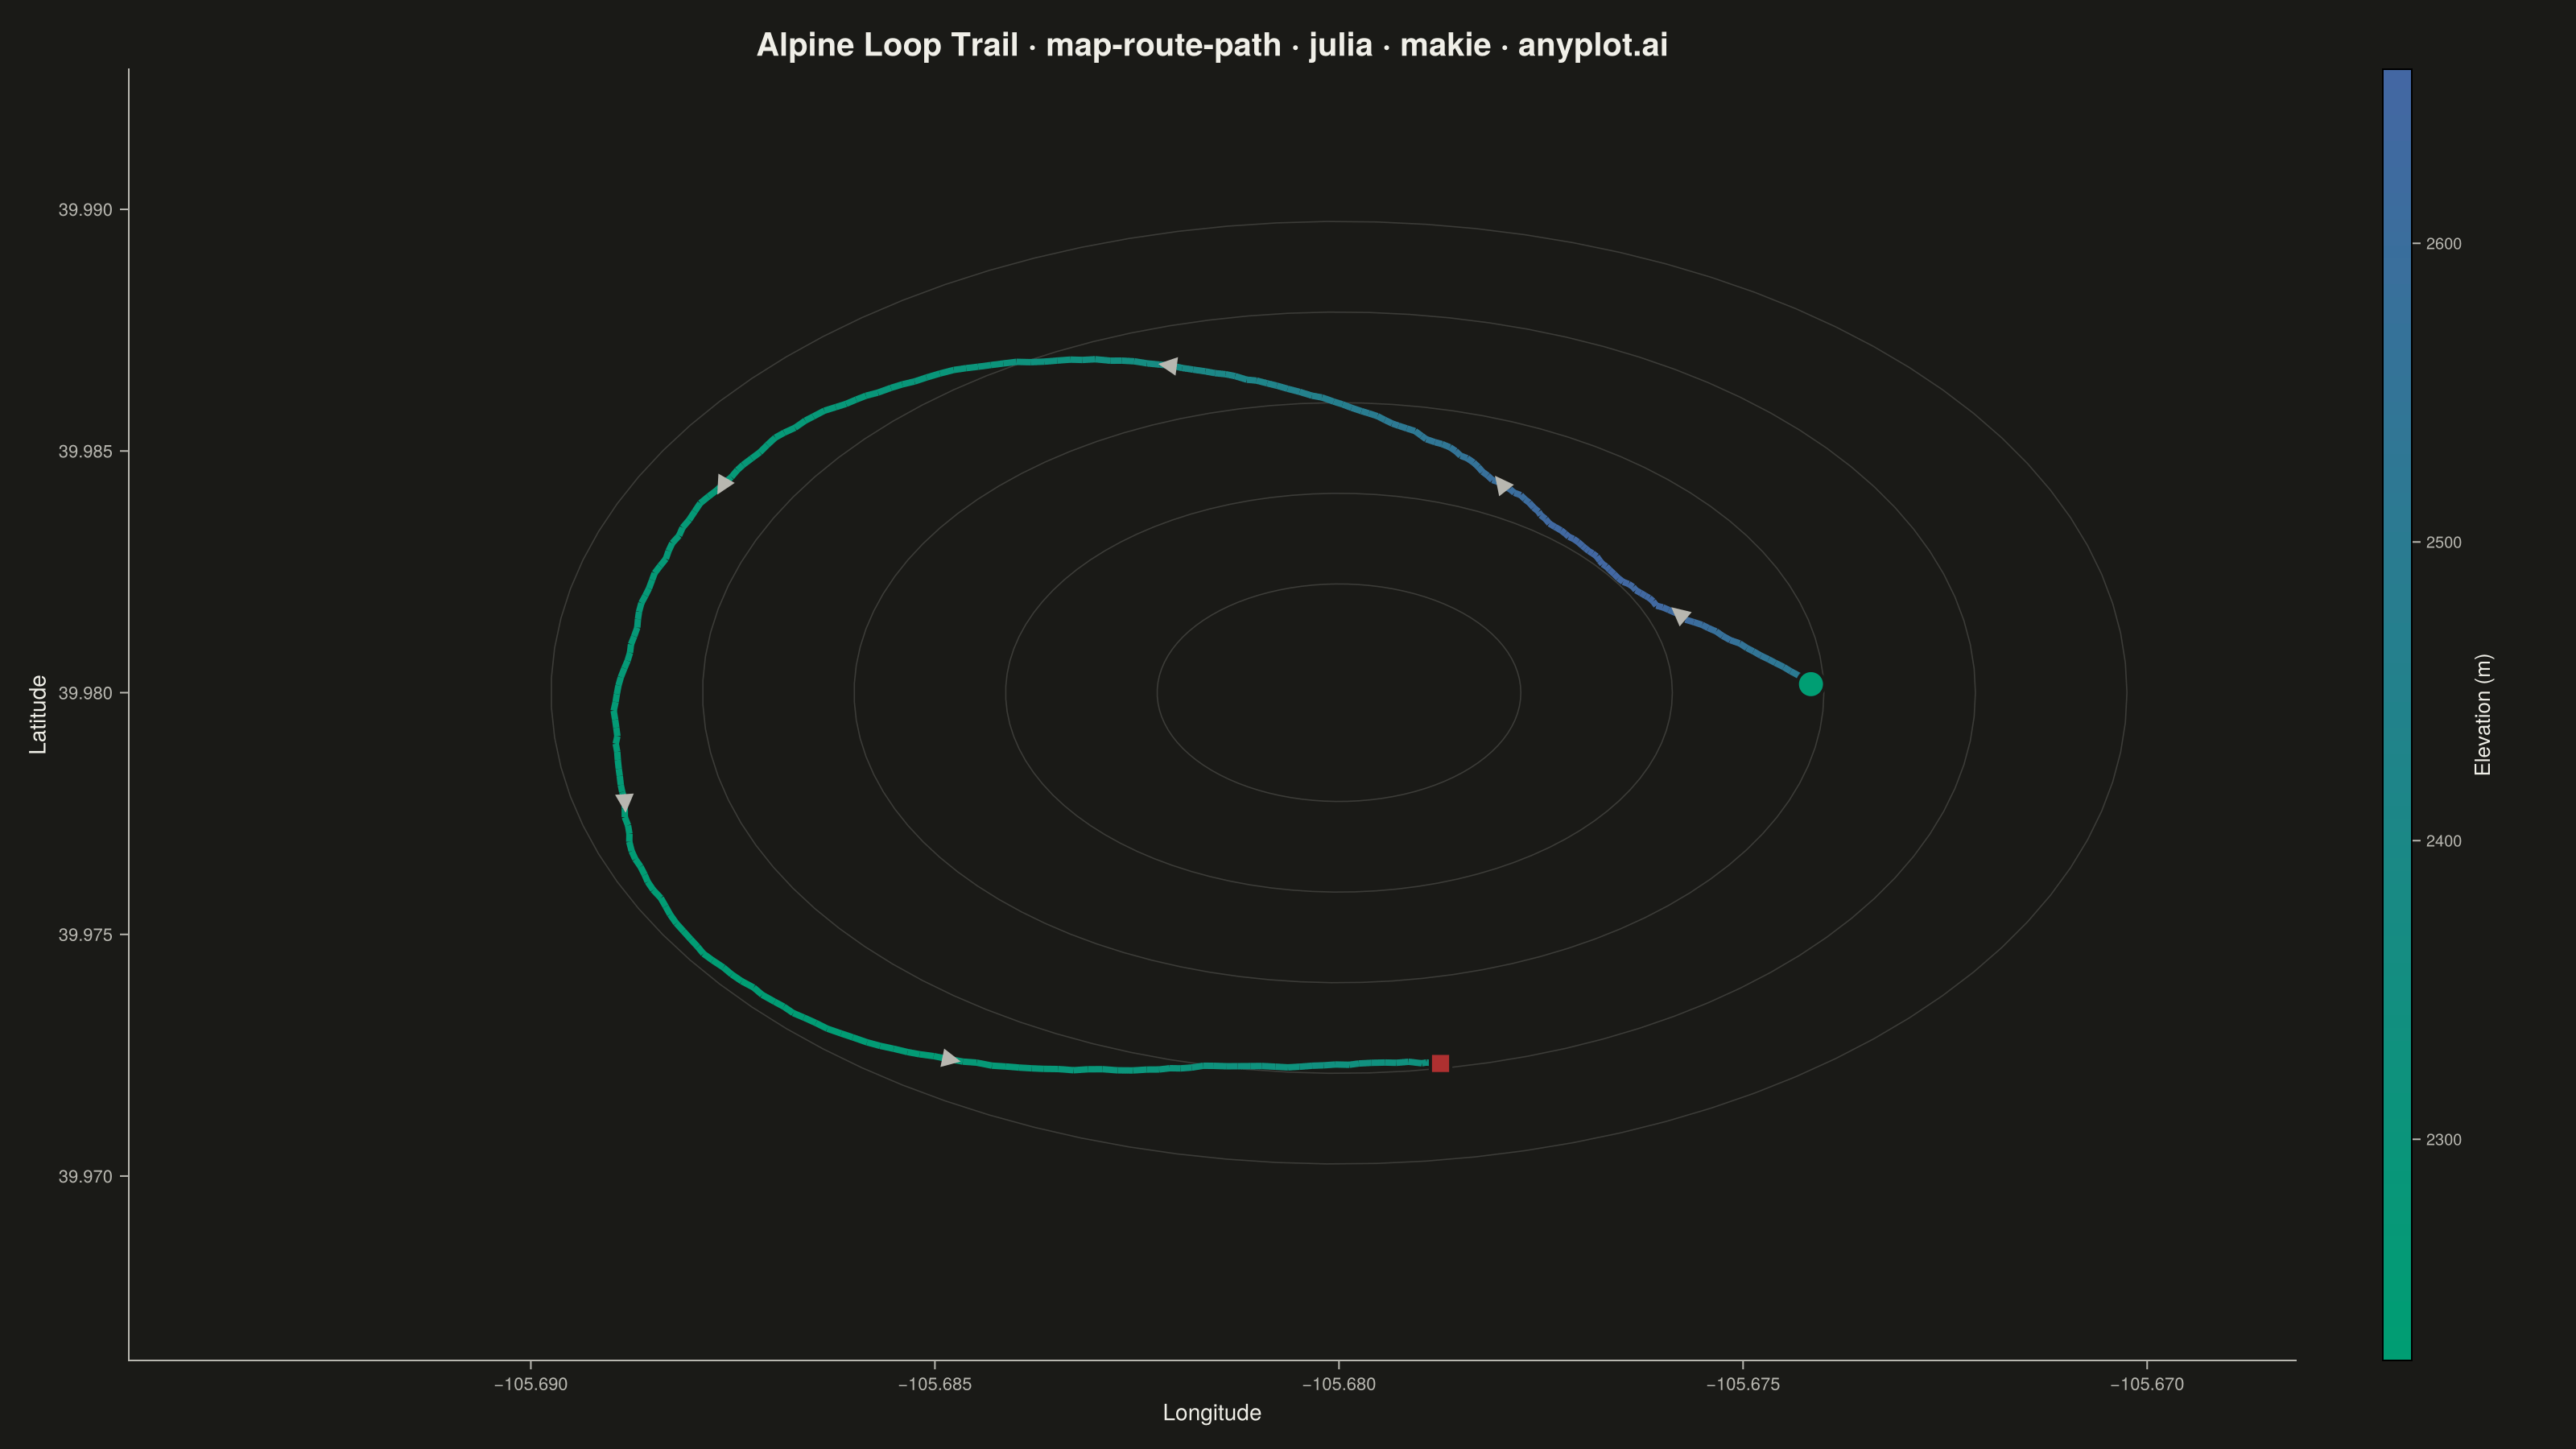
A geographic map visualization showing a connected path or route between sequential waypoints. Unlike scatter maps that display discrete points, this plot connects coordinates in order to reveal journeys, tracks, and navigation paths. Ideal for GPS data, delivery routes, and travel visualization where the sequence and continuity of movement matters.
# anyplot.ai
# map-route-path: Route Path Map
# Library: makie 0.21.9 | Julia 1.11.9
# Quality: 70/100 | Created: 2026-09-02

using CairoMakie
using Colors
using Random

Random.seed!(42)

# --- Theme tokens ------------------------------------------------------------
const THEME     = get(ENV, "ANYPLOT_THEME", "light")
const PAGE_BG   = THEME == "light" ? colorant"#FAF8F1" : colorant"#1A1A17"
const INK       = THEME == "light" ? colorant"#1A1A17" : colorant"#F0EFE8"
const INK_SOFT  = THEME == "light" ? colorant"#4A4A44" : colorant"#B8B7B0"
const TERRAIN_LINE = THEME == "light" ?
    RGBAf(26f0 / 255f0, 26f0 / 255f0, 23f0 / 255f0, 0.12f0) :
    RGBAf(240f0 / 255f0, 239f0 / 255f0, 232f0 / 255f0, 0.16f0)

# Sequential colormap (Imprint): brand green -> blue, single-polarity elevation
const ANYPLOT_SEQ = cgrad([colorant"#009E73", colorant"#4467A3"])
const START_COLOR = colorant"#009E73"  # brand green, first categorical series
const END_COLOR   = colorant"#AE3030"  # matte red, semantic anchor for the endpoint

# --- Data: a mountain loop trail GPS track -----------------------------------
# The trail traces most of a loop around a peak but does not fully close,
# so the trailhead (start) and the exit point (end) sit apart on the map.
const N_POINTS    = 260
const LAT_C, LON_C = 39.9800, -105.6800   # loop centroid (peak the trail circles)
const R_DEG        = 0.0075               # loop radius in degrees (~0.8 km)

n_harmonics = 4
harmonic_amp   = [0.28, 0.14, 0.08, 0.05]
harmonic_phase = 2π .* rand(n_harmonics)

closure_gap = 0.22                        # fraction of the loop left open
theta = range(0, 2π * (1 - closure_gap); length = N_POINTS)
radius = [
    1.0 + sum(harmonic_amp[k] * sin(k * t + harmonic_phase[k]) for k in 1:n_harmonics)
    for t in theta
]

lat_path = LAT_C .+ R_DEG .* radius .* sin.(theta)
lon_path = LON_C .+ R_DEG .* radius .* cos.(theta)

# GPS measurement noise, then smoothed like a real recorded track
noise_deg = 0.00025
lat_noisy = lat_path .+ noise_deg .* (rand(N_POINTS) .- 0.5)
lon_noisy = lon_path .+ noise_deg .* (rand(N_POINTS) .- 0.5)

function smooth_track(v, half_window)
    n = length(v)
    return [
        sum(v[max(1, i - half_window):min(n, i + half_window)]) /
        length(max(1, i - half_window):min(n, i + half_window))
        for i in 1:n
    ]
end

lat_smooth = smooth_track(lat_noisy, 3)
lon_smooth = smooth_track(lon_noisy, 3)

# Elevation field: a single peak at the loop centroid, giving the trail a
# realistic elevation profile (rises on the outbound leg, falls on return).
elevation_field(lon, lat) = 2150.0 + 780.0 * exp(
    -((lon - LON_C)^2 + (lat - LAT_C)^2) / (2 * 0.0045^2)
)
elev_m    = elevation_field.(lon_smooth, lat_smooth) .+ 15.0 .* (rand(N_POINTS) .- 0.5)
elev_norm = (elev_m .- minimum(elev_m)) ./ (maximum(elev_m) - minimum(elev_m))
elev_gain = sum(max.(diff(elev_m), 0.0))   # total climb along the recorded track
peak_elev = elevation_field(LON_C, LAT_C)  # elevation at the loop's centroid peak

# Terrain basemap: the elevation field is a single radially-symmetric peak,
# so its contour lines are exact circles around the centroid — drawn
# analytically instead of through a numeric contour grid.
pad = 0.006
lon_min, lon_max = minimum(lon_smooth) - pad, maximum(lon_smooth) + pad
lat_min, lat_max = minimum(lat_smooth) - pad, maximum(lat_smooth) + pad
ring_phi = range(0, 2π; length = 100)
ring_radii = R_DEG .* [0.3, 0.55, 0.8, 1.05, 1.3]
labeled_ring_idx = [2, 4]   # label a couple of rings with their elevation value

# Direction arrows: a handful of rotated triangles along the smoothed track
arrow_idx = 20:40:(N_POINTS-10)
arrow_lon = [lon_smooth[i] for i in arrow_idx]
arrow_lat = [lat_smooth[i] for i in arrow_idx]
arrow_rot = [
    atan(lat_smooth[i+5] - lat_smooth[i], lon_smooth[i+5] - lon_smooth[i]) - π / 2
    for i in arrow_idx
]

# --- Plot ---------------------------------------------------------------------
const title_str = "Alpine Loop Trail · map-route-path · julia · makie · anyplot.ai"
const title_sz   = round(Int, 25 * min(1.0, 67 / length(title_str)))

fig = Figure(
    size            = (1600, 900),
    fontsize        = 12,
    backgroundcolor = PAGE_BG,
)

ax = Axis(
    fig[1, 1];
    title             = title_str,
    titlesize         = title_sz,
    titlecolor        = INK,
    xlabel            = "Longitude",
    ylabel            = "Latitude",
    xlabelsize        = 14,
    ylabelsize        = 14,
    xlabelcolor       = INK,
    ylabelcolor       = INK,
    xticklabelsize    = 11,
    yticklabelsize    = 11,
    xticklabelcolor   = INK_SOFT,
    yticklabelcolor   = INK_SOFT,
    xtickcolor        = INK_SOFT,
    ytickcolor        = INK_SOFT,
    backgroundcolor   = PAGE_BG,
    topspinevisible   = false,
    rightspinevisible = false,
    leftspinecolor    = INK_SOFT,
    bottomspinecolor  = INK_SOFT,
    xgridvisible      = false,
    ygridvisible      = false,
    limits            = (lon_min, lon_max, lat_min, lat_max),
)

# Basemap: concentric elevation rings around the peak the trail circles,
# with a couple of rings labeled by contour value so they read as terrain
# context rather than decoration.
for (i, r) in enumerate(ring_radii)
    lines!(ax, LON_C .+ r .* cos.(ring_phi), LAT_C .+ r .* sin.(ring_phi);
        color = TERRAIN_LINE, linewidth = 0.8)
    if i in labeled_ring_idx
        ring_elev = elevation_field(LON_C, LAT_C + r)
        text!(ax, LON_C, LAT_C + r;
            text      = "$(round(Int, ring_elev)) m",
            fontsize  = 9,
            color     = INK_SOFT,
            align     = (:center, :bottom),
            offset    = (0, 2),
            space     = :data,
        )
    end
end

# Summit marker: the peak the contour rings and elevation gradient center on
scatter!(ax, [LON_C], [LAT_C];
    marker      = :diamond,
    markersize  = 12,
    color       = INK_SOFT,
    strokewidth = 0,
)
text!(ax, LON_C, LAT_C;
    text      = "Peak · $(round(Int, peak_elev)) m",
    fontsize  = 11,
    color     = INK_SOFT,
    align     = (:center, :top),
    offset    = (0, -8),
    space     = :data,
)

# Trail stat callout: total elevation gain along the recorded track
text!(ax, lon_min + 0.04 * (lon_max - lon_min), lat_max - 0.04 * (lat_max - lat_min);
    text      = "Elevation gain: +$(round(Int, elev_gain)) m",
    fontsize  = 12,
    color     = INK_SOFT,
    align     = (:left, :top),
    space     = :data,
)

# Route path, colored by elevation (Imprint sequential: green -> blue)
lines!(ax, lon_smooth, lat_smooth;
    color     = elev_norm,
    colormap  = ANYPLOT_SEQ,
    linewidth = 4.0,
)

# Direction-of-travel markers
scatter!(ax, arrow_lon, arrow_lat;
    marker      = :utriangle,
    markersize  = 16,
    rotation    = arrow_rot,
    color       = INK_SOFT,
    strokewidth = 0,
)

# Start marker (trailhead)
scatter!(ax, [lon_smooth[1]], [lat_smooth[1]];
    marker      = :circle,
    markersize  = 24,
    color       = START_COLOR,
    strokewidth = 2,
    strokecolor = PAGE_BG,
)

# End marker (exit point)
scatter!(ax, [lon_smooth[end]], [lat_smooth[end]];
    marker      = :rect,
    markersize  = 20,
    color       = END_COLOR,
    strokewidth = 2,
    strokecolor = PAGE_BG,
)

Colorbar(fig[1, 2];
    colormap       = ANYPLOT_SEQ,
    limits         = (minimum(elev_m), maximum(elev_m)),
    label          = "Elevation (m)",
    labelsize      = 13,
    labelcolor     = INK,
    ticklabelsize  = 10,
    ticklabelcolor = INK_SOFT,
    tickcolor      = INK_SOFT,
    width          = 18,
    tellheight     = false,
)

colsize!(fig.layout, 2, Fixed(90))

# --- Save ----------------------------------------------------------------------
save("plot-$(THEME).png", fig; px_per_unit = 2)
Runnable source as JSON, for any HTTP client: https://api.anyplot.ai/specs/map-route-path/makie/code. Any spec id and library id listed in llms-full.txt fit the same URL shape; every URL below is complete and callable.
{
  "spec_id": "map-route-path",
  "language": "julia",
  "library": "makie",
  "page": "https://anyplot.ai/map-route-path/julia/makie",
  "hub": "https://anyplot.ai/map-route-path",
  "code_json": "https://api.anyplot.ai/specs/map-route-path/makie/code",
  "spec_json": "https://api.anyplot.ai/specs/map-route-path",
  "render_light_png": "https://storage.googleapis.com/anyplot-images/plots/map-route-path/julia/makie/plot-light.png",
  "render_dark_png": "https://storage.googleapis.com/anyplot-images/plots/map-route-path/julia/makie/plot-dark.png",
  "quality_score": 70.0,
  "license": "MIT",
  "guide": "https://anyplot.ai/llms.txt"
}
Part of Route Path Map on anyplot.ai.