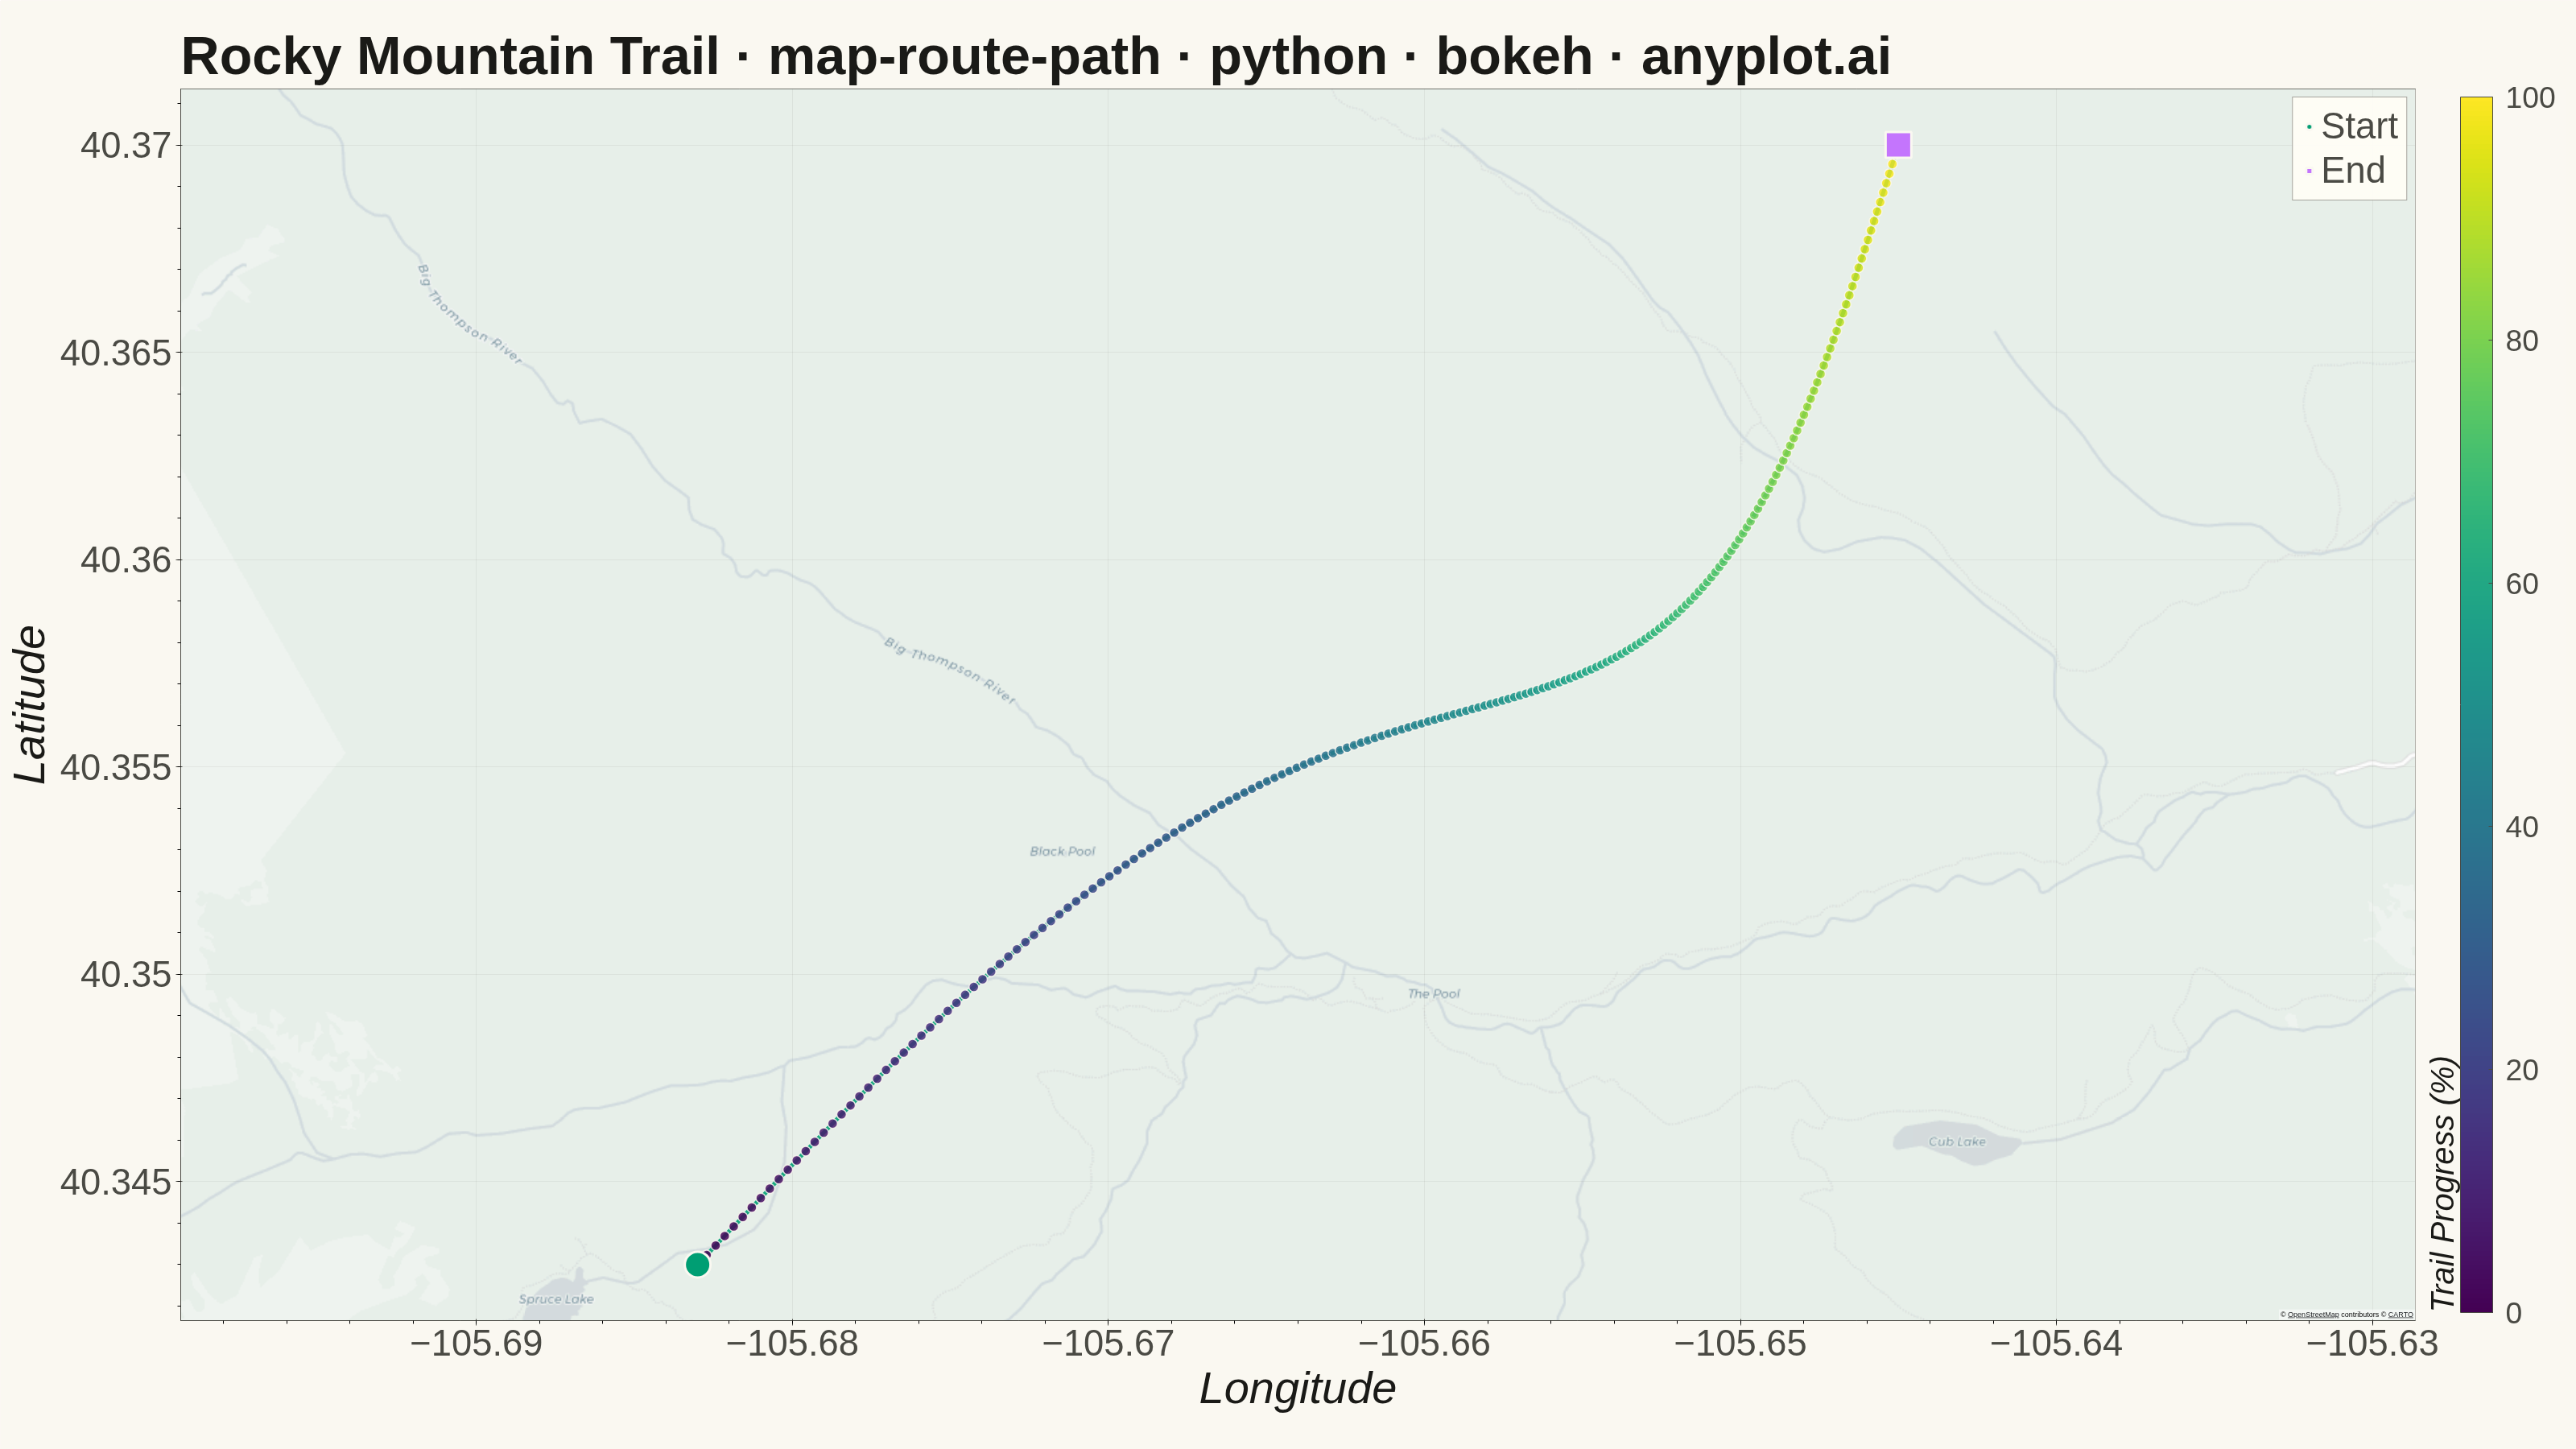
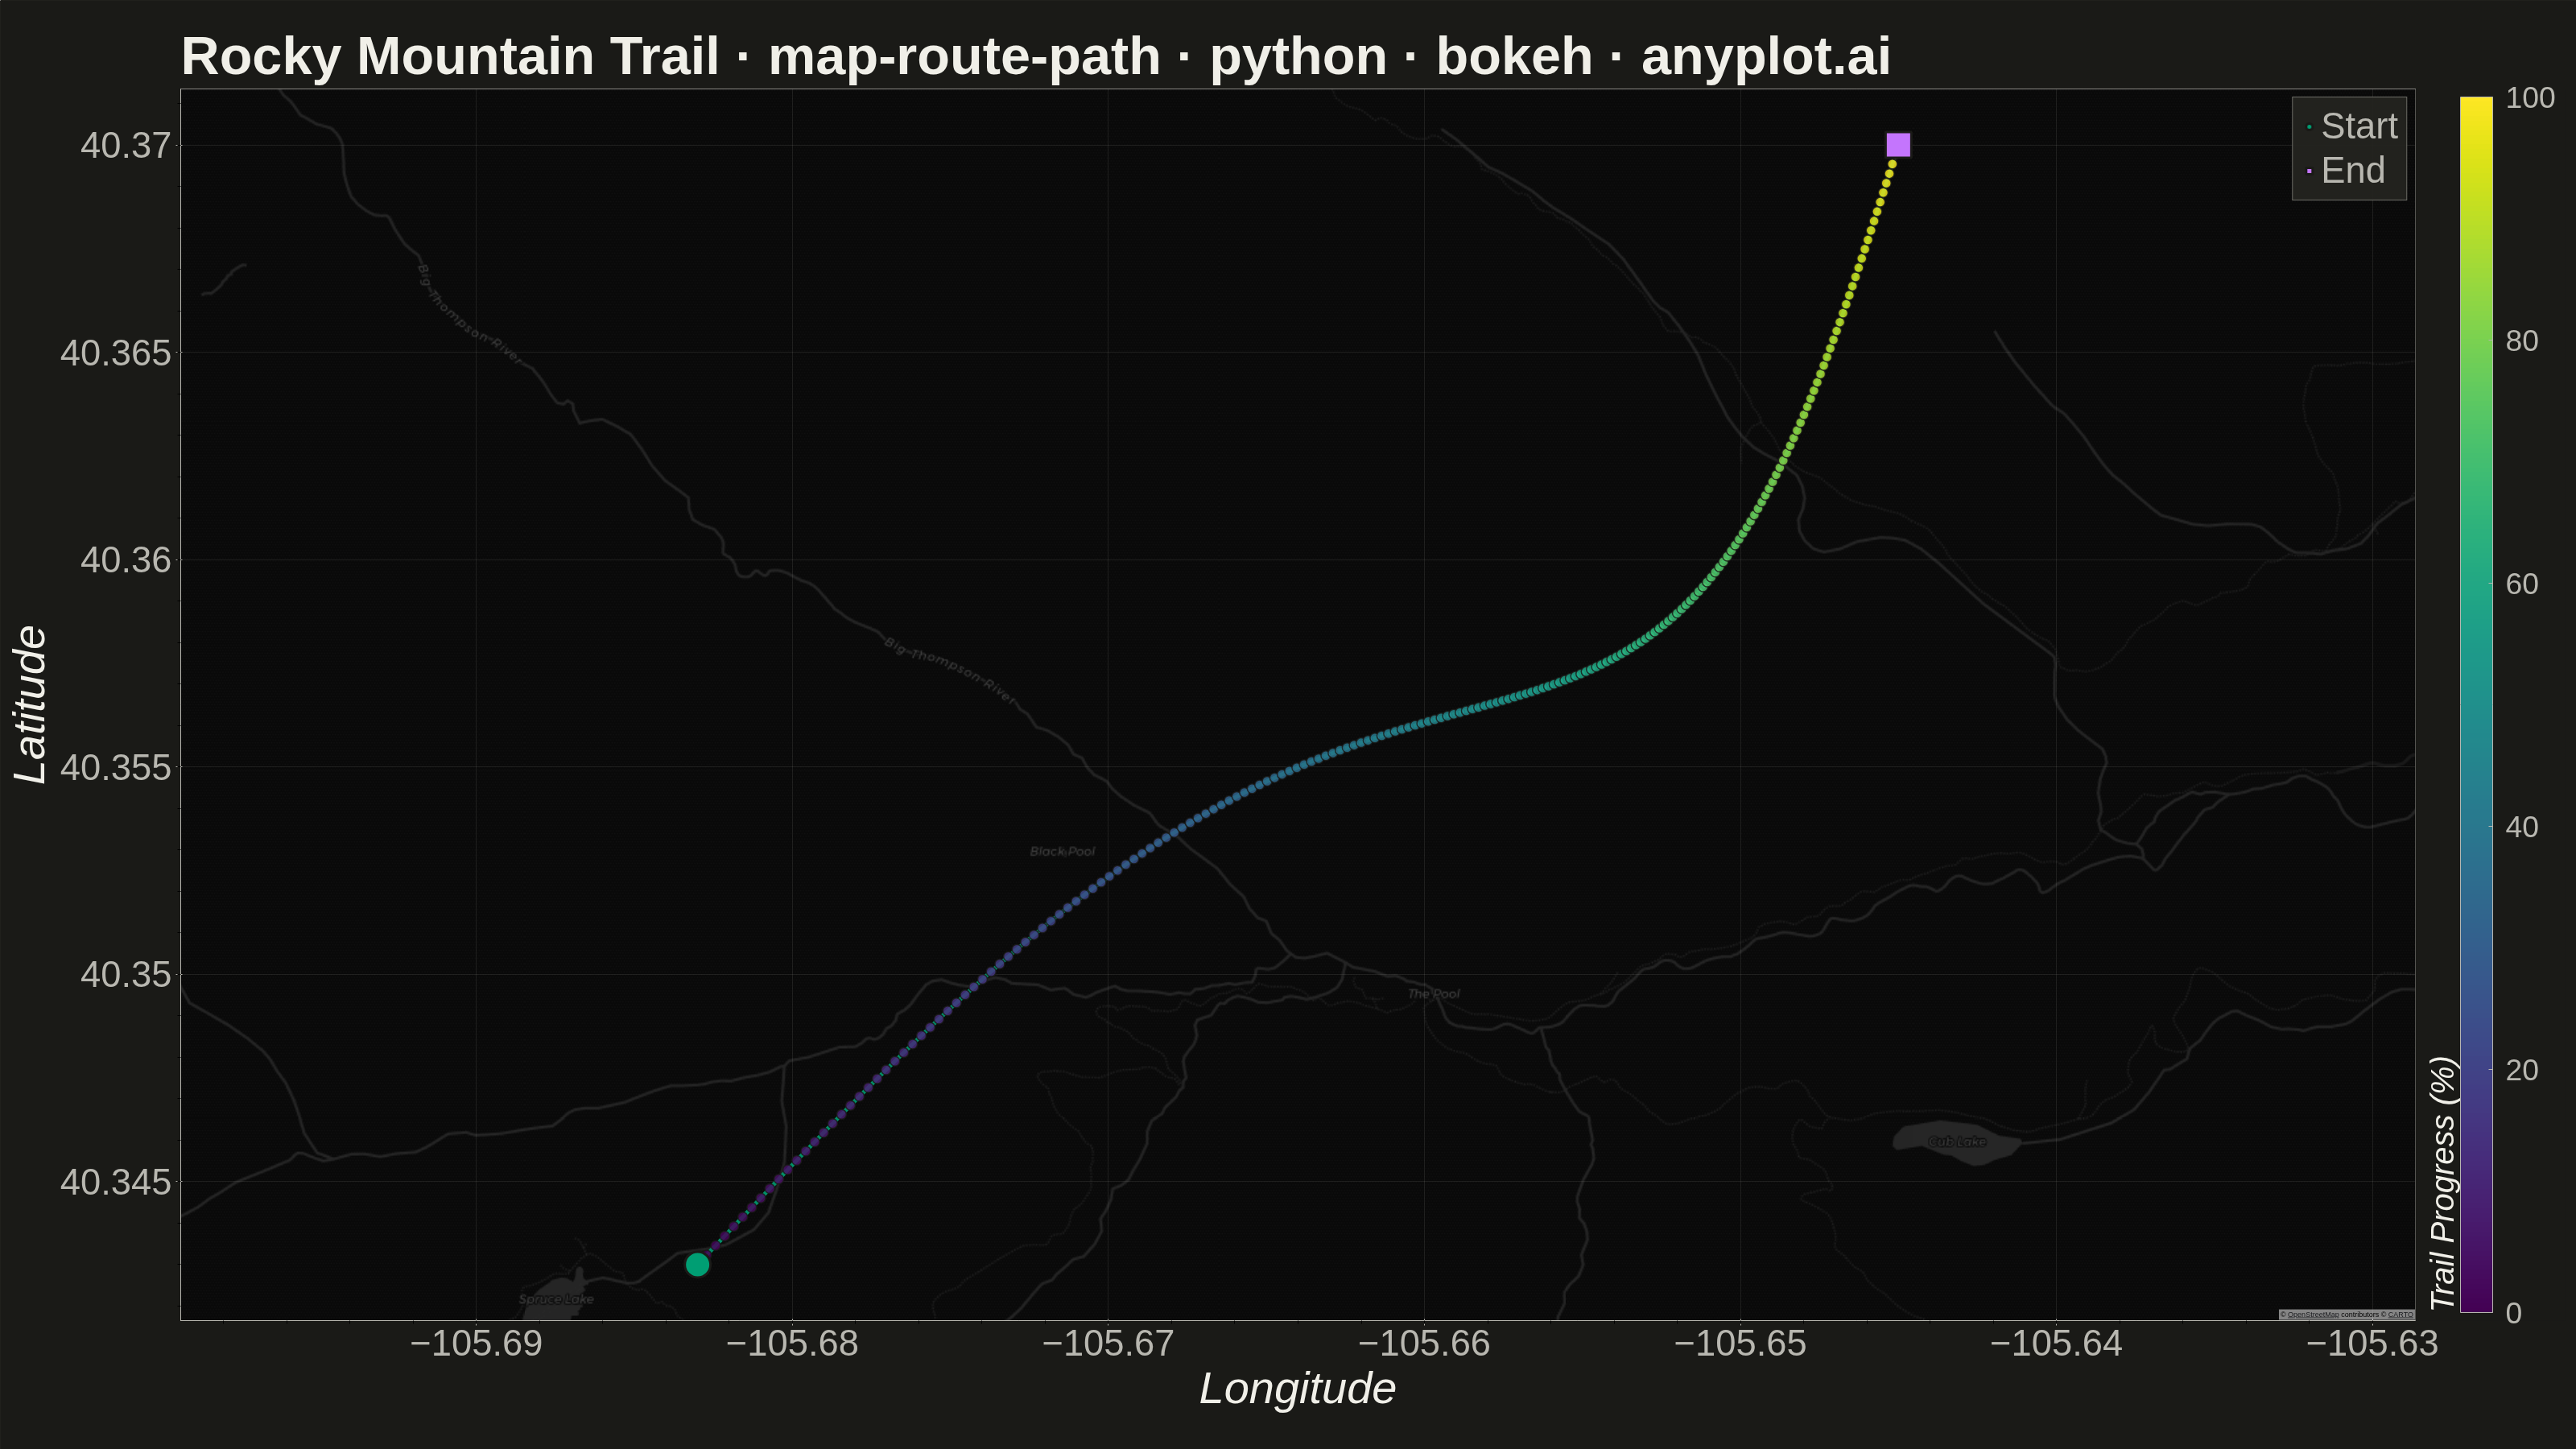
A geographic map visualization showing a connected path or route between sequential waypoints. Unlike scatter maps that display discrete points, this plot connects coordinates in order to reveal journeys, tracks, and navigation paths. Ideal for GPS data, delivery routes, and travel visualization where the sequence and continuity of movement matters.
""" anyplot.ai
map-route-path: Route Path Map
Library: bokeh 3.9.0 | Python 3.13.13
Quality: 90/100 | Updated: 2026-05-21
"""

import base64
import os
import sys
import time
from pathlib import Path


# bokeh.py shadows the installed bokeh package when Python adds this file's
# directory to sys.path[0]; remove it so imports resolve to the package.
_here = os.path.dirname(os.path.abspath(__file__))
sys.path[:] = [p for p in sys.path if os.path.abspath(p or ".") != _here]
del _here

import numpy as np
from bokeh.io import output_file, save
from bokeh.models import ColorBar, ColumnDataSource, LinearColorMapper, Title
from bokeh.palettes import Viridis256
from bokeh.plotting import figure
from selenium import webdriver
from selenium.webdriver.chrome.options import Options


# Theme
THEME = os.getenv("ANYPLOT_THEME", "light")
PAGE_BG = "#FAF8F1" if THEME == "light" else "#1A1A17"
ELEVATED_BG = "#FFFDF6" if THEME == "light" else "#242420"
INK = "#1A1A17" if THEME == "light" else "#F0EFE8"
INK_SOFT = "#4A4A44" if THEME == "light" else "#B8B7B0"

# Data - Simulated hiking trail GPS track (Rocky Mountain National Park)
np.random.seed(42)

start_lon = -105.683
start_lat = 40.343

n_points = 200
t = np.linspace(0, 1, n_points)

# Low-frequency meanders: both lon and lat are monotonically increasing at all t,
# so the trail never crosses itself (verified: d(lon)/dt >= 0.019, d(lat)/dt >= 0.008)
lon_progress = 0.038 * t
lat_progress = 0.027 * t
lon_meander = 0.006 * np.sin(np.pi * t)
lat_meander = 0.003 * np.sin(2 * np.pi * t)

lats = start_lat + lat_progress + lat_meander
lons = start_lon + lon_progress + lon_meander

# Convert lat/lon to Web Mercator for tile compatibility
k = 20037508.34 / 180
x_coords = lons * k
y_coords = np.log(np.tan((90 + lats) * np.pi / 360)) / (np.pi / 180) * k

# Progress percentage (0–100) drives both dot coloring and the colorbar
t_pct = t * 100
mapper = LinearColorMapper(palette=Viridis256, low=0, high=100)

source = ColumnDataSource(data={"x": x_coords, "y": y_coords, "t_pct": t_pct})

# Figure
W, H = 3200, 1800
p = figure(
    width=W,
    height=H,
    x_axis_type="mercator",
    y_axis_type="mercator",
    x_axis_label="Longitude",
    y_axis_label="Latitude",
    toolbar_location=None,
    min_border_bottom=160,
    min_border_left=180,
    min_border_top=110,
    min_border_right=200,  # extra room for the colorbar + tick labels
)

# Title
title_obj = Title(
    text="Rocky Mountain Trail · map-route-path · python · bokeh · anyplot.ai", text_font_size="50pt", text_color=INK
)
p.add_layout(title_obj, "above")

# Theme-appropriate basemap tile
tile_provider = "CartoDB Positron" if THEME == "light" else "CartoDB Dark Matter"
p.add_tile(tile_provider)

# Route line — Okabe-Ito position 1 (#009E73)
p.line(x="x", y="y", source=source, line_width=5, line_color="#009E73", line_alpha=0.9)

# Waypoints with viridis gradient showing trail progression
p.scatter(
    x="x",
    y="y",
    source=source,
    size=12,
    fill_color={"field": "t_pct", "transform": mapper},
    line_color=PAGE_BG,
    line_width=1.5,
    alpha=0.85,
)

# Start marker — Okabe-Ito #009E73 (large circle)
start_src = ColumnDataSource(data={"x": [x_coords[0]], "y": [y_coords[0]]})
p.scatter(
    x="x",
    y="y",
    source=start_src,
    size=32,
    fill_color="#009E73",
    line_color=PAGE_BG,
    line_width=3,
    legend_label="Start",
)

# End marker — Okabe-Ito #C475FD (large square)
end_src = ColumnDataSource(data={"x": [x_coords[-1]], "y": [y_coords[-1]]})
p.scatter(
    x="x",
    y="y",
    source=end_src,
    size=32,
    fill_color="#C475FD",
    line_color=PAGE_BG,
    line_width=3,
    marker="square",
    legend_label="End",
)

# Colorbar decoding the viridis gradient: purple = trail start, yellow = trail end
color_bar = ColorBar(
    color_mapper=mapper,
    label_standoff=16,
    major_label_text_font_size="28pt",
    major_label_text_color=INK_SOFT,
    title="Trail Progress (%)",
    title_text_font_size="30pt",
    title_text_color=INK,
    background_fill_color=PAGE_BG,
    bar_line_color=INK_SOFT,
    major_tick_line_color=INK_SOFT,
    width=40,
)
p.add_layout(color_bar, "right")

# Theme-adaptive chrome
p.background_fill_color = PAGE_BG
p.border_fill_color = PAGE_BG
p.outline_line_color = INK_SOFT

p.xaxis.axis_label_text_font_size = "42pt"
p.yaxis.axis_label_text_font_size = "42pt"
p.xaxis.major_label_text_font_size = "34pt"
p.yaxis.major_label_text_font_size = "34pt"
p.xaxis.axis_label_text_color = INK
p.yaxis.axis_label_text_color = INK
p.xaxis.major_label_text_color = INK_SOFT
p.yaxis.major_label_text_color = INK_SOFT
p.xaxis.axis_line_color = INK_SOFT
p.yaxis.axis_line_color = INK_SOFT
p.xaxis.major_tick_line_color = INK_SOFT
p.yaxis.major_tick_line_color = INK_SOFT

# Slightly more visible grid on the near-black dark basemap
grid_alpha = 0.06 if THEME == "light" else 0.09
p.xgrid.grid_line_color = INK
p.ygrid.grid_line_color = INK
p.xgrid.grid_line_alpha = grid_alpha
p.ygrid.grid_line_alpha = grid_alpha

# Legend
p.legend.location = "top_right"
p.legend.label_text_font_size = "34pt"
p.legend.background_fill_color = ELEVATED_BG
p.legend.border_line_color = INK_SOFT
p.legend.label_text_color = INK_SOFT

# Save HTML
output_file(f"plot-{THEME}.html")
save(p)

# Screenshot with headless Chrome (Selenium 4 / Selenium Manager)
opts = Options()
for arg in (
    "--headless=new",
    "--no-sandbox",
    "--disable-dev-shm-usage",
    "--disable-gpu",
    f"--window-size={W},{H}",
    "--hide-scrollbars",
):
    opts.add_argument(arg)
driver = webdriver.Chrome(options=opts)
driver.set_window_size(W, H)
driver.get(f"file://{Path(f'plot-{THEME}.html').resolve()}")
time.sleep(3)
# Capture full page (beyond visible viewport) to handle the ~139px viewport gap
result = driver.execute_cdp_cmd("Page.captureScreenshot", {"format": "png", "captureBeyondViewport": True})
with open(f"plot-{THEME}.png", "wb") as fh:
    fh.write(base64.b64decode(result["data"]))
driver.quit()
Runnable source as JSON, for any HTTP client: https://api.anyplot.ai/specs/map-route-path/bokeh/code. Any spec id and library id listed in llms-full.txt fit the same URL shape; every URL below is complete and callable.
{
  "spec_id": "map-route-path",
  "language": "python",
  "library": "bokeh",
  "page": "https://anyplot.ai/map-route-path/python/bokeh",
  "hub": "https://anyplot.ai/map-route-path",
  "code_json": "https://api.anyplot.ai/specs/map-route-path/bokeh/code",
  "spec_json": "https://api.anyplot.ai/specs/map-route-path",
  "render_light_png": "https://storage.googleapis.com/anyplot-images/plots/map-route-path/python/bokeh/plot-light.png",
  "render_dark_png": "https://storage.googleapis.com/anyplot-images/plots/map-route-path/python/bokeh/plot-dark.png",
  "interactive_light_html": "https://storage.googleapis.com/anyplot-images/plots/map-route-path/python/bokeh/plot-light.html",
  "interactive_dark_html": "https://storage.googleapis.com/anyplot-images/plots/map-route-path/python/bokeh/plot-dark.html",
  "quality_score": 90.0,
  "license": "MIT",
  "guide": "https://anyplot.ai/llms.txt"
}
Part of Route Path Map on anyplot.ai.