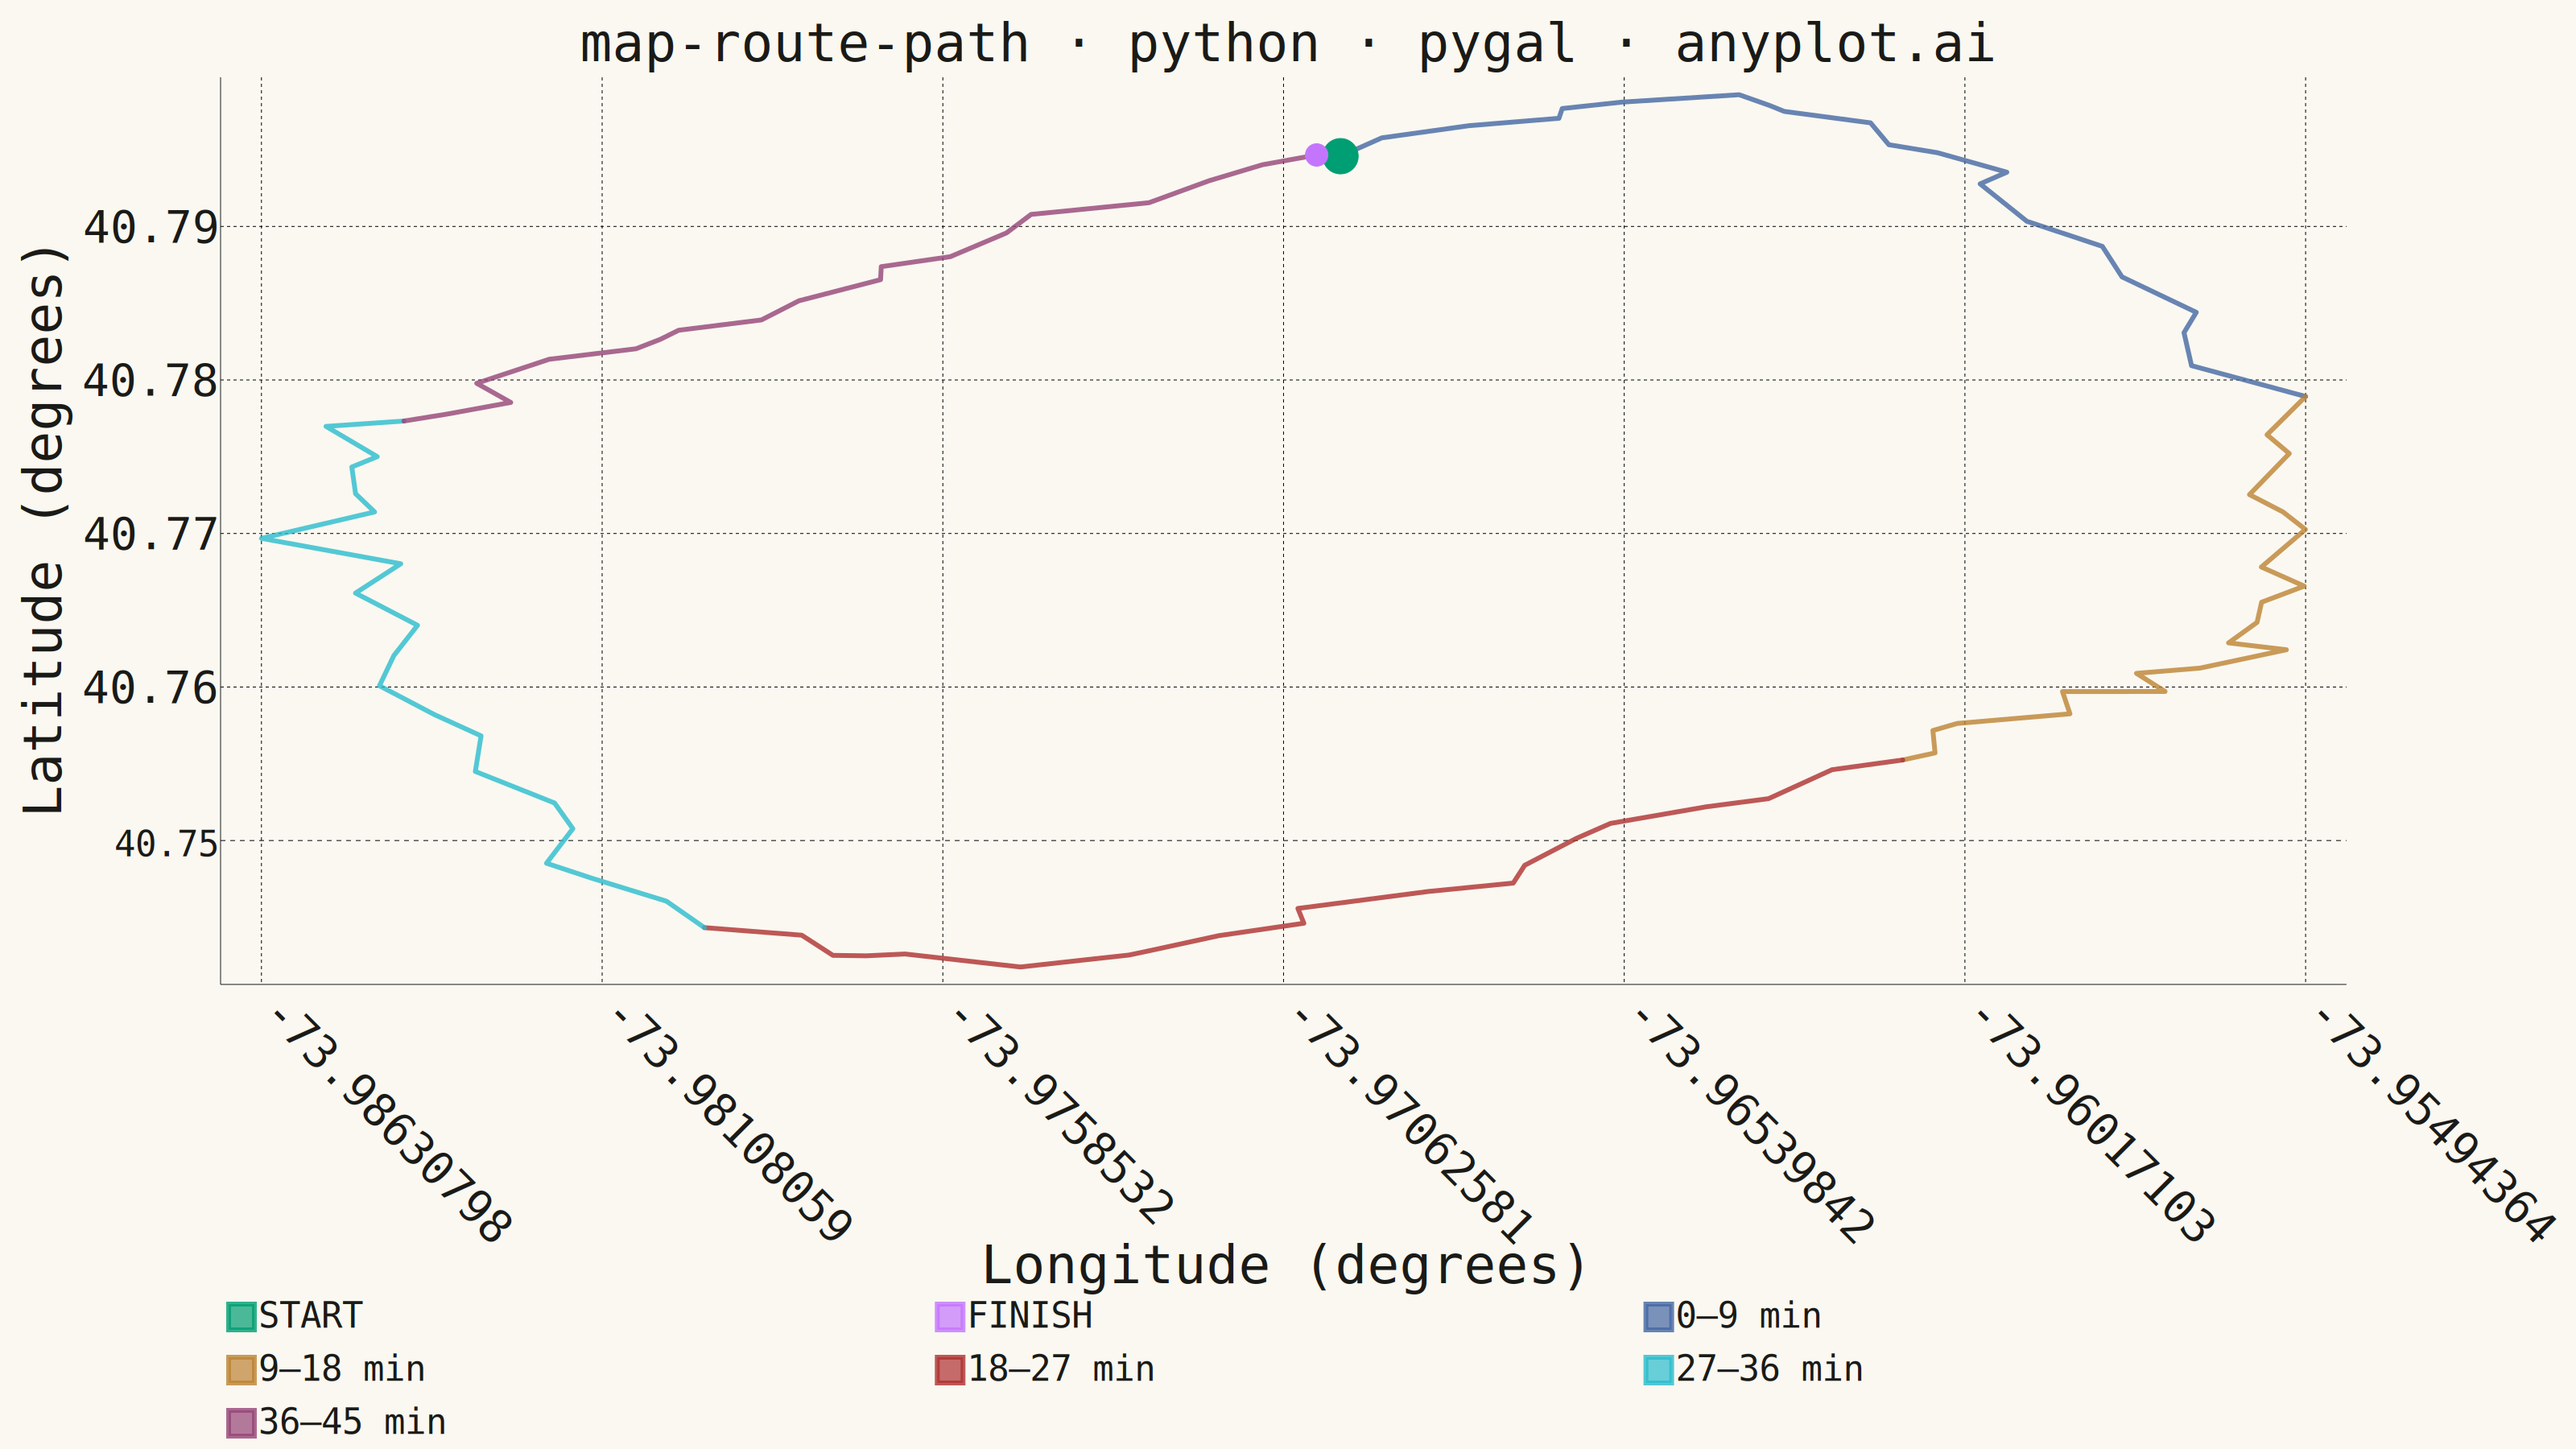
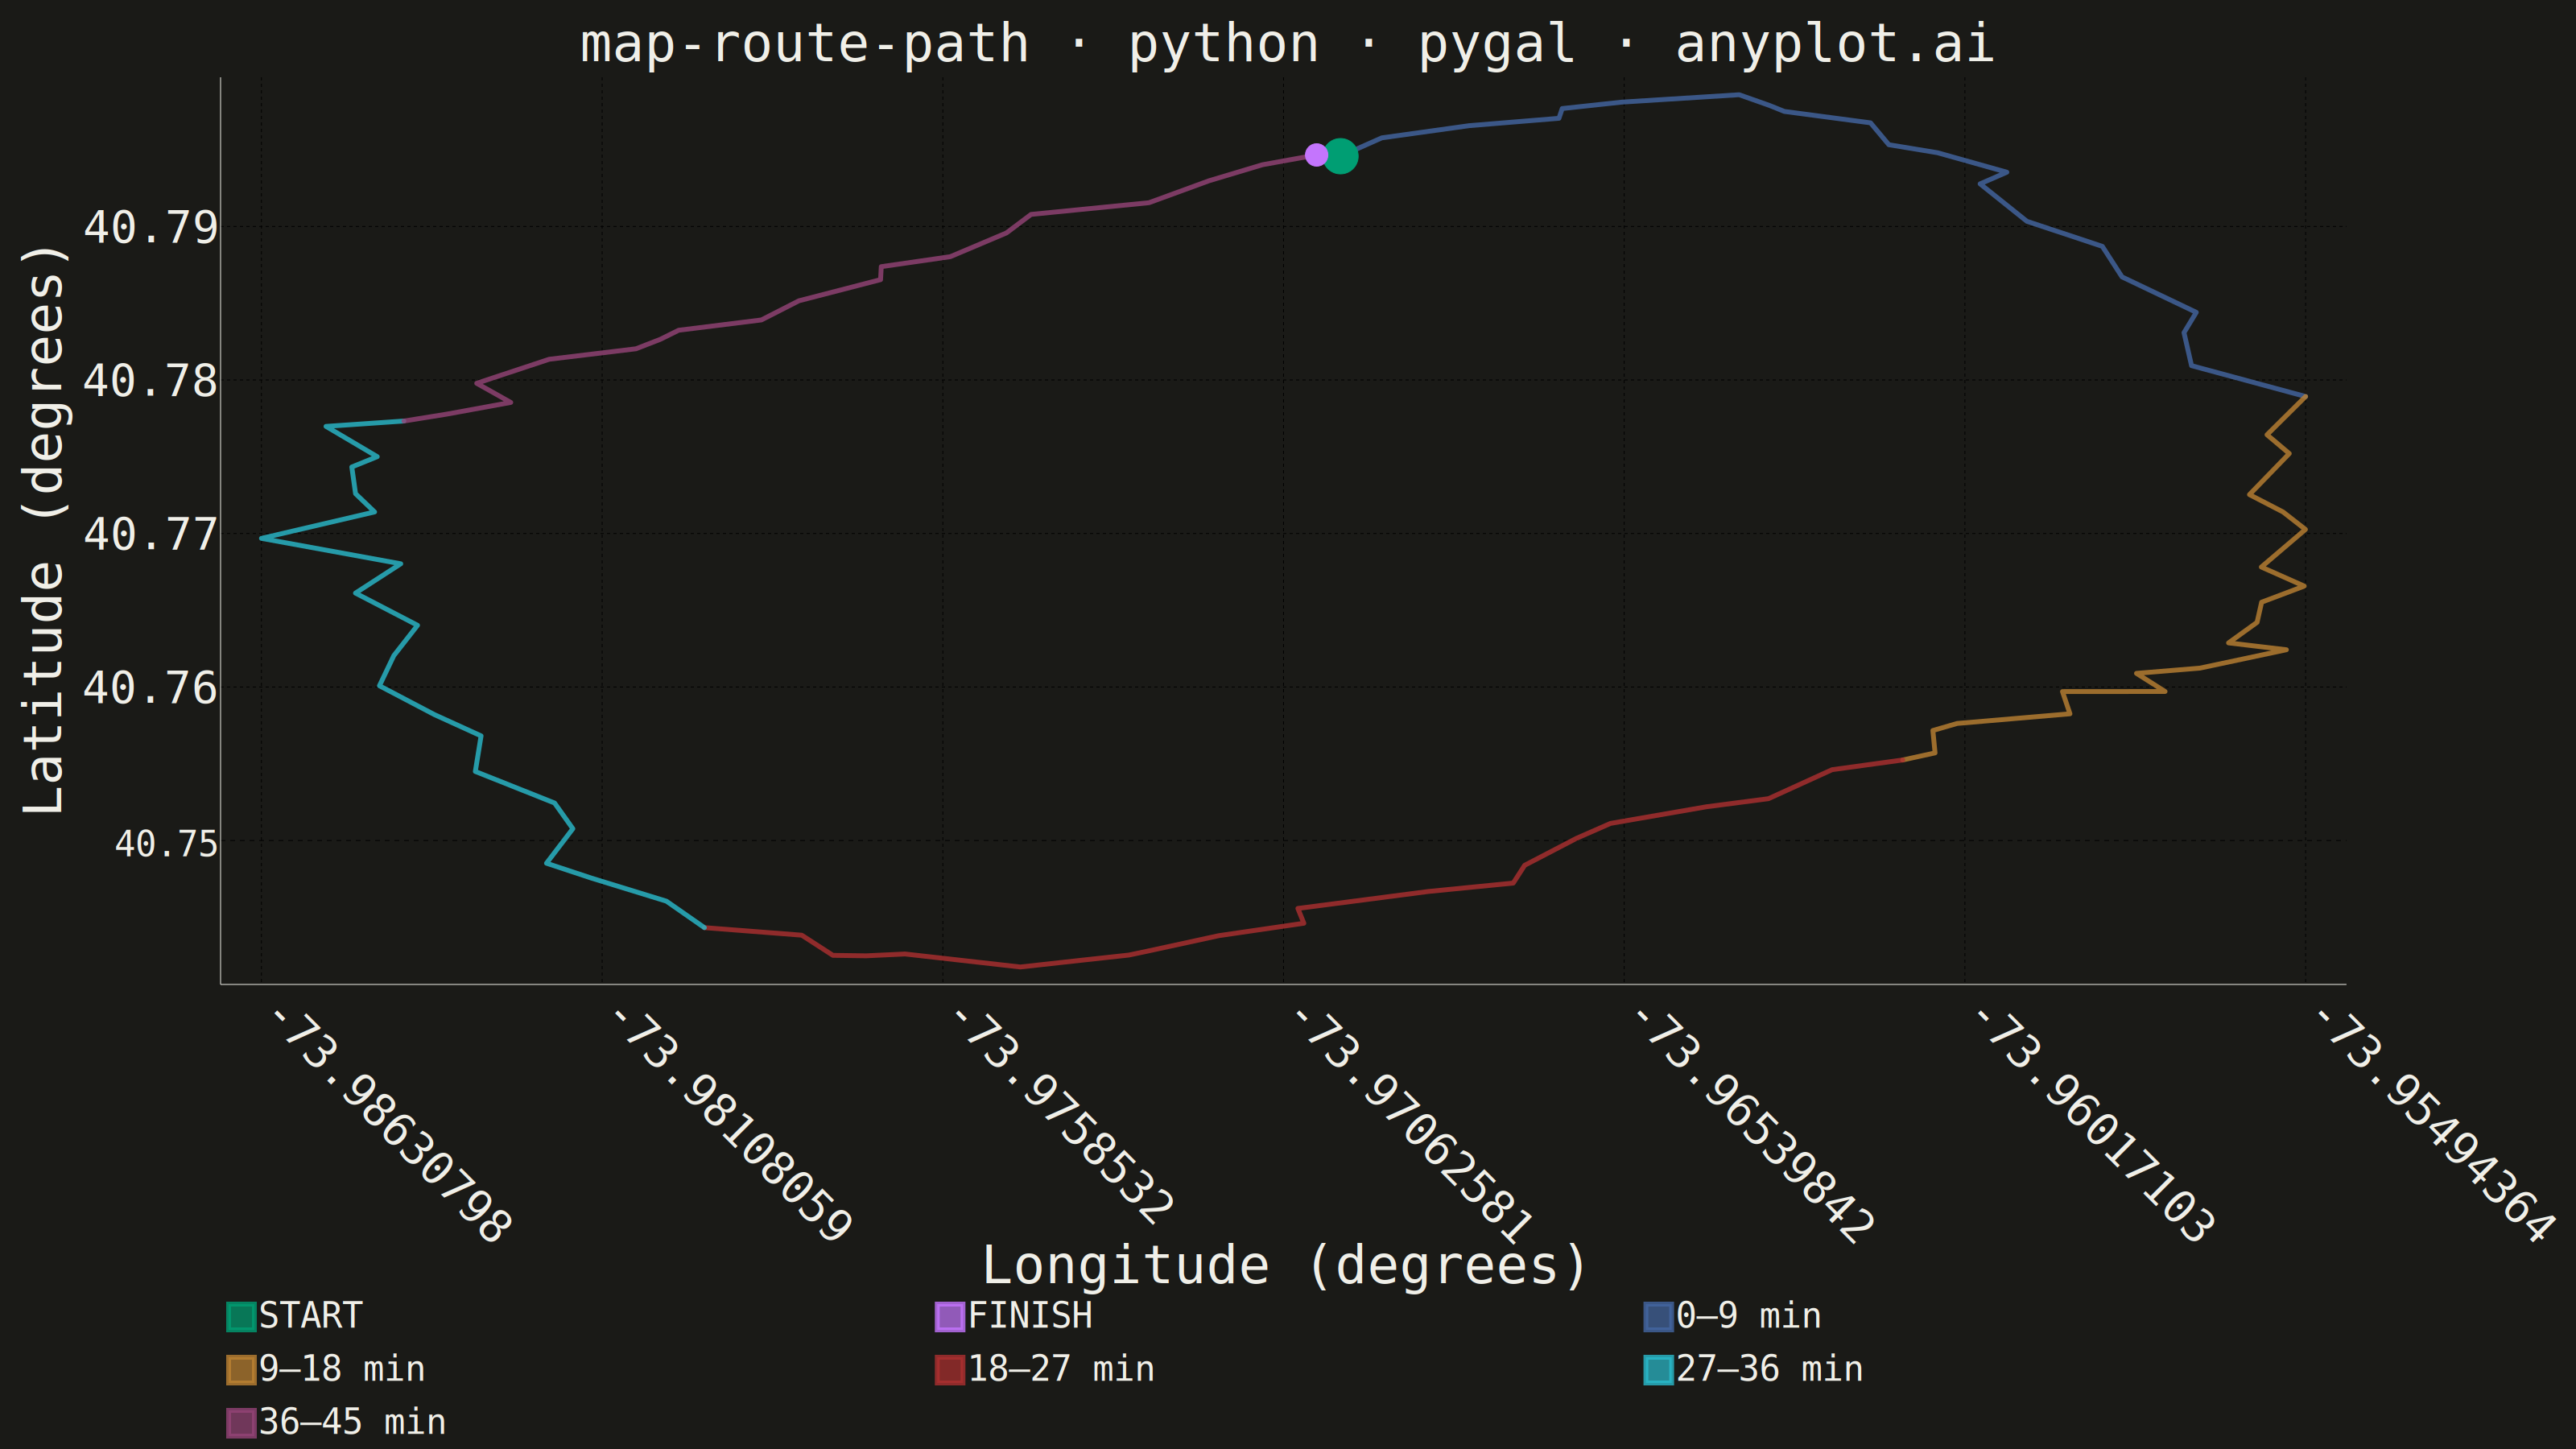
A geographic map visualization showing a connected path or route between sequential waypoints. Unlike scatter maps that display discrete points, this plot connects coordinates in order to reveal journeys, tracks, and navigation paths. Ideal for GPS data, delivery routes, and travel visualization where the sequence and continuity of movement matters.
""" anyplot.ai
map-route-path: Route Path Map
Library: pygal 3.1.0 | Python 3.13.13
Quality: 81/100 | Updated: 2026-05-21
"""

import os

import numpy as np
import pygal
from pygal.style import Style


# Theme tokens
THEME = os.getenv("ANYPLOT_THEME", "light")
PAGE_BG = "#FAF8F1" if THEME == "light" else "#1A1A17"
INK = "#1A1A17" if THEME == "light" else "#F0EFE8"
INK_MUTED = "#6B6A63" if THEME == "light" else "#A8A79F"

IMPRINT = ("#009E73", "#C475FD", "#4467A3", "#BD8233", "#AE3030", "#2ABCCD", "#954477")

# Data - Simulated hiking trail GPS track (Central Park loop, NYC)
np.random.seed(42)

n_points = 100
t = np.linspace(0, 2 * np.pi, n_points)

# Base path: elongated loop shape
base_lon = -73.97 + 0.015 * np.sin(t)
base_lat = 40.77 + 0.025 * np.cos(t) * (1 + 0.3 * np.sin(2 * t))

# Add small GPS noise for realism
lon = base_lon + np.random.normal(0, 0.0005, n_points)
lat = base_lat + np.random.normal(0, 0.0003, n_points)

# Elapsed-time label for each waypoint (45-minute hike, ~1 point per 27 s)
total_min = 45
timestamps = [f"{int(i * total_min / (n_points - 1)):02d}min" for i in range(n_points)]

# Style
custom_style = Style(
    background=PAGE_BG,
    plot_background=PAGE_BG,
    foreground=INK,
    foreground_strong=INK,
    foreground_subtle=INK_MUTED,
    colors=IMPRINT,
    title_font_size=66,
    label_font_size=56,
    major_label_font_size=44,
    legend_font_size=44,
    value_font_size=36,
    stroke_width=6,
)

# Chart — XY chart maps longitude/latitude as Cartesian coordinates;
# truncate_label=-1 prevents pygal from auto-truncating axis tick labels,
# x_label_rotation=45 gives each label room to render in full
chart = pygal.XY(
    width=3200,
    height=1800,
    style=custom_style,
    title="map-route-path · python · pygal · anyplot.ai",
    x_title="Longitude (degrees)",
    y_title="Latitude (degrees)",
    show_dots=False,
    stroke_style={"width": 6, "linecap": "round", "linejoin": "round"},
    show_x_guides=True,
    show_y_guides=True,
    legend_at_bottom=True,
    legend_box_size=32,
    truncate_legend=-1,
    truncate_label=-1,
    x_label_rotation=45,
    value_formatter=lambda v: f"Lon {v[0]:.4f}°, Lat {v[1]:.4f}°" if isinstance(v, (tuple, list)) else str(v),
)

# Explicit sparse x-axis tick positions — 7 values avoids density-driven truncation
chart.x_labels = np.linspace(lon.min(), lon.max(), 7).tolist()

# START marker — brand green (Okabe-Ito pos 1), oversized dot for visual prominence
chart.add(
    "START",
    [{"value": (float(lon[0]), float(lat[0])), "label": f"Trail head — {timestamps[0]}"}],
    dots_size=22,
    stroke=False,
    show_dots=True,
)

# FINISH marker — vermillion (Okabe-Ito pos 2), medium dot clearly smaller than START
chart.add(
    "FINISH",
    [{"value": (float(lon[-1]), float(lat[-1])), "label": f"Trail end — {timestamps[-1]}"}],
    dots_size=14,
    stroke=False,
    show_dots=True,
)

# Route segments — time-progression color (Okabe-Ito positions 3–7)
# Stroke width follows a bell curve to suggest pace variation: slower at start/end,
# peak effort in the middle third of the hike
n_segments = 5
segment_size = n_points // n_segments
seg_labels = ["0–9 min", "9–18 min", "18–27 min", "27–36 min", "36–45 min"]
seg_widths = [5, 6, 8, 6, 5]

for i in range(n_segments):
    start_idx = i * segment_size
    end_idx = min((i + 1) * segment_size + 1, n_points)
    segment_data = [
        {"value": (float(lon[j]), float(lat[j])), "label": f"Waypoint {j + 1} at {timestamps[j]}"}
        for j in range(start_idx, end_idx)
    ]
    chart.add(
        seg_labels[i], segment_data, stroke_style={"width": seg_widths[i], "linecap": "round", "linejoin": "round"}
    )

# Save
chart.render_to_png(f"plot-{THEME}.png")
with open(f"plot-{THEME}.html", "wb") as f:
    f.write(chart.render())
Runnable source as JSON, for any HTTP client: https://api.anyplot.ai/specs/map-route-path/pygal/code. Any spec id and library id listed in llms-full.txt fit the same URL shape; every URL below is complete and callable.
{
  "spec_id": "map-route-path",
  "language": "python",
  "library": "pygal",
  "page": "https://anyplot.ai/map-route-path/python/pygal",
  "hub": "https://anyplot.ai/map-route-path",
  "code_json": "https://api.anyplot.ai/specs/map-route-path/pygal/code",
  "spec_json": "https://api.anyplot.ai/specs/map-route-path",
  "render_light_png": "https://storage.googleapis.com/anyplot-images/plots/map-route-path/python/pygal/plot-light.png",
  "render_dark_png": "https://storage.googleapis.com/anyplot-images/plots/map-route-path/python/pygal/plot-dark.png",
  "interactive_light_html": "https://storage.googleapis.com/anyplot-images/plots/map-route-path/python/pygal/plot-light.html",
  "interactive_dark_html": "https://storage.googleapis.com/anyplot-images/plots/map-route-path/python/pygal/plot-dark.html",
  "quality_score": 81.0,
  "license": "MIT",
  "guide": "https://anyplot.ai/llms.txt"
}
Part of Route Path Map on anyplot.ai.