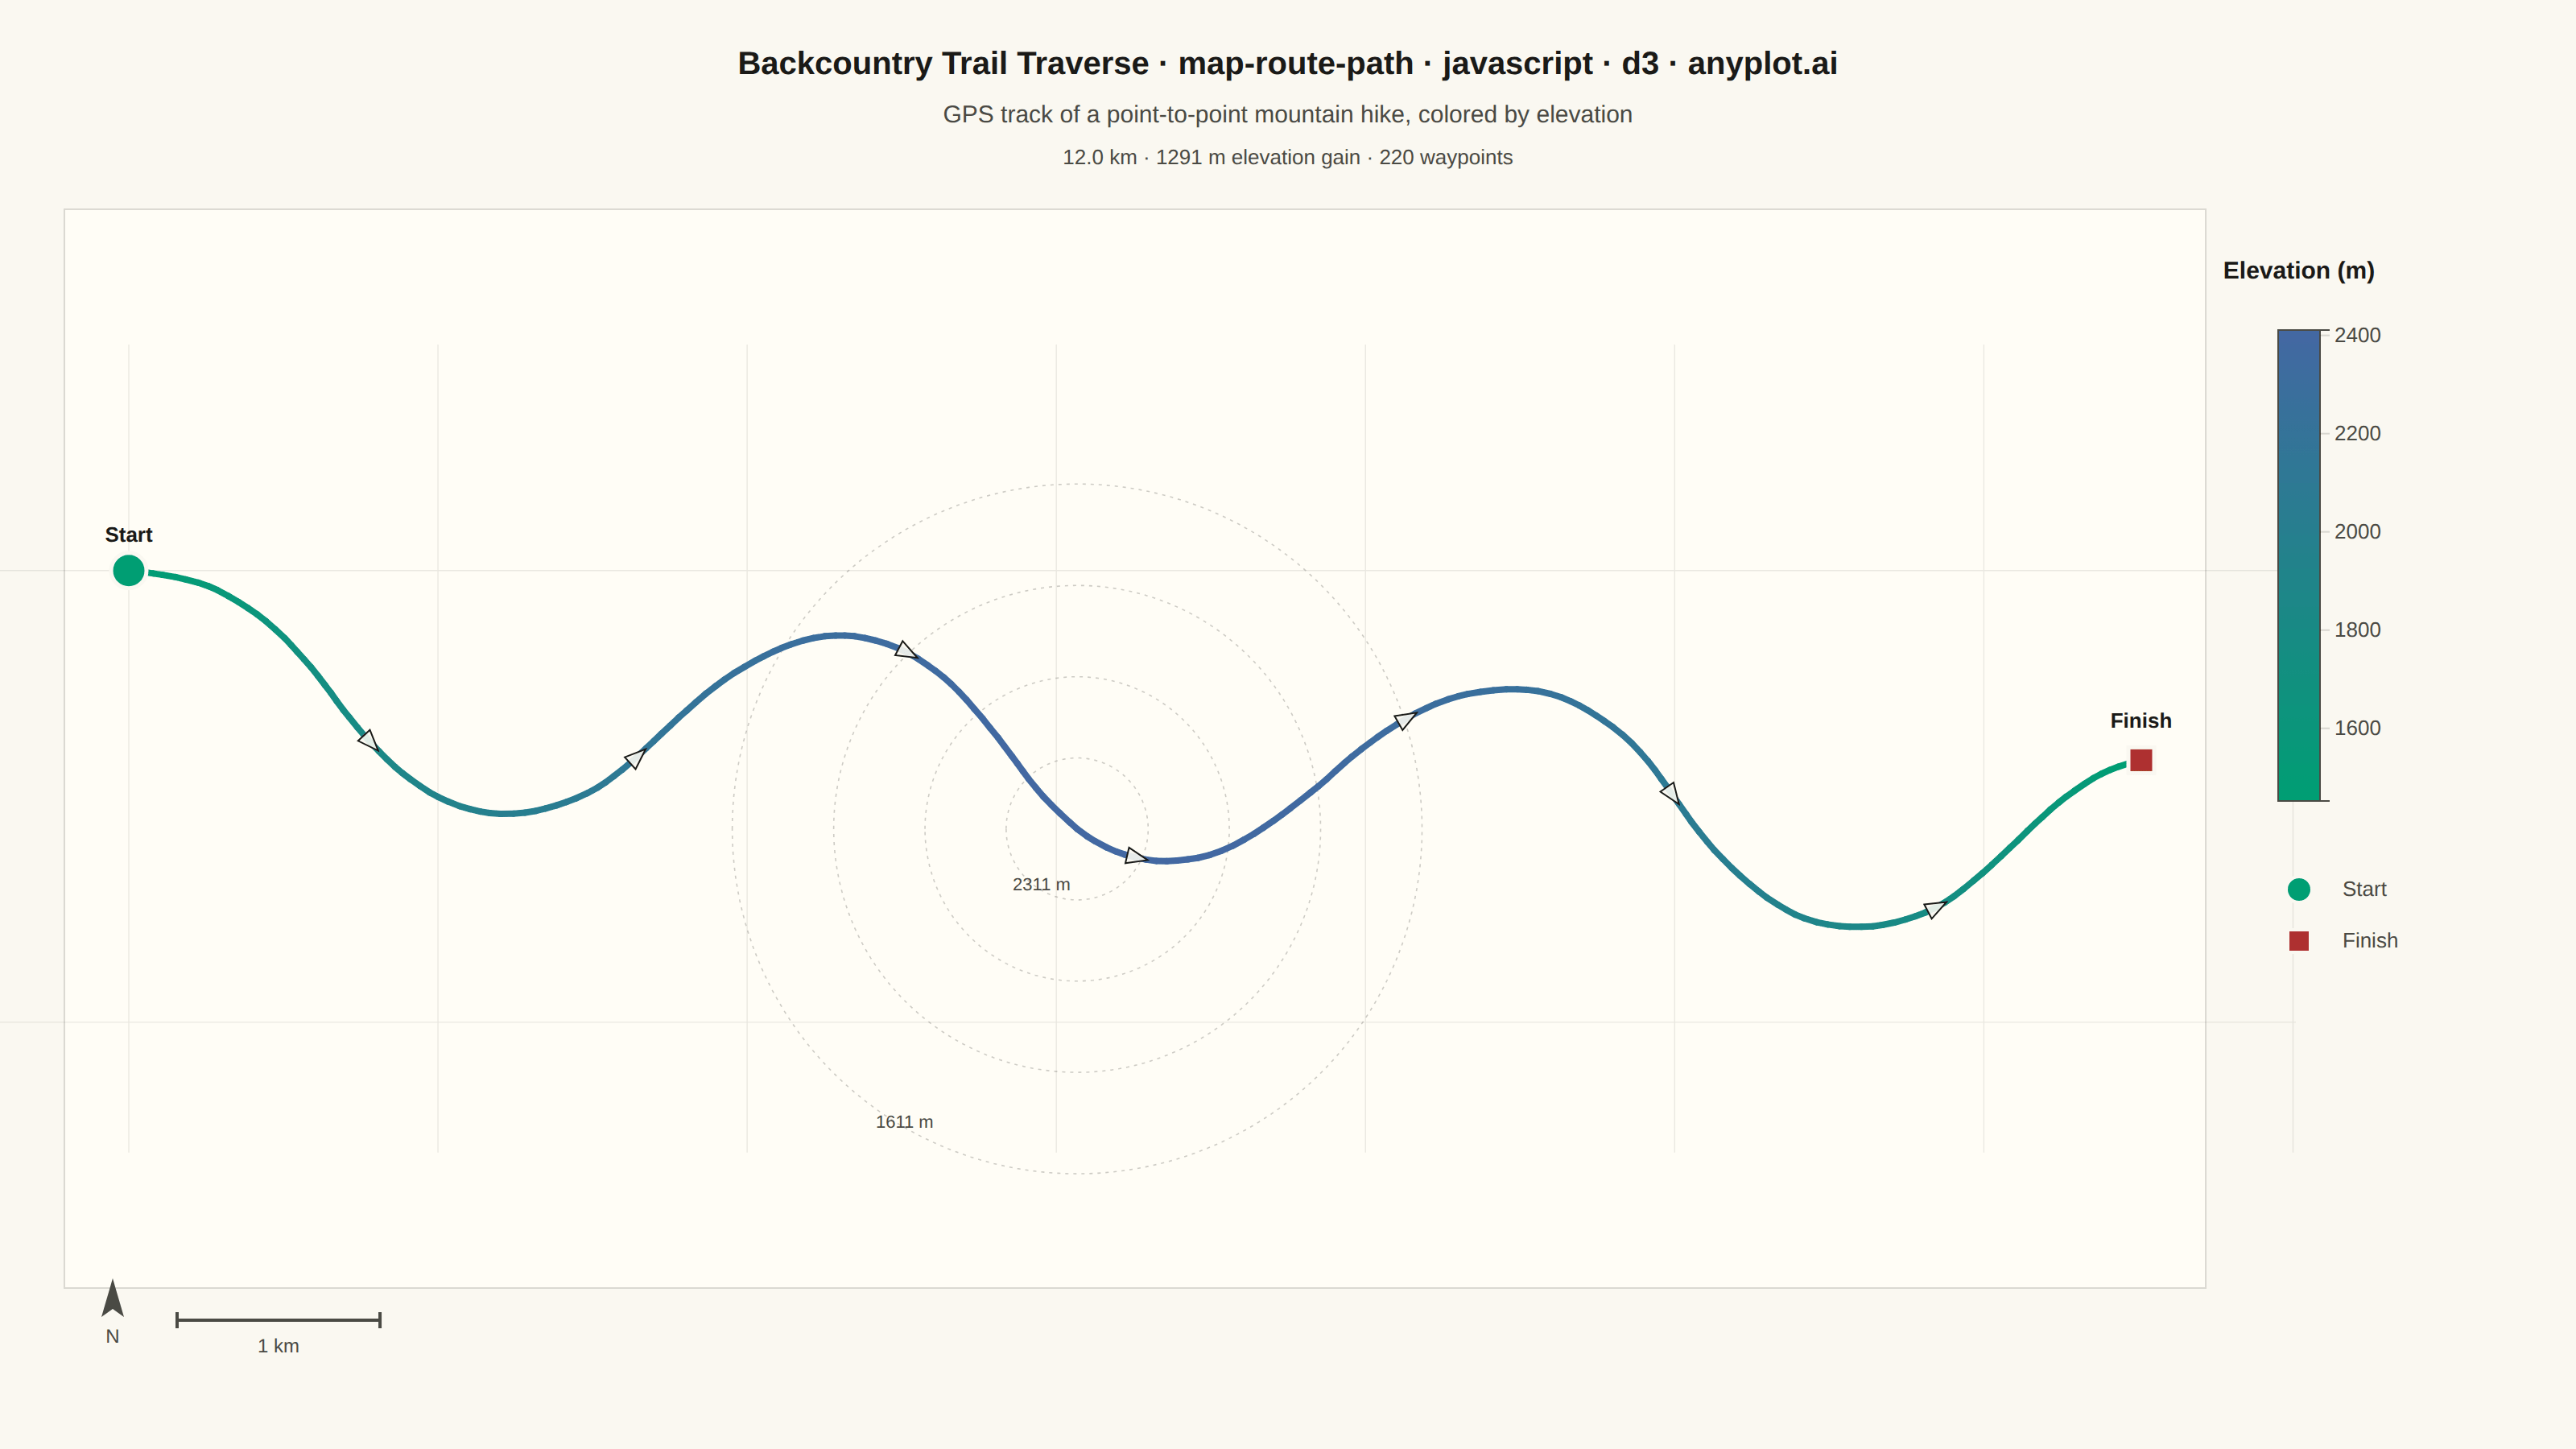
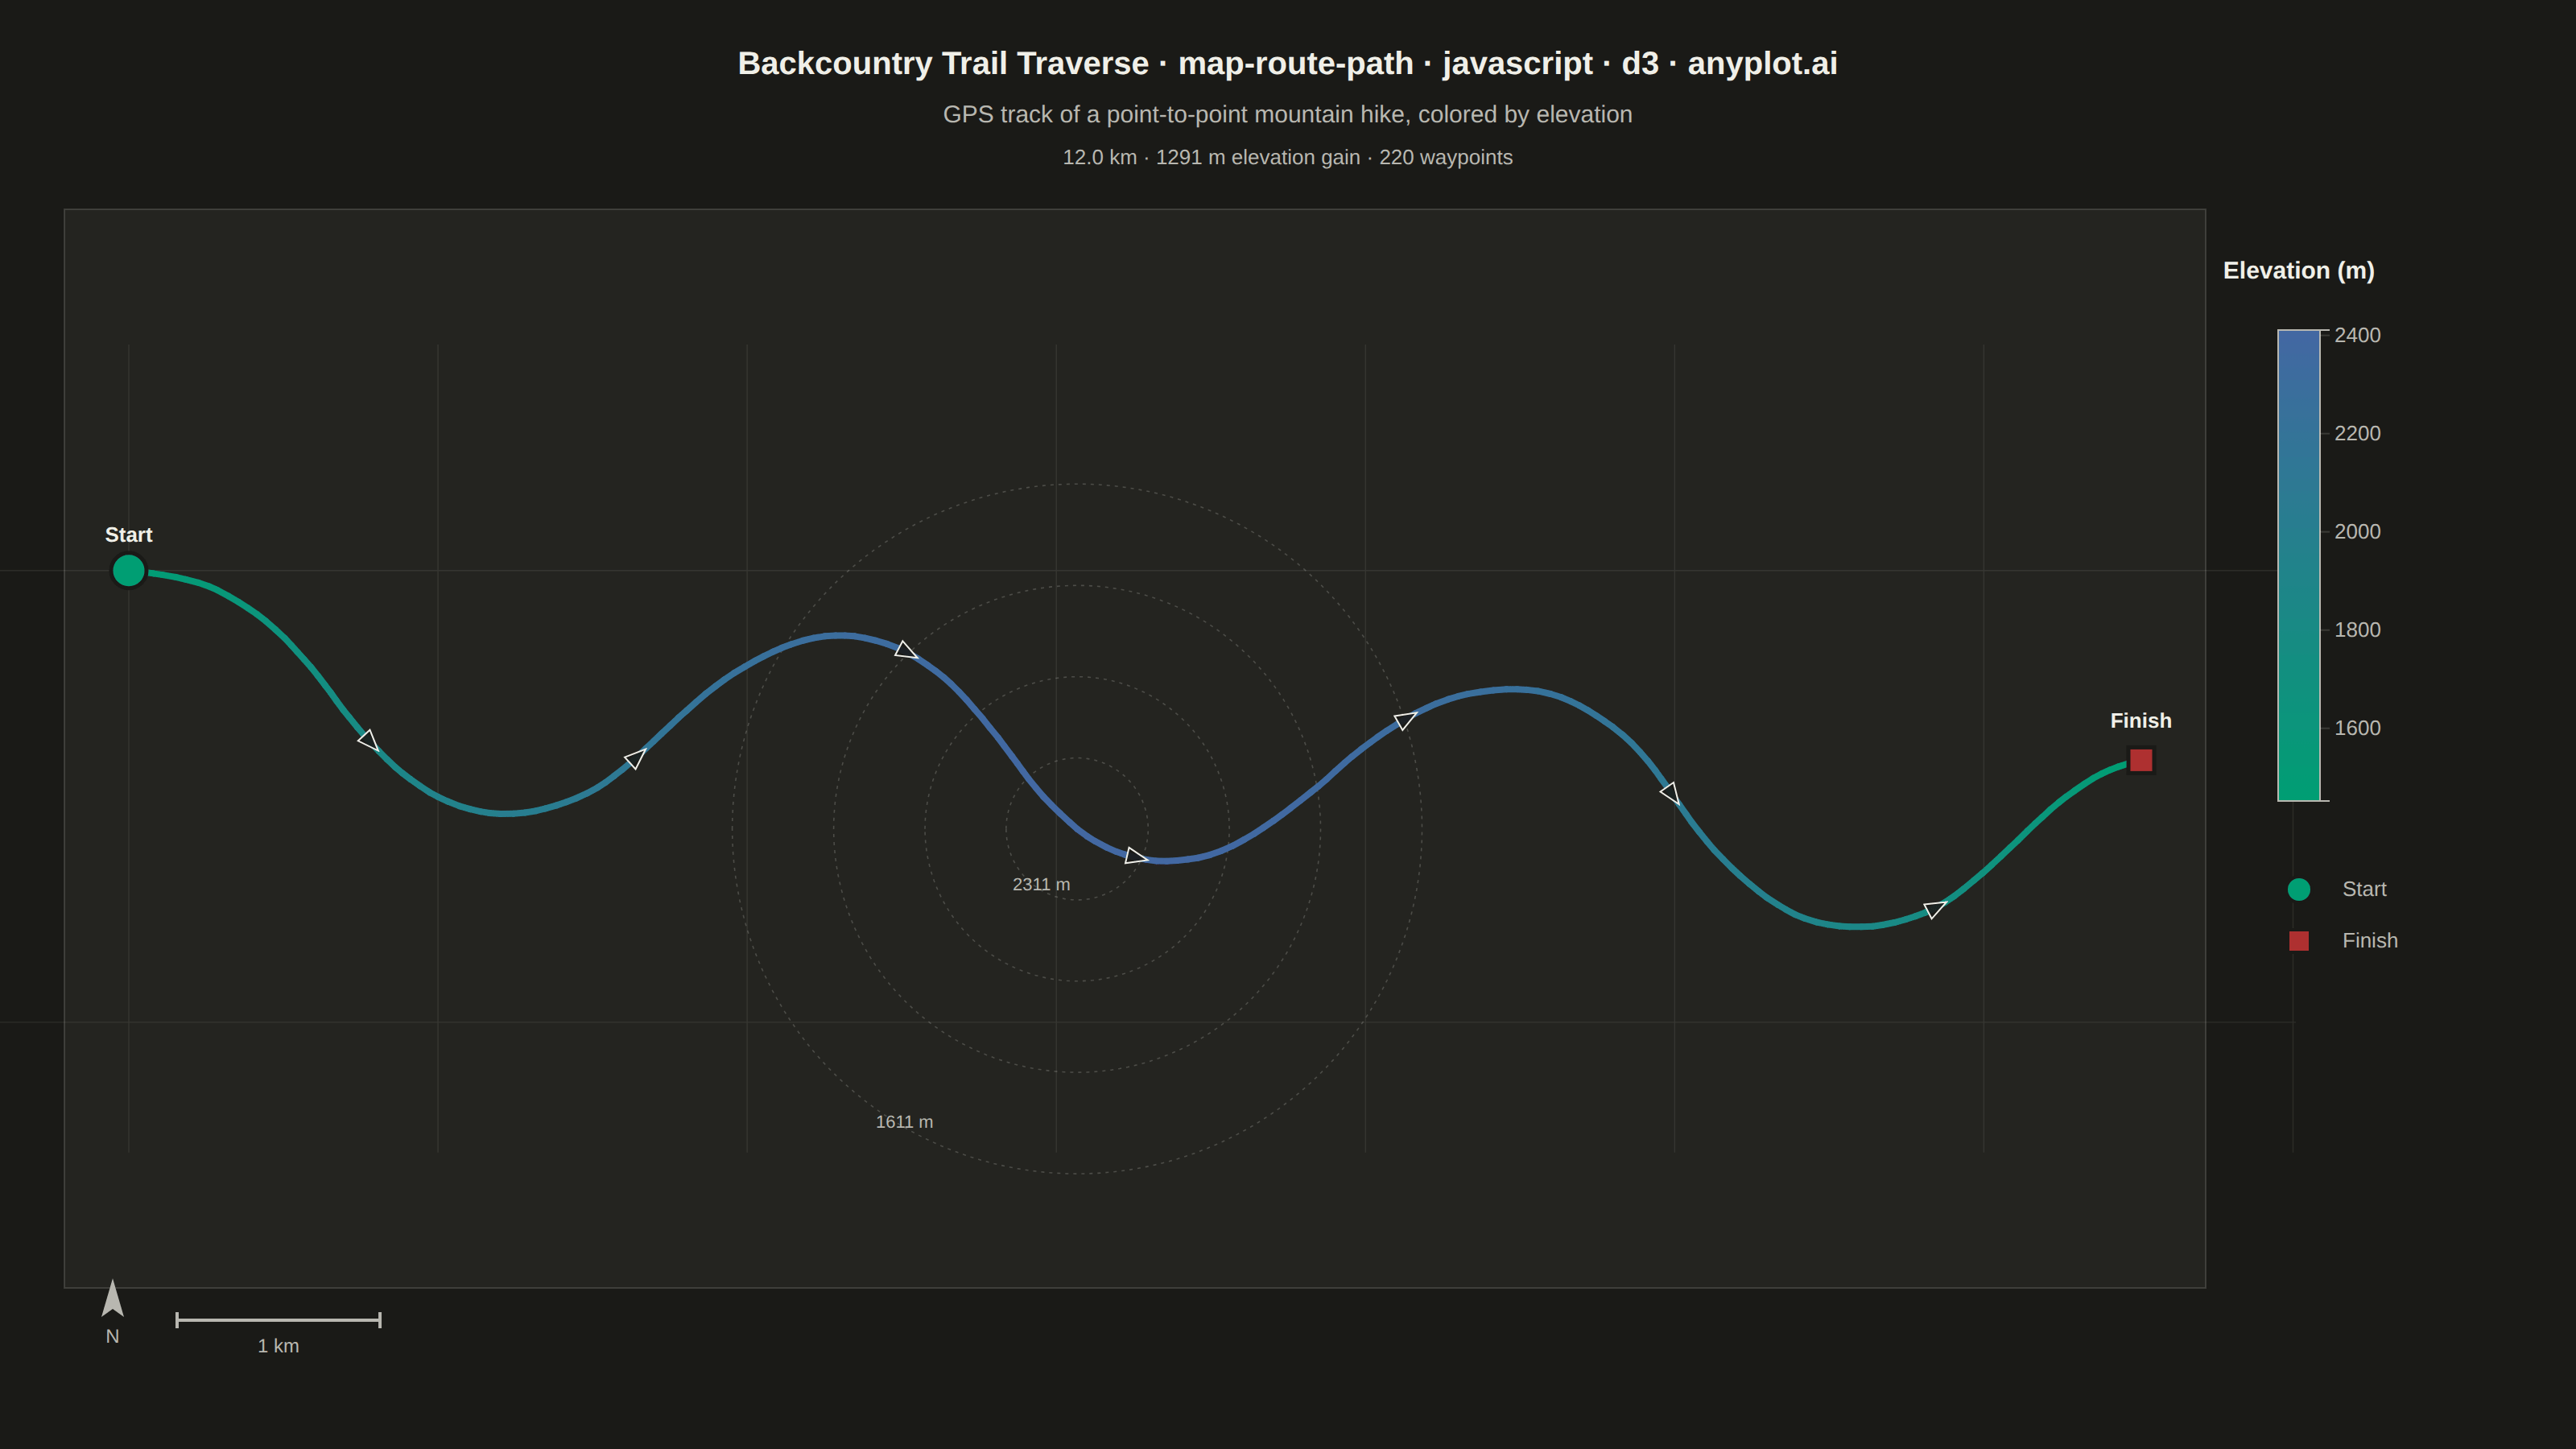
The same plot in 14 other libraries — JavaScript: Chart.js, Apache ECharts, Highcharts, MUI X Charts; Python: Altair, Bokeh, lets-plot, Matplotlib, Plotly, plotnine, Pygal, Seaborn; R: ggplot2; Julia: Makie.jl. Compare all 15 side by side: Route Path Map in Python, R, Julia and JavaScript.
A geographic map visualization showing a connected path or route between sequential waypoints. Unlike scatter maps that display discrete points, this plot connects coordinates in order to reveal journeys, tracks, and navigation paths. Ideal for GPS data, delivery routes, and travel visualization where the sequence and continuity of movement matters.
// anyplot.ai
// map-route-path: Route Path Map
// Library: d3 7.9.0 | JavaScript 22.23.2
// Quality: 91/100 | Created: 2026-09-02

const t = window.ANYPLOT_TOKENS;
const { width, height } = window.ANYPLOT_SIZE;

// --- Data: deterministic mountain-trail GPS track ---------------------------
// Small linear-congruential generator so the waypoint wander is reproducible
// (the browser has no seeded RNG).
let seed = 42;
function rand() {
  seed = (seed * 1103515245 + 12345) & 0x7fffffff;
  return seed / 0x7fffffff;
}

const n = 220;
const waypoints = [];
let lat = 46.82;
let lon = -121.58;
let heading = 95; // degrees from north — overall eastbound traverse through the pass
for (let i = 0; i < n; i++) {
  const progress = i / (n - 1);
  if (i > 0) {
    // Switchback climb: the target bearing oscillates north/south of due
    // east so the trail zigzags up the pass (realistic for a mountain
    // trail, and it fills the canvas — a near-straight bearing leaves the
    // north/south half of the map empty).
    const targetHeading = 95 + 55 * Math.sin(progress * Math.PI * 6);
    heading += (targetHeading - heading) * 0.15 + (rand() - 0.5) * 4;
    const stepM = 45 + rand() * 20; // meters between consecutive GPS fixes
    lat += (stepM * Math.cos((heading * Math.PI) / 180)) / 111320;
    lon += (stepM * Math.sin((heading * Math.PI) / 180)) / (111320 * Math.cos((lat * Math.PI) / 180));
  }
  // Single climb-then-descend profile: trailhead -> pass -> different trailhead
  const elevation = 1450 + 950 * Math.sin(Math.PI * progress) + (rand() - 0.5) * 25;
  waypoints.push({ sequence: i, lat, lon, elevation });
}

function haversineM(a, b) {
  const R = 6371000;
  const rad = Math.PI / 180;
  const dLat = (b.lat - a.lat) * rad;
  const dLon = (b.lon - a.lon) * rad;
  const s = Math.sin(dLat / 2) ** 2 + Math.cos(a.lat * rad) * Math.cos(b.lat * rad) * Math.sin(dLon / 2) ** 2;
  return 2 * R * Math.asin(Math.sqrt(s));
}
let totalDistanceM = 0;
let elevationGainM = 0;
for (let i = 1; i < waypoints.length; i++) {
  totalDistanceM += haversineM(waypoints[i - 1], waypoints[i]);
  const delta = waypoints[i].elevation - waypoints[i - 1].elevation;
  if (delta > 0) elevationGainM += delta;
}
const totalDistanceKm = totalDistanceM / 1000;
const peak = waypoints.reduce((a, b) => (b.elevation > a.elevation ? b : a));
const elevExtent = d3.extent(waypoints, (d) => d.elevation);
const elevColor = d3.scaleSequential(d3.interpolateRgbBasis(t.seq)).domain(elevExtent);

// --- Layout ------------------------------------------------------------
const margin = { top: 140, right: 240, bottom: 110, left: 50 };
const mapW = width - margin.left - margin.right;
const mapH = height - margin.top - margin.bottom;

// --- Projection: local Mercator fit to the track's bounding box ------------
const routeLine = { type: "LineString", coordinates: waypoints.map((d) => [d.lon, d.lat]) };
const projection = d3.geoMercator().fitExtent(
  [
    [30, 30],
    [mapW - 30, mapH - 30],
  ],
  routeLine,
);
const path = d3.geoPath(projection);

const lonExtent = d3.extent(waypoints, (d) => d.lon);
const latExtent = d3.extent(waypoints, (d) => d.lat);
const pad = 0.01;
const graticule = d3
  .geoGraticule()
  .extent([
    [lonExtent[0] - pad, latExtent[0] - pad],
    [lonExtent[1] + pad, latExtent[1] + pad],
  ])
  .step([0.02, 0.02]);

// --- SVG mount -----------------------------------------------------------
const svg = d3.select("#container").append("svg").attr("width", width).attr("height", height);
const g = svg.append("g").attr("transform", `translate(${margin.left},${margin.top})`);
const mapG = g.append("g");

// Map panel — delineates the geographic frame the route sits in
mapG
  .append("rect")
  .attr("x", -10)
  .attr("y", -10)
  .attr("width", mapW + 20)
  .attr("height", mapH + 20)
  .attr("fill", t.elevatedBg)
  .attr("stroke", t.grid)
  .attr("stroke-width", 1);

// Lon/lat graticule — geographic reference grid for spatial context
mapG
  .append("path")
  .datum(graticule)
  .attr("d", path)
  .attr("fill", "none")
  .attr("stroke", t.grid)
  .attr("stroke-width", 0.7)
  .attr("stroke-opacity", 0.6);

// Elevation contour rings around the pass — abstract topographic context
// derived from the same elevation model as the route color (not real survey
// data), drawn as true great-circle rings via d3.geoCircle so they stay
// undistorted under the Mercator projection.
const contourLevels = [
  { elevM: peak.elevation - 100, radiusKm: 0.35 },
  { elevM: peak.elevation - 300, radiusKm: 0.75 },
  { elevM: peak.elevation - 550, radiusKm: 1.2 },
  { elevM: peak.elevation - 800, radiusKm: 1.7 },
];
for (const c of contourLevels) {
  const ring = d3
    .geoCircle()
    .center([peak.lon, peak.lat])
    .radius(c.radiusKm / 111.32)();
  mapG
    .append("path")
    .datum(ring)
    .attr("d", path)
    .attr("fill", "none")
    .attr("stroke", t.inkSoft)
    .attr("stroke-width", 0.8)
    .attr("stroke-opacity", 0.28)
    .attr("stroke-dasharray", "2,3");
}
// Label a couple of rings off to the southwest — away from the eastbound
// route line so the numbers don't sit on top of the path or the arrows.
const labelBearing = (210 * Math.PI) / 180;
for (const c of [contourLevels[0], contourLevels[3]]) {
  const labelLon = peak.lon + ((c.radiusKm / 111.32) * Math.sin(labelBearing)) / Math.cos((peak.lat * Math.PI) / 180);
  const labelLat = peak.lat + (c.radiusKm / 111.32) * Math.cos(labelBearing);
  const [lx, ly] = projection([labelLon, labelLat]);
  mapG
    .append("text")
    .attr("x", lx)
    .attr("y", ly)
    .attr("text-anchor", "middle")
    .attr("fill", t.inkSoft)
    .style("font-size", "11px")
    .text(`${Math.round(c.elevM)} m`);
}

// Route — consecutive segments colored by midpoint elevation
const segments = [];
for (let i = 0; i < waypoints.length - 1; i++) {
  segments.push({
    line: {
      type: "LineString",
      coordinates: [
        [waypoints[i].lon, waypoints[i].lat],
        [waypoints[i + 1].lon, waypoints[i + 1].lat],
      ],
    },
    elevation: (waypoints[i].elevation + waypoints[i + 1].elevation) / 2,
  });
}
mapG
  .selectAll("path.route-segment")
  .data(segments)
  .join("path")
  .attr("class", "route-segment")
  .attr("d", (d) => path(d.line))
  .attr("fill", "none")
  .attr("stroke", (d) => elevColor(d.elevation))
  .attr("stroke-width", 4)
  .attr("stroke-linecap", "round")
  .attr("stroke-linejoin", "round");

// Direction arrows — travel-direction indicators along the path (static, not
// simulated interactivity: each arrow is a fixed triangle oriented to the
// local tangent).
const arrowStep = 28;
const arrows = [];
for (let i = arrowStep; i < waypoints.length - 4; i += arrowStep) {
  const p0 = projection([waypoints[i - 2].lon, waypoints[i - 2].lat]);
  const p1 = projection([waypoints[i + 2].lon, waypoints[i + 2].lat]);
  const mid = projection([waypoints[i].lon, waypoints[i].lat]);
  arrows.push({ x: mid[0], y: mid[1], angle: (Math.atan2(p1[1] - p0[1], p1[0] - p0[0]) * 180) / Math.PI });
}
mapG
  .selectAll("path.arrow")
  .data(arrows)
  .join("path")
  .attr("class", "arrow")
  .attr("d", "M -6,-5 L 7,0 L -6,5 Z")
  .attr("transform", (d) => `translate(${d.x},${d.y}) rotate(${d.angle})`)
  .attr("fill", t.pageBg)
  .attr("stroke", t.ink)
  .attr("stroke-width", 1)
  .attr("fill-opacity", 0.9);

// Start (brand green circle) / finish (matte red square) endpoints
const startPt = projection([waypoints[0].lon, waypoints[0].lat]);
const endPt = projection([waypoints[waypoints.length - 1].lon, waypoints[waypoints.length - 1].lat]);

mapG
  .append("circle")
  .attr("cx", startPt[0])
  .attr("cy", startPt[1])
  .attr("r", 11)
  .attr("fill", t.palette[0])
  .attr("stroke", t.pageBg)
  .attr("stroke-width", 2.5);
mapG
  .append("text")
  .attr("x", startPt[0])
  .attr("y", startPt[1] - 18)
  .attr("text-anchor", "middle")
  .attr("fill", t.ink)
  .style("font-size", "13px")
  .style("font-weight", "600")
  .text("Start");

const endSize = 16;
mapG
  .append("rect")
  .attr("x", endPt[0] - endSize / 2)
  .attr("y", endPt[1] - endSize / 2)
  .attr("width", endSize)
  .attr("height", endSize)
  .attr("fill", t.palette[4])
  .attr("stroke", t.pageBg)
  .attr("stroke-width", 2.5);
mapG
  .append("text")
  .attr("x", endPt[0])
  .attr("y", endPt[1] - 20)
  .attr("text-anchor", "middle")
  .attr("fill", t.ink)
  .style("font-size", "13px")
  .style("font-weight", "600")
  .text("Finish");

// North arrow + distance scale bar
const chromeY = mapH + 30;
mapG
  .append("path")
  .attr("d", "M 0,-16 L 7,8 L 0,3 L -7,8 Z")
  .attr("transform", `translate(20,${chromeY - 10})`)
  .attr("fill", t.inkSoft);
mapG
  .append("text")
  .attr("x", 20)
  .attr("y", chromeY + 14)
  .attr("text-anchor", "middle")
  .attr("fill", t.inkSoft)
  .style("font-size", "12px")
  .text("N");

const meanLat = d3.mean(waypoints, (d) => d.lat);
const meanLon = d3.mean(waypoints, (d) => d.lon);
const degPerKm = 1000 / (111320 * Math.cos((meanLat * Math.PI) / 180));
const [sx0] = projection([meanLon, meanLat]);
const [sx1] = projection([meanLon + degPerKm, meanLat]);
const scaleBarPx = Math.abs(sx1 - sx0);
const scaleX = 60;
mapG
  .append("line")
  .attr("x1", scaleX)
  .attr("x2", scaleX + scaleBarPx)
  .attr("y1", chromeY)
  .attr("y2", chromeY)
  .attr("stroke", t.inkSoft)
  .attr("stroke-width", 2);
for (const x of [scaleX, scaleX + scaleBarPx]) {
  mapG
    .append("line")
    .attr("x1", x)
    .attr("x2", x)
    .attr("y1", chromeY - 5)
    .attr("y2", chromeY + 5)
    .attr("stroke", t.inkSoft)
    .attr("stroke-width", 2);
}
mapG
  .append("text")
  .attr("x", scaleX + scaleBarPx / 2)
  .attr("y", chromeY + 20)
  .attr("text-anchor", "middle")
  .attr("fill", t.inkSoft)
  .style("font-size", "12px")
  .text("1 km");

// --- Legend: elevation gradient + endpoint markers --------------------------
const legendW = 26;
const legendH = mapH * 0.45;
const legendX = mapW + 55;
const legendY = mapH * 0.06;
const nStops = 10;

svg
  .append("defs")
  .append("linearGradient")
  .attr("id", "elev-gradient")
  .attr("x1", "0%")
  .attr("y1", "100%")
  .attr("x2", "0%")
  .attr("y2", "0%")
  .selectAll("stop")
  .data(d3.range(nStops + 1))
  .join("stop")
  .attr("offset", (d) => `${(d / nStops) * 100}%`)
  .attr("stop-color", (d) => elevColor(elevExtent[0] + (d / nStops) * (elevExtent[1] - elevExtent[0])));

const legendG = g.append("g").attr("transform", `translate(${legendX},${legendY})`);
const legendTop = 26;
legendG
  .append("rect")
  .attr("y", legendTop)
  .attr("width", legendW)
  .attr("height", legendH)
  .attr("fill", "url(#elev-gradient)")
  .attr("stroke", t.inkSoft)
  .attr("stroke-width", 1);

const legendScale = d3.scaleLinear().domain(elevExtent).range([legendH + legendTop, legendTop]);
const legendAxis = d3
  .axisRight(legendScale)
  .ticks(5)
  .tickFormat((d) => `${Math.round(d)}`);
const legendAxisG = legendG.append("g").attr("transform", `translate(${legendW},0)`).call(legendAxis);
legendAxisG.selectAll("text").attr("fill", t.inkSoft).style("font-size", "13px");
legendAxisG.selectAll("line").attr("stroke", t.grid);
legendAxisG.select(".domain").attr("stroke", t.inkSoft);

legendG
  .append("text")
  .attr("x", legendW / 2)
  .attr("y", -6)
  .attr("text-anchor", "middle")
  .attr("fill", t.ink)
  .style("font-size", "15px")
  .style("font-weight", "600")
  .text("Elevation (m)");

const startLegendY = legendTop + legendH + 55;
legendG
  .append("circle")
  .attr("cx", legendW / 2)
  .attr("cy", startLegendY)
  .attr("r", 8)
  .attr("fill", t.palette[0])
  .attr("stroke", t.pageBg)
  .attr("stroke-width", 2);
legendG
  .append("text")
  .attr("x", legendW + 14)
  .attr("y", startLegendY + 4)
  .attr("fill", t.inkSoft)
  .style("font-size", "13px")
  .text("Start");

const finishLegendY = startLegendY + 32;
legendG
  .append("rect")
  .attr("x", legendW / 2 - 7)
  .attr("y", finishLegendY - 7)
  .attr("width", 14)
  .attr("height", 14)
  .attr("fill", t.palette[4])
  .attr("stroke", t.pageBg)
  .attr("stroke-width", 2);
legendG
  .append("text")
  .attr("x", legendW + 14)
  .attr("y", finishLegendY + 4)
  .attr("fill", t.inkSoft)
  .style("font-size", "13px")
  .text("Finish");

// --- Title -------------------------------------------------------------------
const title = "Backcountry Trail Traverse · map-route-path · javascript · d3 · anyplot.ai";
const titleFontSize = Math.round(22 * (title.length > 67 ? 67 / title.length : 1));

svg
  .append("text")
  .attr("x", width / 2)
  .attr("y", 46)
  .attr("text-anchor", "middle")
  .attr("fill", t.ink)
  .style("font-size", `${titleFontSize}px`)
  .style("font-weight", "600")
  .text(title);

svg
  .append("text")
  .attr("x", width / 2)
  .attr("y", 76)
  .attr("text-anchor", "middle")
  .attr("fill", t.inkSoft)
  .style("font-size", "15px")
  .text("GPS track of a point-to-point mountain hike, colored by elevation");

svg
  .append("text")
  .attr("x", width / 2)
  .attr("y", 102)
  .attr("text-anchor", "middle")
  .attr("fill", t.inkSoft)
  .style("font-size", "13px")
  .text(`${totalDistanceKm.toFixed(1)} km · ${Math.round(elevationGainM)} m elevation gain · ${waypoints.length} waypoints`);
Runnable source as JSON, for any HTTP client: https://api.anyplot.ai/specs/map-route-path/d3/code. Any spec id and library id listed in llms-full.txt fit the same URL shape; every URL below is complete and callable.
{
  "spec_id": "map-route-path",
  "language": "javascript",
  "library": "d3",
  "page": "https://anyplot.ai/map-route-path/javascript/d3",
  "hub": "https://anyplot.ai/map-route-path",
  "code_json": "https://api.anyplot.ai/specs/map-route-path/d3/code",
  "spec_json": "https://api.anyplot.ai/specs/map-route-path",
  "render_light_png": "https://storage.googleapis.com/anyplot-images/plots/map-route-path/javascript/d3/plot-light.png",
  "render_dark_png": "https://storage.googleapis.com/anyplot-images/plots/map-route-path/javascript/d3/plot-dark.png",
  "interactive_light_html": "https://storage.googleapis.com/anyplot-images/plots/map-route-path/javascript/d3/plot-light.html",
  "interactive_dark_html": "https://storage.googleapis.com/anyplot-images/plots/map-route-path/javascript/d3/plot-dark.html",
  "quality_score": 91.0,
  "license": "MIT",
  "guide": "https://anyplot.ai/llms.txt"
}
Part of Route Path Map on anyplot.ai.