The same plot in 12 other libraries — JavaScript: D3.js, Apache ECharts; Python: Altair, Bokeh, lets-plot, Matplotlib, Plotly, plotnine, Pygal, Seaborn; R: ggplot2; Julia: Makie.jl. Compare all 13 side by side: Map with Tile Background in Python, R, Julia and JavaScript.
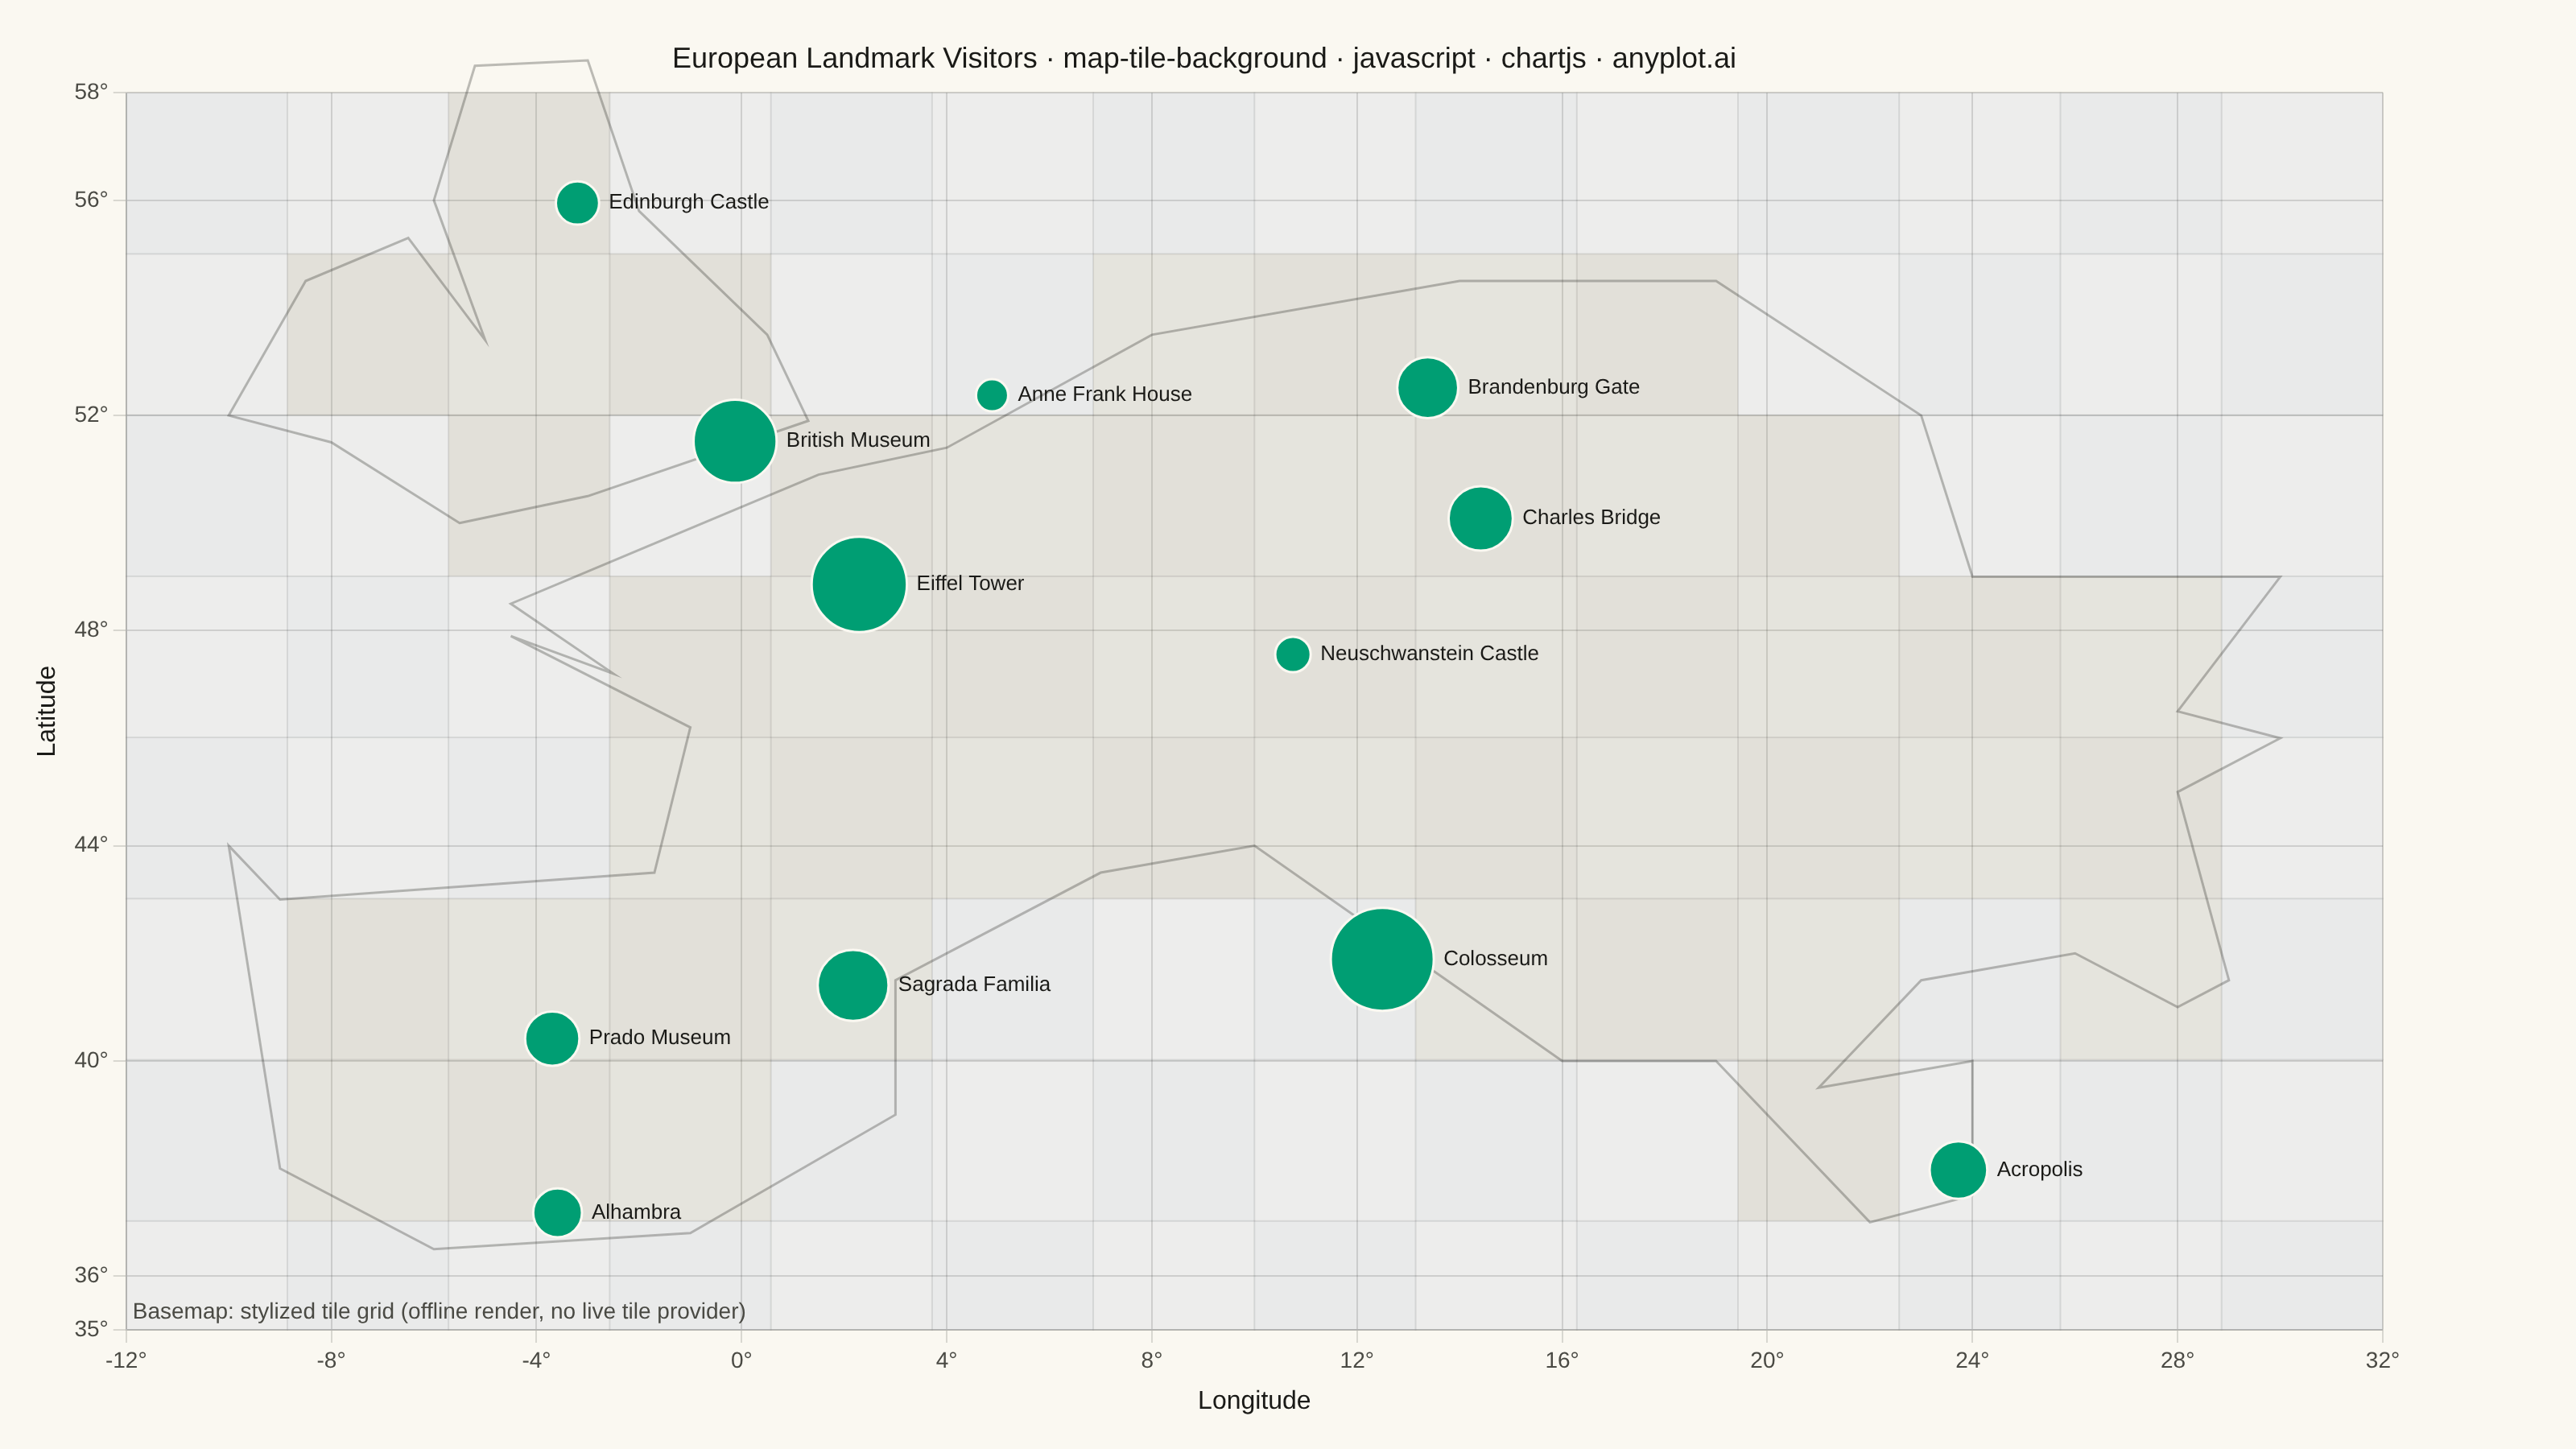
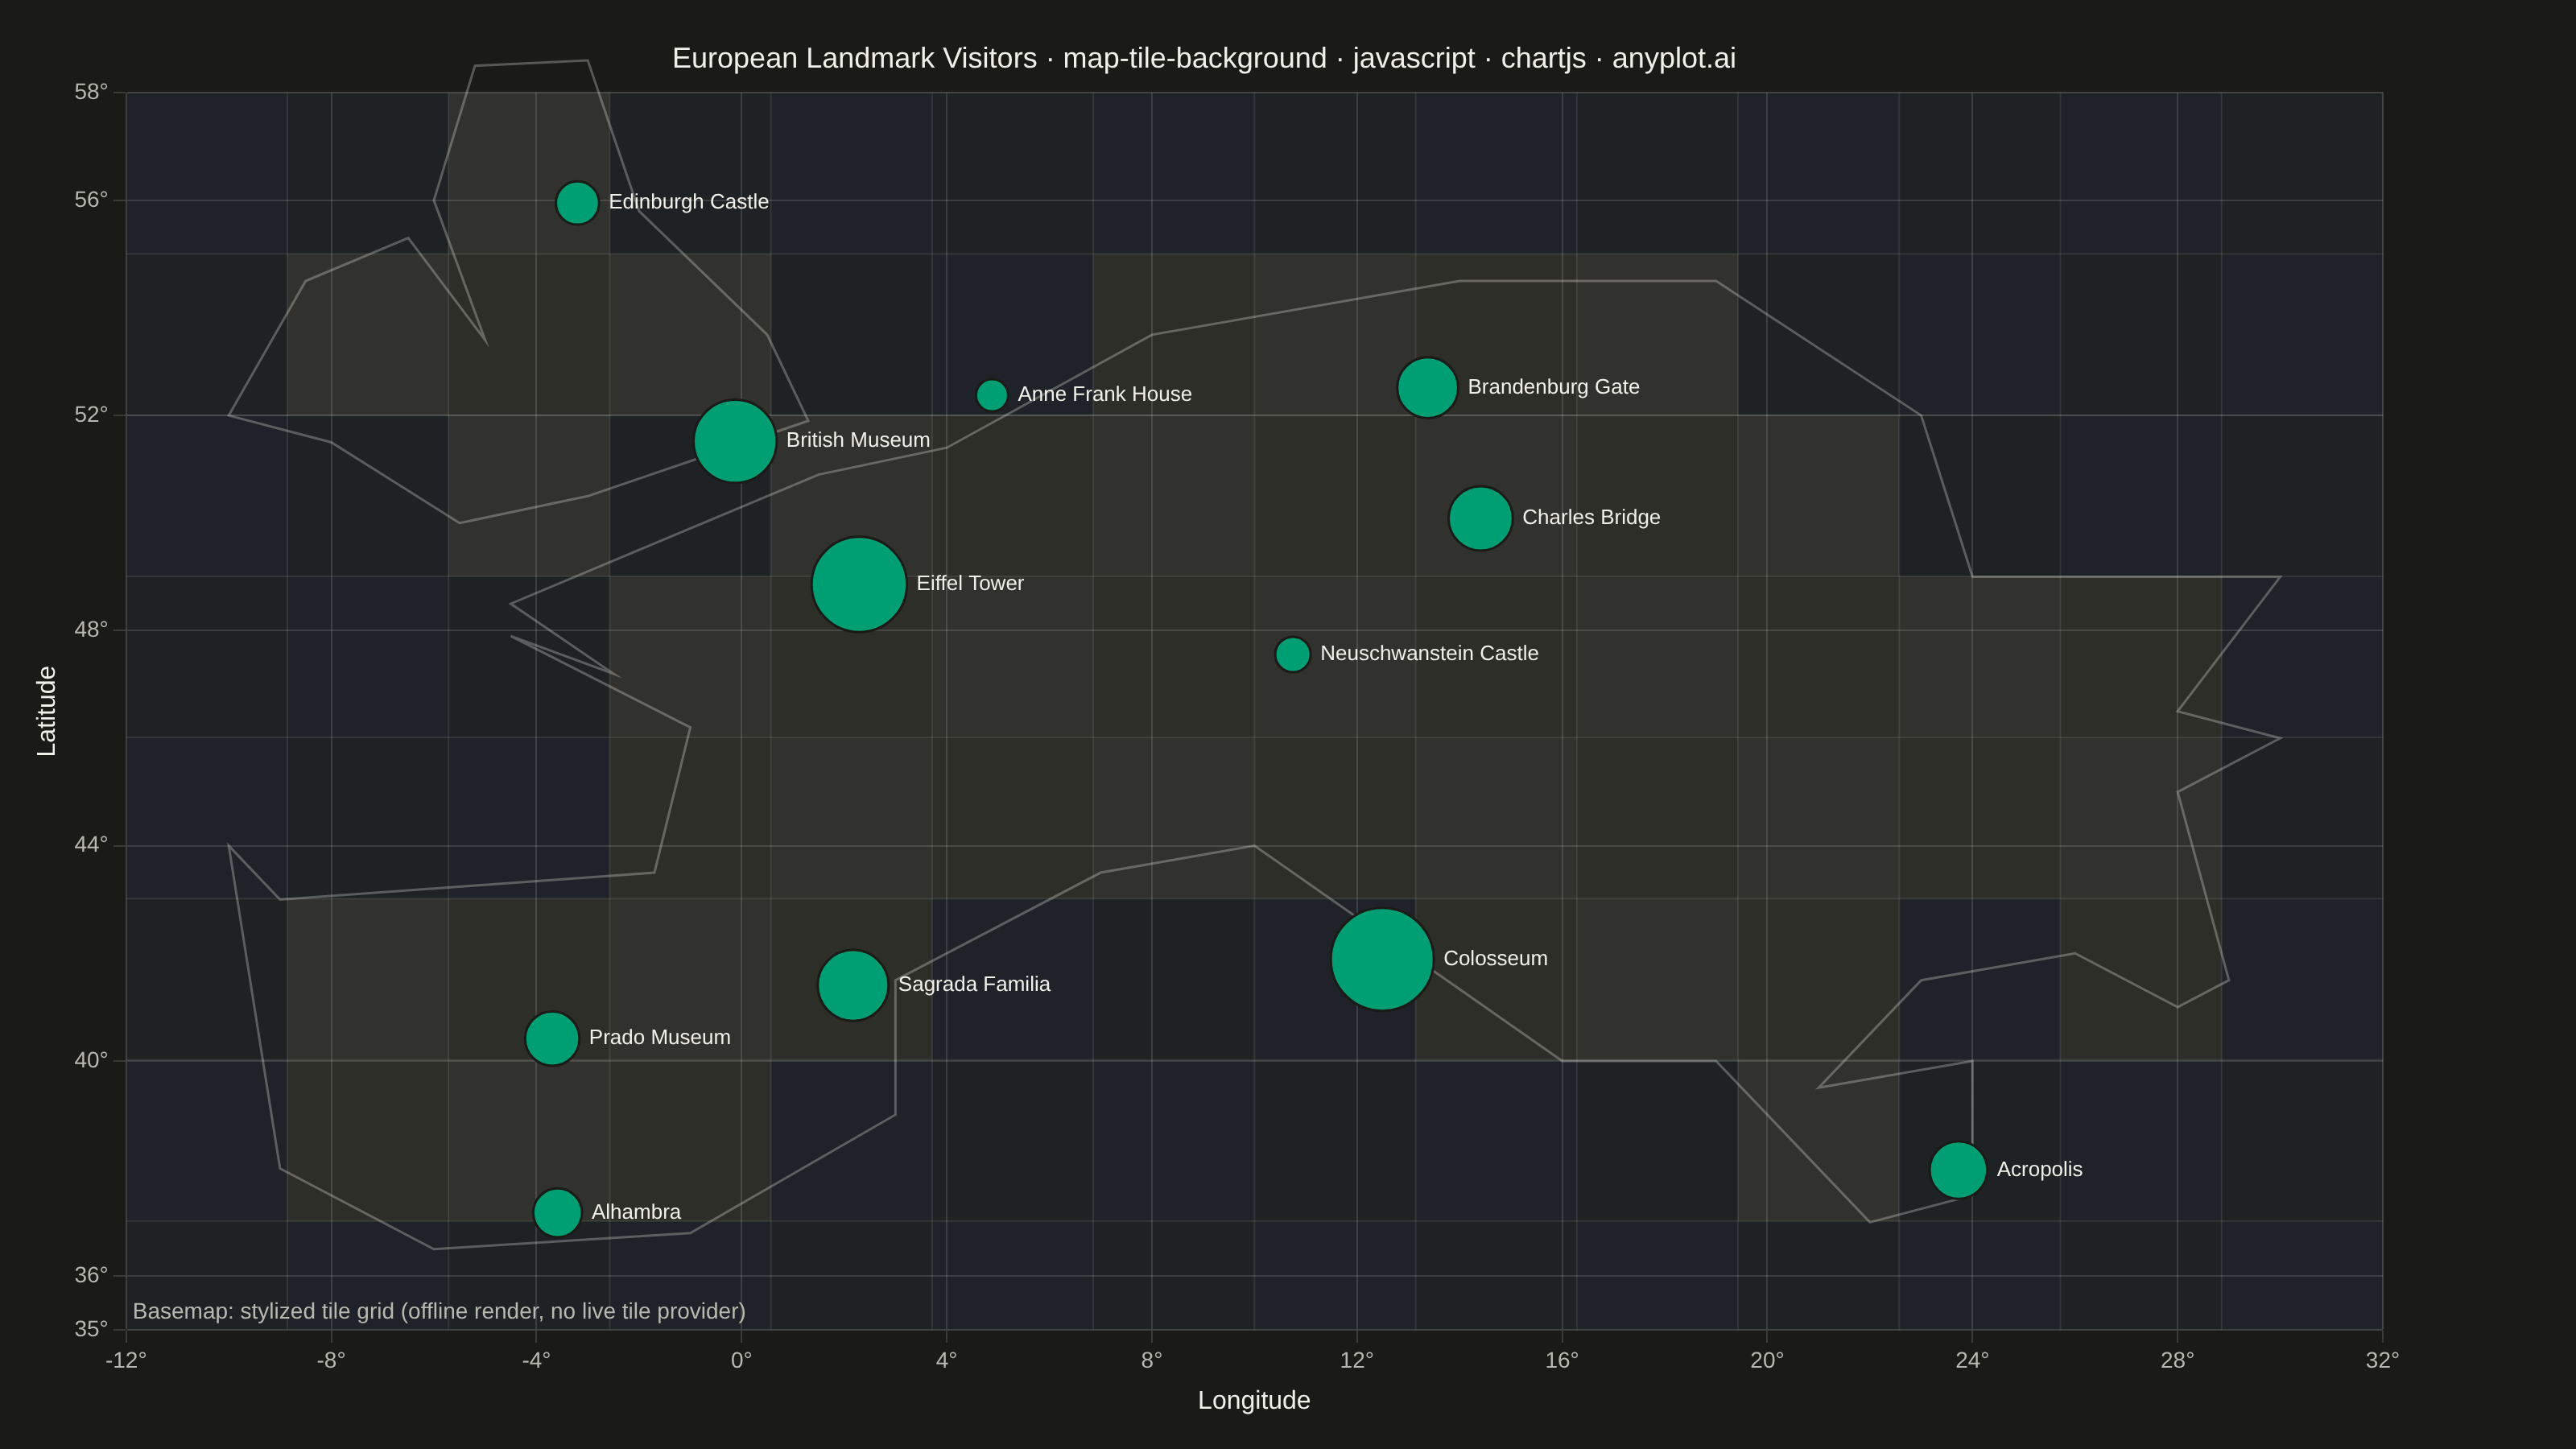
A map visualization that displays data points on top of tile-based backgrounds such as OpenStreetMap, Stamen, or satellite imagery. Unlike vector-based basemaps, tile backgrounds provide rich geographic context including street-level detail, terrain, or satellite imagery that loads dynamically as the user navigates. This visualization is essential for location-based analysis where real-world geographic context enhances data interpretation.
// anyplot.ai
// map-tile-background: Map with Tile Background
// Library: chartjs 4.4.7 | JavaScript 22.23.2
// Quality: 84/100 | Created: 2026-08-26

const t = window.ANYPLOT_TOKENS;

// --- Data (in-memory, deterministic) ----------------------------------------
// European landmarks with annual visitor counts (millions). Longitude/latitude
// double as the chart's x/y coordinates (a simple equirectangular projection),
// so Chart.js's own linear scales and gridlines become the map's graticule.
const landmarks = [
  { name: "Eiffel Tower", city: "Paris", lat: 48.858, lon: 2.294, visitorsM: 6.9 },
  { name: "British Museum", city: "London", lat: 51.519, lon: -0.127, visitorsM: 5.8 },
  { name: "Colosseum", city: "Rome", lat: 41.89, lon: 12.492, visitorsM: 7.6 },
  { name: "Sagrada Familia", city: "Barcelona", lat: 41.404, lon: 2.174, visitorsM: 4.7 },
  { name: "Anne Frank House", city: "Amsterdam", lat: 52.375, lon: 4.884, visitorsM: 1.2 },
  { name: "Brandenburg Gate", city: "Berlin", lat: 52.516, lon: 13.378, visitorsM: 3.8 },
  { name: "Acropolis", city: "Athens", lat: 37.971, lon: 23.726, visitorsM: 3.5 },
  { name: "Neuschwanstein Castle", city: "Bavaria", lat: 47.557, lon: 10.75, visitorsM: 1.5 },
  { name: "Prado Museum", city: "Madrid", lat: 40.414, lon: -3.692, visitorsM: 3.2 },
  { name: "Charles Bridge", city: "Prague", lat: 50.086, lon: 14.411, visitorsM: 4.1 },
  { name: "Edinburgh Castle", city: "Edinburgh", lat: 55.949, lon: -3.2, visitorsM: 2.2 },
  { name: "Alhambra", city: "Granada", lat: 37.176, lon: -3.588, visitorsM: 2.7 },
];
const visitorValues = landmarks.map((l) => l.visitorsM);
const minVisitors = Math.min(...visitorValues);
const maxVisitors = Math.max(...visitorValues);
const radiusFor = (v) => {
  const ratio = (v - minVisitors) / (maxVisitors - minVisitors);
  return 10 + ratio * 22; // few points -> prominent bubbles
};

// Simplified Western/Central Europe coastline (lon/lat) — stylized geographic
// context only, not survey-accurate. Used purely to pick "land" vs "sea" tile
// shading for the basemap; not itself a data series.
const EUROPE_COASTLINE = [
  [-10, 44], [-9, 38], [-6, 36.5], [-1, 36.8], [3, 39], [3, 41.5],
  [7, 43.5], [10, 44], [13, 42], [16, 40], [19, 40], [22, 37],
  [24, 37.5], [24, 40], [21, 39.5], [23, 41.5], [26, 42], [28, 41],
  [29, 41.5], [28, 45], [30, 46], [28, 46.5], [30, 49], [24, 49],
  [23, 52], [19, 54.5], [14, 54.5], [8, 53.5], [4, 51.4], [1.5, 50.9],
  [-2, 49.5], [-4.5, 48.5], [-2.5, 47.2], [-4.5, 47.9], [-1, 46.2],
  [-1.7, 43.5], [-9, 43],
];
const BRITISH_ISLES = [
  [-5.5, 50], [-3, 50.5], [1.3, 51.9], [0.5, 53.5], [-2, 55.8],
  [-3, 58.6], [-5.2, 58.5], [-6, 56], [-5, 53.4], [-6.5, 55.3],
  [-8.5, 54.5], [-10, 52], [-8, 51.5], [-5.5, 50],
];

const pointInPolygon = (lon, lat, polygon) => {
  let inside = false;
  for (let i = 0, j = polygon.length - 1; i < polygon.length; j = i++) {
    const [xi, yi] = polygon[i];
    const [xj, yj] = polygon[j];
    const intersects = yi > lat !== yj > lat && lon < ((xj - xi) * (lat - yi)) / (yj - yi) + xi;
    if (intersects) inside = !inside;
  }
  return inside;
};
const isLand = (lon, lat) =>
  pointInPolygon(lon, lat, EUROPE_COASTLINE) || pointInPolygon(lon, lat, BRITISH_ISLES);

// --- Custom draw plugins -----------------------------------------------------
// Chart.js has no native tile/raster basemap layer, and the offline render
// harness cannot fetch real OpenStreetMap/CartoDB/satellite tiles. This plugin
// draws a stylized tile grid directly with the canvas context, projected
// through the chart's own linear scales — land/sea tiles are shaded
// differently and a visible tile seam grid stands in for a raster slippy-map
// tileset, giving the "tile background" concept honestly without pretending
// to be live provider imagery.
const TILE_COLUMNS = 14;
const tileBasemapPlugin = {
  id: "tileBasemap",
  beforeDatasetsDraw(chart) {
    const { ctx, chartArea, scales } = chart;
    const tileSize = chartArea.width / TILE_COLUMNS;
    const rows = Math.ceil(chartArea.height / tileSize);
    // Tile shading kept close in tone (checker vs. alt) and seams drawn at low
    // alpha so the tile grid reads as a subtle backdrop, not a hard checkerboard.
    const landFill = window.ANYPLOT_THEME === "light" ? "rgba(107, 106, 99, 0.14)" : "rgba(168, 167, 159, 0.14)";
    const landFillAlt = window.ANYPLOT_THEME === "light" ? "rgba(107, 106, 99, 0.17)" : "rgba(168, 167, 159, 0.17)";
    const seaFill = window.ANYPLOT_THEME === "light" ? "rgba(68, 103, 163, 0.07)" : "rgba(68, 103, 163, 0.10)";
    const seaFillAlt = window.ANYPLOT_THEME === "light" ? "rgba(68, 103, 163, 0.09)" : "rgba(68, 103, 163, 0.13)";
    const tileSeam = window.ANYPLOT_THEME === "light" ? "rgba(26, 26, 23, 0.05)" : "rgba(250, 248, 241, 0.05)";
    const coastlineStroke = window.ANYPLOT_THEME === "light" ? "rgba(26, 26, 23, 0.28)" : "rgba(250, 248, 241, 0.28)";

    ctx.save();
    ctx.strokeStyle = tileSeam;
    ctx.lineWidth = 1;
    for (let row = 0; row < rows; row += 1) {
      for (let col = 0; col < TILE_COLUMNS; col += 1) {
        const x = chartArea.left + col * tileSize;
        const y = chartArea.top + row * tileSize;
        const w = Math.min(tileSize, chartArea.right - x);
        const h = Math.min(tileSize, chartArea.bottom - y);
        if (w <= 0 || h <= 0) continue;
        const centerLon = scales.x.getValueForPixel(x + w / 2);
        const centerLat = scales.y.getValueForPixel(y + h / 2);
        const checker = (row + col) % 2 === 0;
        const land = isLand(centerLon, centerLat);
        ctx.fillStyle = land ? (checker ? landFillAlt : landFill) : checker ? seaFillAlt : seaFill;
        ctx.fillRect(x, y, w, h);
        ctx.strokeRect(x, y, w, h);
      }
    }

    // A crisp coastline stroke on top of the soft tiles gives the map real
    // geographic definition without relying on the checker pattern alone.
    ctx.strokeStyle = coastlineStroke;
    ctx.lineWidth = 1.5;
    [EUROPE_COASTLINE, BRITISH_ISLES].forEach((polygon) => {
      ctx.beginPath();
      polygon.forEach(([lon, lat], idx) => {
        const px = scales.x.getPixelForValue(lon);
        const py = scales.y.getPixelForValue(lat);
        if (idx === 0) ctx.moveTo(px, py);
        else ctx.lineTo(px, py);
      });
      ctx.closePath();
      ctx.stroke();
    });
    ctx.restore();
  },
};

// Small caption naming the basemap style honestly (illustrative tile grid,
// not a live tile-provider fetch), sitting in the empty Atlantic corner.
const basemapCaptionPlugin = {
  id: "basemapCaption",
  afterDraw(chart) {
    const { ctx, chartArea } = chart;
    ctx.save();
    ctx.font = "14px sans-serif";
    ctx.fillStyle = t.inkSoft;
    ctx.textAlign = "left";
    ctx.textBaseline = "bottom";
    ctx.fillText("Basemap: stylized tile grid (offline render, no live tile provider)", chartArea.left + 4, chartArea.bottom - 4);
    ctx.restore();
  },
};

const labelPlugin = {
  id: "landmarkLabels",
  afterDatasetsDraw(chart) {
    const { ctx, scales } = chart;
    ctx.save();
    ctx.font = "13px sans-serif";
    ctx.fillStyle = t.ink;
    ctx.textAlign = "left";
    ctx.textBaseline = "middle";
    landmarks.forEach((l) => {
      const x = scales.x.getPixelForValue(l.lon);
      const y = scales.y.getPixelForValue(l.lat);
      ctx.fillText(l.name, x + radiusFor(l.visitorsM) + 6, y);
    });
    ctx.restore();
  },
};

// --- Mount -------------------------------------------------------------------
const canvas = document.createElement("canvas");
document.getElementById("container").appendChild(canvas);

// --- Title (scale fontsize to the rendered length, see plot-generator.md) ---
const title = "European Landmark Visitors · map-tile-background · javascript · chartjs · anyplot.ai";
const titleFontSize = Math.max(15, Math.round(22 * Math.min(1, 67 / title.length)));

// --- Chart -------------------------------------------------------------------
const chart = new Chart(canvas, {
  type: "bubble",
  data: {
    datasets: [
      {
        label: "Landmarks",
        data: landmarks.map((l) => ({ x: l.lon, y: l.lat, r: radiusFor(l.visitorsM) })),
        backgroundColor: t.palette[0],
        borderColor: t.pageBg,
        borderWidth: 1.5,
      },
    ],
  },
  plugins: [tileBasemapPlugin, basemapCaptionPlugin, labelPlugin],
  options: {
    responsive: true,
    maintainAspectRatio: false,
    animation: false,
    layout: { padding: { top: 16, right: 120, bottom: 16, left: 16 } },
    plugins: {
      title: {
        display: true,
        text: title,
        color: t.ink,
        font: { size: titleFontSize, weight: "500" },
      },
      legend: { display: false },
      tooltip: {
        callbacks: {
          label: (ctx) => {
            const l = landmarks[ctx.dataIndex];
            return `${l.name}, ${l.city}: ${l.visitorsM}M visitors/year`;
          },
        },
      },
    },
    scales: {
      x: {
        type: "linear",
        min: -12,
        max: 32,
        title: { display: true, text: "Longitude", color: t.ink, font: { size: 16 } },
        ticks: { color: t.inkSoft, font: { size: 14 }, stepSize: 4, callback: (v) => `${v}°` },
        grid: { color: t.grid },
      },
      y: {
        type: "linear",
        min: 35,
        max: 58,
        title: { display: true, text: "Latitude", color: t.ink, font: { size: 16 } },
        ticks: { color: t.inkSoft, font: { size: 14 }, stepSize: 4, callback: (v) => `${v}°` },
        grid: { color: t.grid },
      },
    },
  },
});

// --- Zoom & pan (native wheel/drag, no external plugin) ---------------------
// The spec asks interactive libraries to let users explore the map at
// different scales; chartjs-plugin-zoom isn't installed in this runtime, so
// wheel-to-zoom and drag-to-pan are wired directly onto the linear scales.
canvas.style.cursor = "grab";
let isPanning = false;
let lastX = 0;
let lastY = 0;
canvas.addEventListener("mousedown", (evt) => {
  isPanning = true;
  lastX = evt.offsetX;
  lastY = evt.offsetY;
  canvas.style.cursor = "grabbing";
});
canvas.addEventListener("mousemove", (evt) => {
  if (!isPanning) return;
  const { x: xScale, y: yScale } = chart.scales;
  const dLon = xScale.getValueForPixel(lastX) - xScale.getValueForPixel(evt.offsetX);
  const dLat = yScale.getValueForPixel(lastY) - yScale.getValueForPixel(evt.offsetY);
  xScale.options.min += dLon;
  xScale.options.max += dLon;
  yScale.options.min += dLat;
  yScale.options.max += dLat;
  lastX = evt.offsetX;
  lastY = evt.offsetY;
  chart.update("none");
});
["mouseup", "mouseleave"].forEach((evtName) =>
  canvas.addEventListener(evtName, () => {
    isPanning = false;
    canvas.style.cursor = "grab";
  }),
);
canvas.addEventListener(
  "wheel",
  (evt) => {
    evt.preventDefault();
    const { x: xScale, y: yScale } = chart.scales;
    const zoomFactor = evt.deltaY < 0 ? 0.9 : 1.1;
    const cursorLon = xScale.getValueForPixel(evt.offsetX);
    const cursorLat = yScale.getValueForPixel(evt.offsetY);
    xScale.options.min = cursorLon + (xScale.min - cursorLon) * zoomFactor;
    xScale.options.max = cursorLon + (xScale.max - cursorLon) * zoomFactor;
    yScale.options.min = cursorLat + (yScale.min - cursorLat) * zoomFactor;
    yScale.options.max = cursorLat + (yScale.max - cursorLat) * zoomFactor;
    chart.update("none");
  },
  { passive: false },
);
Runnable source as JSON, for any HTTP client: https://api.anyplot.ai/specs/map-tile-background/chartjs/code. Any spec id and library id listed in llms-full.txt fit the same URL shape; every URL below is complete and callable.
{
  "spec_id": "map-tile-background",
  "language": "javascript",
  "library": "chartjs",
  "page": "https://anyplot.ai/map-tile-background/javascript/chartjs",
  "hub": "https://anyplot.ai/map-tile-background",
  "code_json": "https://api.anyplot.ai/specs/map-tile-background/chartjs/code",
  "spec_json": "https://api.anyplot.ai/specs/map-tile-background",
  "render_light_png": "https://storage.googleapis.com/anyplot-images/plots/map-tile-background/javascript/chartjs/plot-light.png",
  "render_dark_png": "https://storage.googleapis.com/anyplot-images/plots/map-tile-background/javascript/chartjs/plot-dark.png",
  "interactive_light_html": "https://storage.googleapis.com/anyplot-images/plots/map-tile-background/javascript/chartjs/plot-light.html",
  "interactive_dark_html": "https://storage.googleapis.com/anyplot-images/plots/map-tile-background/javascript/chartjs/plot-dark.html",
  "quality_score": 84.0,
  "license": "MIT",
  "guide": "https://anyplot.ai/llms.txt"
}
Part of Map with Tile Background on anyplot.ai.