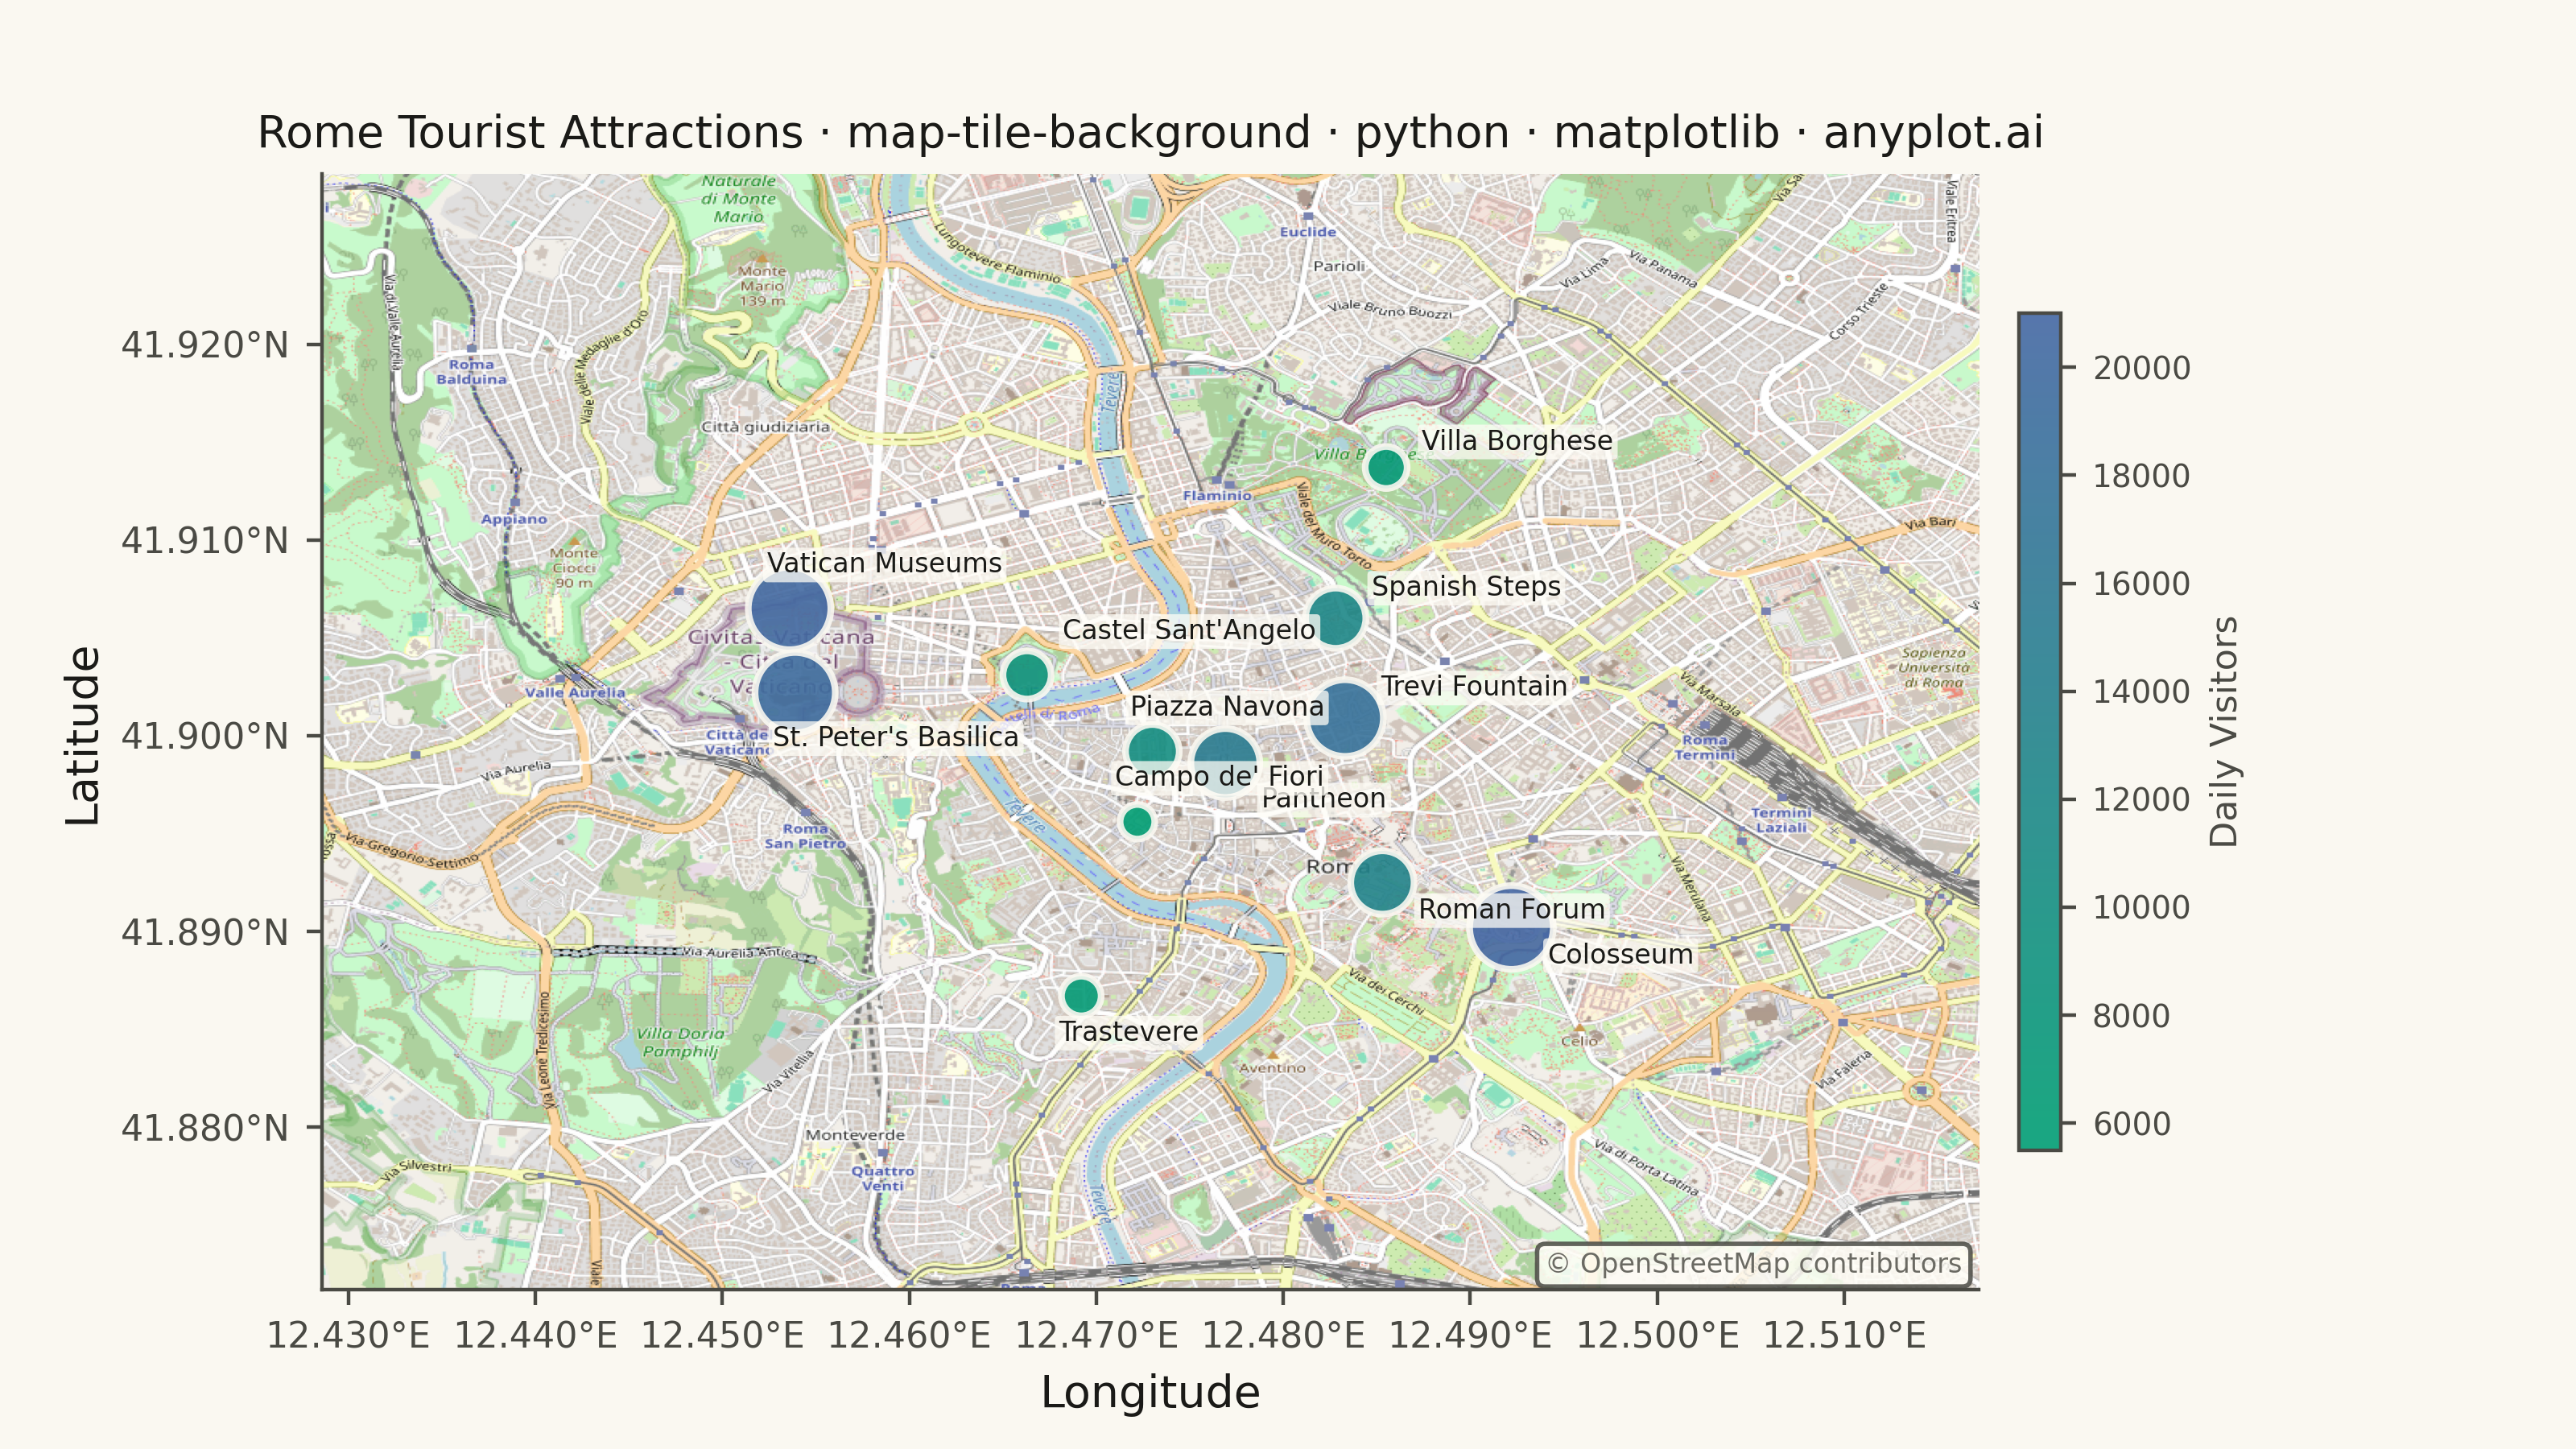
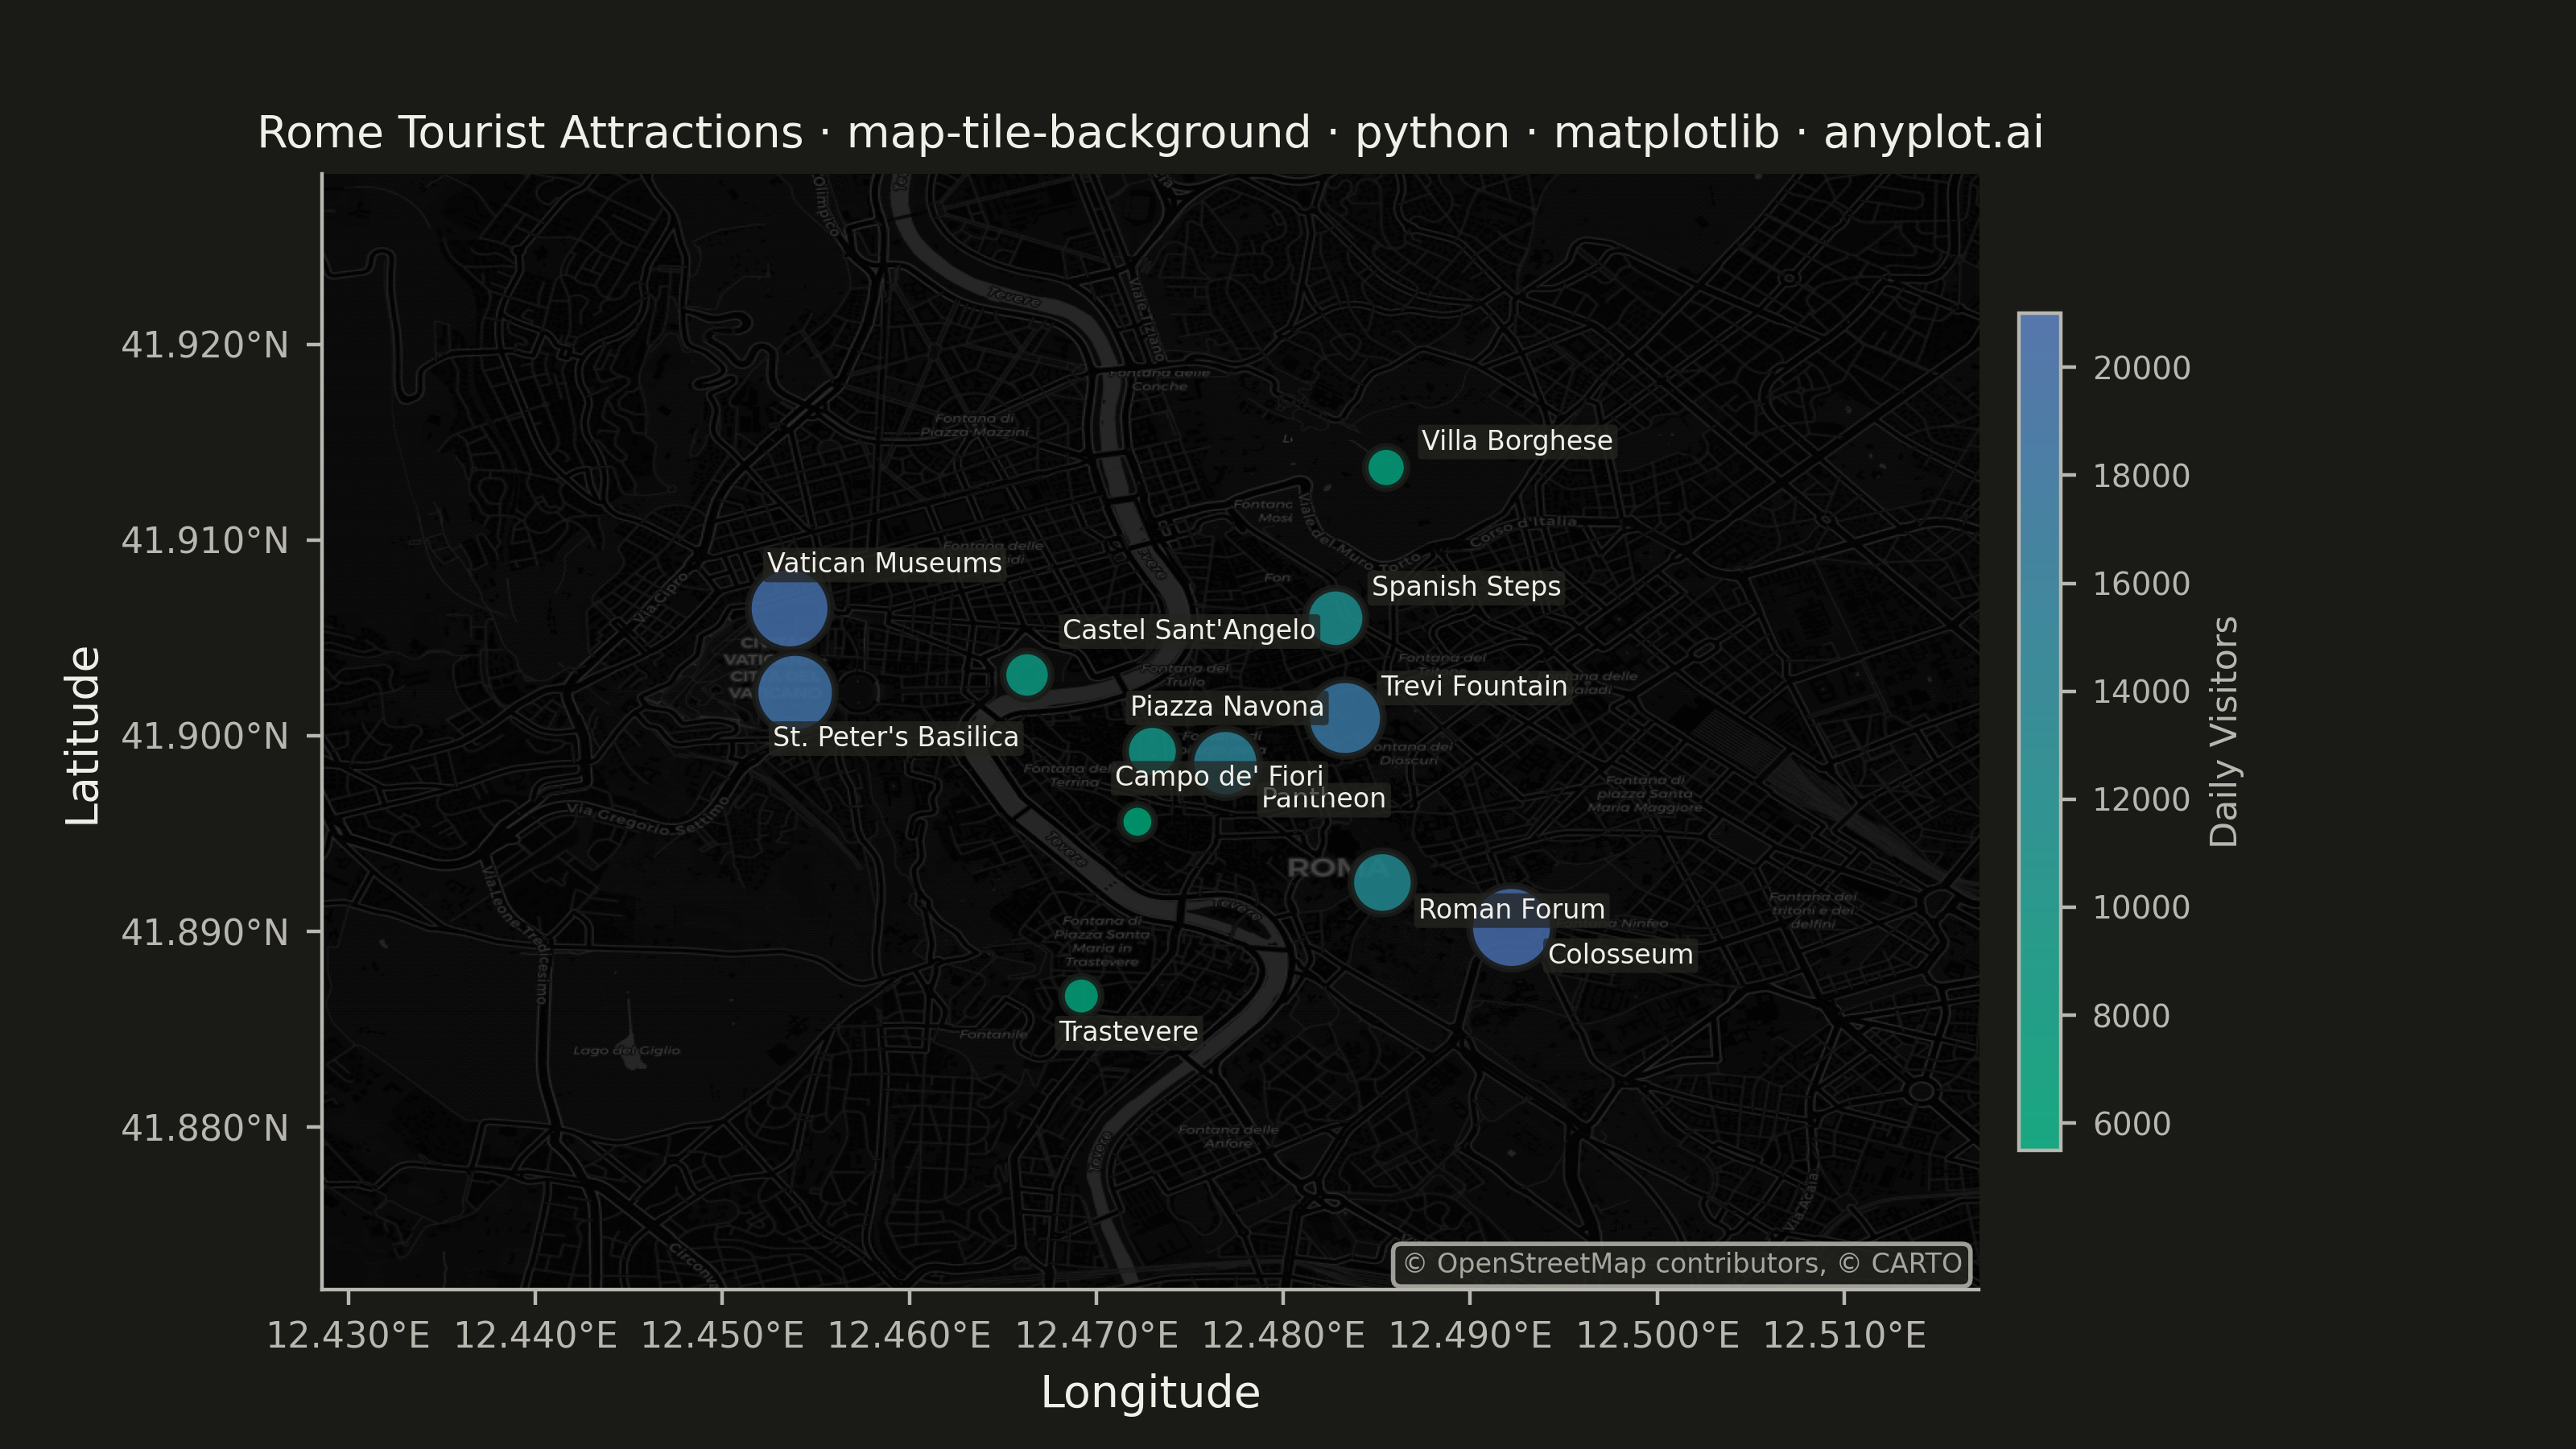
A map visualization that displays data points on top of tile-based backgrounds such as OpenStreetMap, Stamen, or satellite imagery. Unlike vector-based basemaps, tile backgrounds provide rich geographic context including street-level detail, terrain, or satellite imagery that loads dynamically as the user navigates. This visualization is essential for location-based analysis where real-world geographic context enhances data interpretation.
""" anyplot.ai
map-tile-background: Map with Tile Background
Library: matplotlib 3.10.9 | Python 3.13.13
Quality: 86/100 | Updated: 2026-05-27
"""

import io
import math
import os
import urllib.request

import matplotlib.pyplot as plt
import numpy as np
from matplotlib.colors import LinearSegmentedColormap
from PIL import Image


# Theme tokens
THEME = os.getenv("ANYPLOT_THEME", "light")
PAGE_BG = "#FAF8F1" if THEME == "light" else "#1A1A17"
ELEVATED_BG = "#FFFDF6" if THEME == "light" else "#242420"
INK = "#1A1A17" if THEME == "light" else "#F0EFE8"
INK_SOFT = "#4A4A44" if THEME == "light" else "#B8B7B0"
INK_MUTED = "#6B6A63" if THEME == "light" else "#A8A79F"

# Continuous colormap (imprint_seq: brand green → blue) for visitor density
imprint_seq = LinearSegmentedColormap.from_list("imprint_seq", ["#009E73", "#4467A3"])

# Data: Rome tourist attractions with daily visitor counts (realistic scale)
locations = {
    "Colosseum": (41.8902, 12.4922, 21000),
    "Vatican Museums": (41.9065, 12.4536, 20500),
    "St. Peter's Basilica": (41.9022, 12.4539, 19500),
    "Trevi Fountain": (41.9009, 12.4833, 18000),
    "Pantheon": (41.8986, 12.4769, 15000),
    "Roman Forum": (41.8925, 12.4853, 13000),
    "Spanish Steps": (41.9060, 12.4828, 12000),
    "Piazza Navona": (41.8992, 12.4730, 10000),
    "Castel Sant'Angelo": (41.9031, 12.4663, 8500),
    "Villa Borghese": (41.9137, 12.4855, 7000),
    "Trastevere": (41.8867, 12.4692, 6500),
    "Campo de' Fiori": (41.8956, 12.4722, 5500),
}

# Per-attraction label offsets (directional spread to reduce crowding)
label_offsets = {
    "Colosseum": (8, -8),
    "Vatican Museums": (-5, 8),
    "St. Peter's Basilica": (-5, -12),
    "Trevi Fountain": (8, 5),
    "Pantheon": (8, -10),
    "Roman Forum": (8, -8),
    "Spanish Steps": (8, 5),
    "Piazza Navona": (-5, 8),
    "Castel Sant'Angelo": (8, 8),
    "Villa Borghese": (8, 4),
    "Trastevere": (-5, -10),
    "Campo de' Fiori": (-5, 8),
}

names = list(locations.keys())
lats = np.array([v[0] for v in locations.values()])
lons = np.array([v[1] for v in locations.values()])
visitors = np.array([v[2] for v in locations.values()])

# Bounding box with padding
lat_min = lats.min() - 0.015
lat_max = lats.max() + 0.015
lon_min = lons.min() - 0.025
lon_max = lons.max() + 0.025

# Theme-adaptive tile provider
zoom = 14
n_tiles = 2**zoom
if THEME == "light":
    tile_url = "https://tile.openstreetmap.org/{z}/{x}/{y}.png"
    attribution = "© OpenStreetMap contributors"
else:
    tile_url = "https://basemaps.cartocdn.com/dark_all/{z}/{x}/{y}.png"
    attribution = "© OpenStreetMap contributors, © CARTO"

# Tile index range for the bounding box
tx_min = int((lon_min + 180) / 360 * n_tiles)
tx_max = int((lon_max + 180) / 360 * n_tiles)
ty_min = int((1 - math.asinh(math.tan(math.radians(lat_max))) / math.pi) / 2 * n_tiles)
ty_max = int((1 - math.asinh(math.tan(math.radians(lat_min))) / math.pi) / 2 * n_tiles)

# Fetch and stitch tiles into a single image
tile_size = 256
stitched = Image.new("RGB", ((tx_max - tx_min + 1) * tile_size, (ty_max - ty_min + 1) * tile_size))
ua = {"User-Agent": "anyplot.ai/1.0 (https://anyplot.ai; visualization demo)"}
for tx in range(tx_min, tx_max + 1):
    for ty in range(ty_min, ty_max + 1):
        req = urllib.request.Request(tile_url.format(z=zoom, x=tx, y=ty), headers=ua)
        with urllib.request.urlopen(req, timeout=10) as resp:
            tile = Image.open(io.BytesIO(resp.read())).convert("RGB")
        stitched.paste(tile, ((tx - tx_min) * tile_size, (ty - ty_min) * tile_size))

# Geographic extent of the stitched image [left, right, bottom, top]
nw_lon = tx_min / n_tiles * 360 - 180
nw_lat = math.degrees(math.atan(math.sinh(math.pi * (1 - 2 * ty_min / n_tiles))))
se_lon = (tx_max + 1) / n_tiles * 360 - 180
se_lat = math.degrees(math.atan(math.sinh(math.pi * (1 - 2 * (ty_max + 1) / n_tiles))))

# Plot
title = "Rome Tourist Attractions · map-tile-background · python · matplotlib · anyplot.ai"
title_fontsize = max(8, round(12 * 67 / len(title)))

fig, ax = plt.subplots(figsize=(8, 4.5), dpi=400, facecolor=PAGE_BG)
ax.set_facecolor(PAGE_BG)

ax.imshow(np.array(stitched), extent=[nw_lon, se_lon, se_lat, nw_lat], aspect="auto", zorder=0)

# Scatter: size and color both encode daily visitor count
sizes = 60 + (visitors - visitors.min()) / (visitors.max() - visitors.min()) * 290

scatter = ax.scatter(
    lons,
    lats,
    c=visitors,
    s=sizes,
    cmap=imprint_seq,
    vmin=visitors.min(),
    vmax=visitors.max(),
    alpha=0.9,
    edgecolors=PAGE_BG,
    linewidth=1.5,
    zorder=5,
)

# Attraction name labels with per-attraction directional offsets
for name, lon, lat in zip(names, lons, lats, strict=False):
    dx, dy = label_offsets.get(name, (6, 4))
    ax.annotate(
        name,
        (lon, lat),
        xytext=(dx, dy),
        textcoords="offset points",
        fontsize=6,
        color=INK,
        bbox={"boxstyle": "round,pad=0.15", "facecolor": ELEVATED_BG, "edgecolor": "none", "alpha": 0.75},
        zorder=8,
    )

# Colorbar
cbar = plt.colorbar(scatter, ax=ax, shrink=0.75, pad=0.02)
cbar.set_label("Daily Visitors", fontsize=8, color=INK_SOFT)
cbar.ax.tick_params(labelsize=7, colors=INK_SOFT)
cbar.outline.set_edgecolor(INK_SOFT)

# Axis limits and labels
ax.set_xlim(lon_min, lon_max)
ax.set_ylim(lat_min, lat_max)
ax.set_xlabel("Longitude", fontsize=10, color=INK)
ax.set_ylabel("Latitude", fontsize=10, color=INK)
ax.set_title(title, fontsize=title_fontsize, fontweight="medium", color=INK)
ax.tick_params(axis="both", labelsize=8, colors=INK_SOFT)
ax.xaxis.set_major_formatter(plt.FuncFormatter(lambda x, p: f"{x:.3f}°E"))
ax.yaxis.set_major_formatter(plt.FuncFormatter(lambda y, p: f"{y:.3f}°N"))

for spine in ("left", "bottom"):
    ax.spines[spine].set_color(INK_SOFT)
ax.spines["top"].set_visible(False)
ax.spines["right"].set_visible(False)

# Tile attribution (required by provider license)
ax.text(
    0.99,
    0.01,
    attribution,
    transform=ax.transAxes,
    fontsize=6,
    ha="right",
    va="bottom",
    color=INK_MUTED,
    bbox={"boxstyle": "round,pad=0.3", "facecolor": ELEVATED_BG, "edgecolor": INK_SOFT, "alpha": 0.85},
    zorder=10,
)

plt.savefig(f"plot-{THEME}.png", dpi=400, facecolor=PAGE_BG)
Runnable source as JSON, for any HTTP client: https://api.anyplot.ai/specs/map-tile-background/matplotlib/code. Any spec id and library id listed in llms-full.txt fit the same URL shape; every URL below is complete and callable.
{
  "spec_id": "map-tile-background",
  "language": "python",
  "library": "matplotlib",
  "page": "https://anyplot.ai/map-tile-background/python/matplotlib",
  "hub": "https://anyplot.ai/map-tile-background",
  "code_json": "https://api.anyplot.ai/specs/map-tile-background/matplotlib/code",
  "spec_json": "https://api.anyplot.ai/specs/map-tile-background",
  "render_light_png": "https://storage.googleapis.com/anyplot-images/plots/map-tile-background/python/matplotlib/plot-light.png",
  "render_dark_png": "https://storage.googleapis.com/anyplot-images/plots/map-tile-background/python/matplotlib/plot-dark.png",
  "quality_score": 86.0,
  "license": "MIT",
  "guide": "https://anyplot.ai/llms.txt"
}
Part of Map with Tile Background on anyplot.ai.