The same plot in 12 other libraries — JavaScript: Chart.js, D3.js; Python: Altair, Bokeh, lets-plot, Matplotlib, Plotly, plotnine, Pygal, Seaborn; R: ggplot2; Julia: Makie.jl. Compare all 13 side by side: Map with Tile Background in Python, R, Julia and JavaScript.
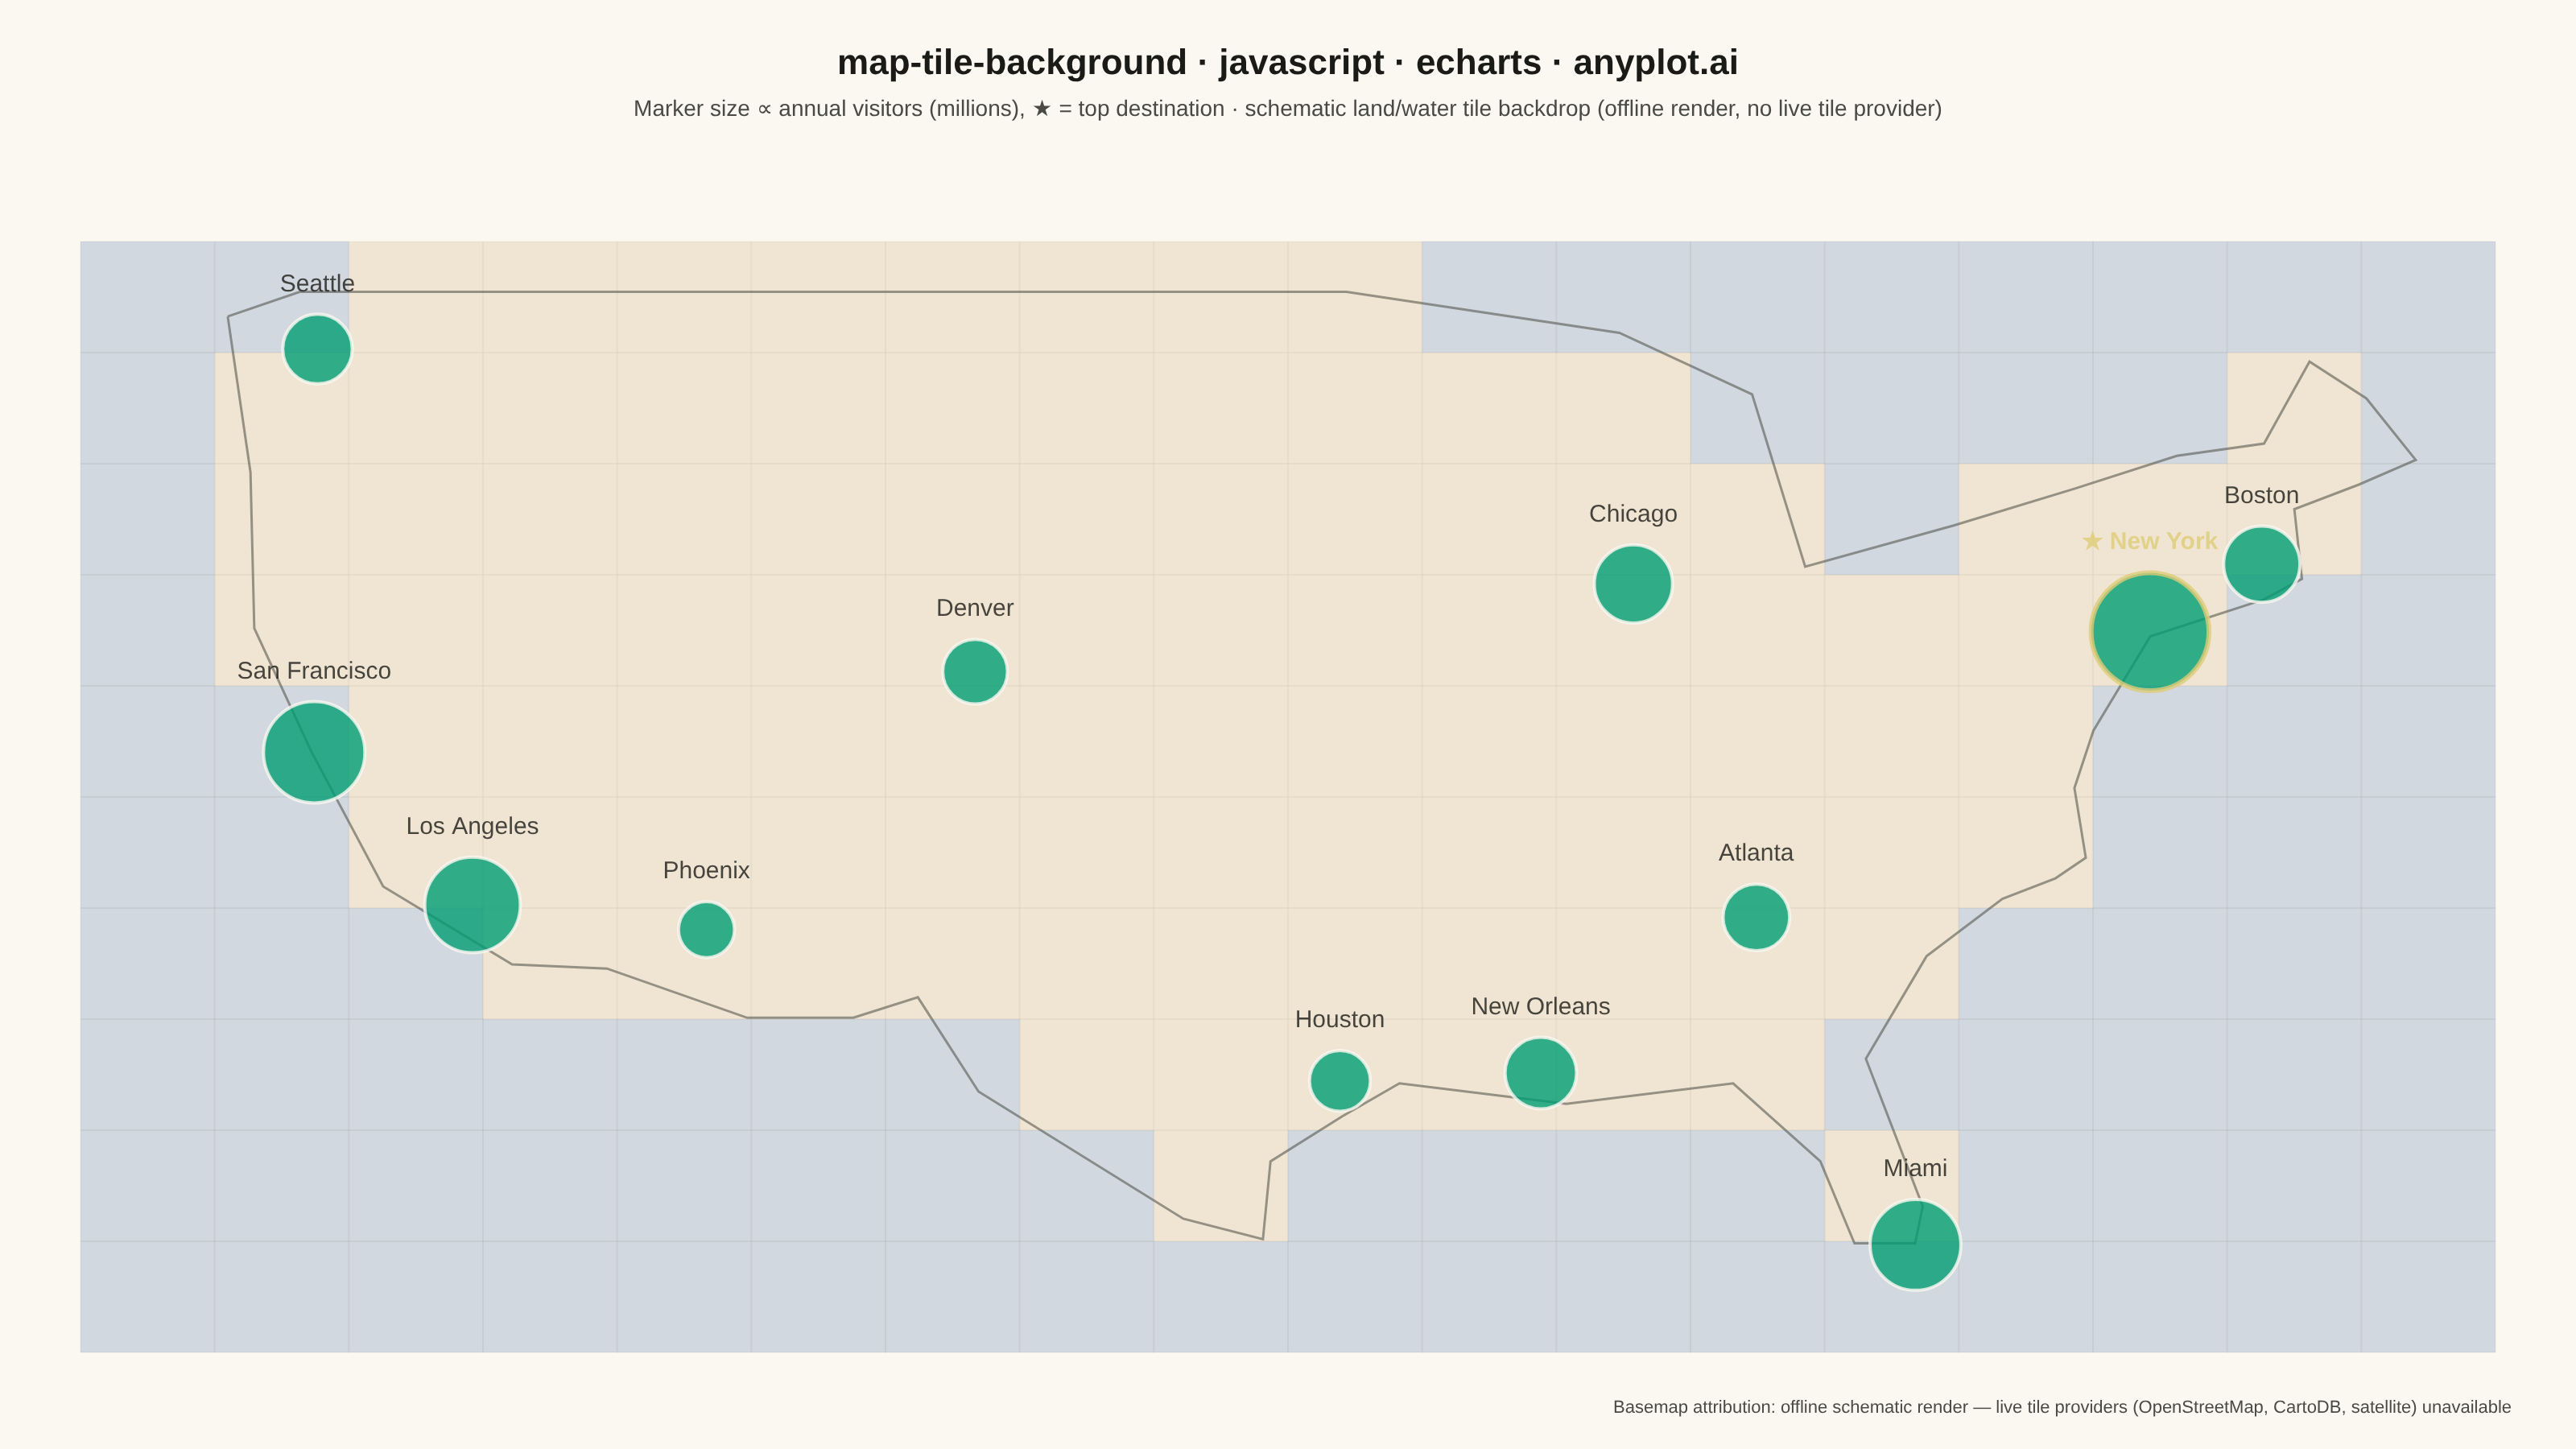
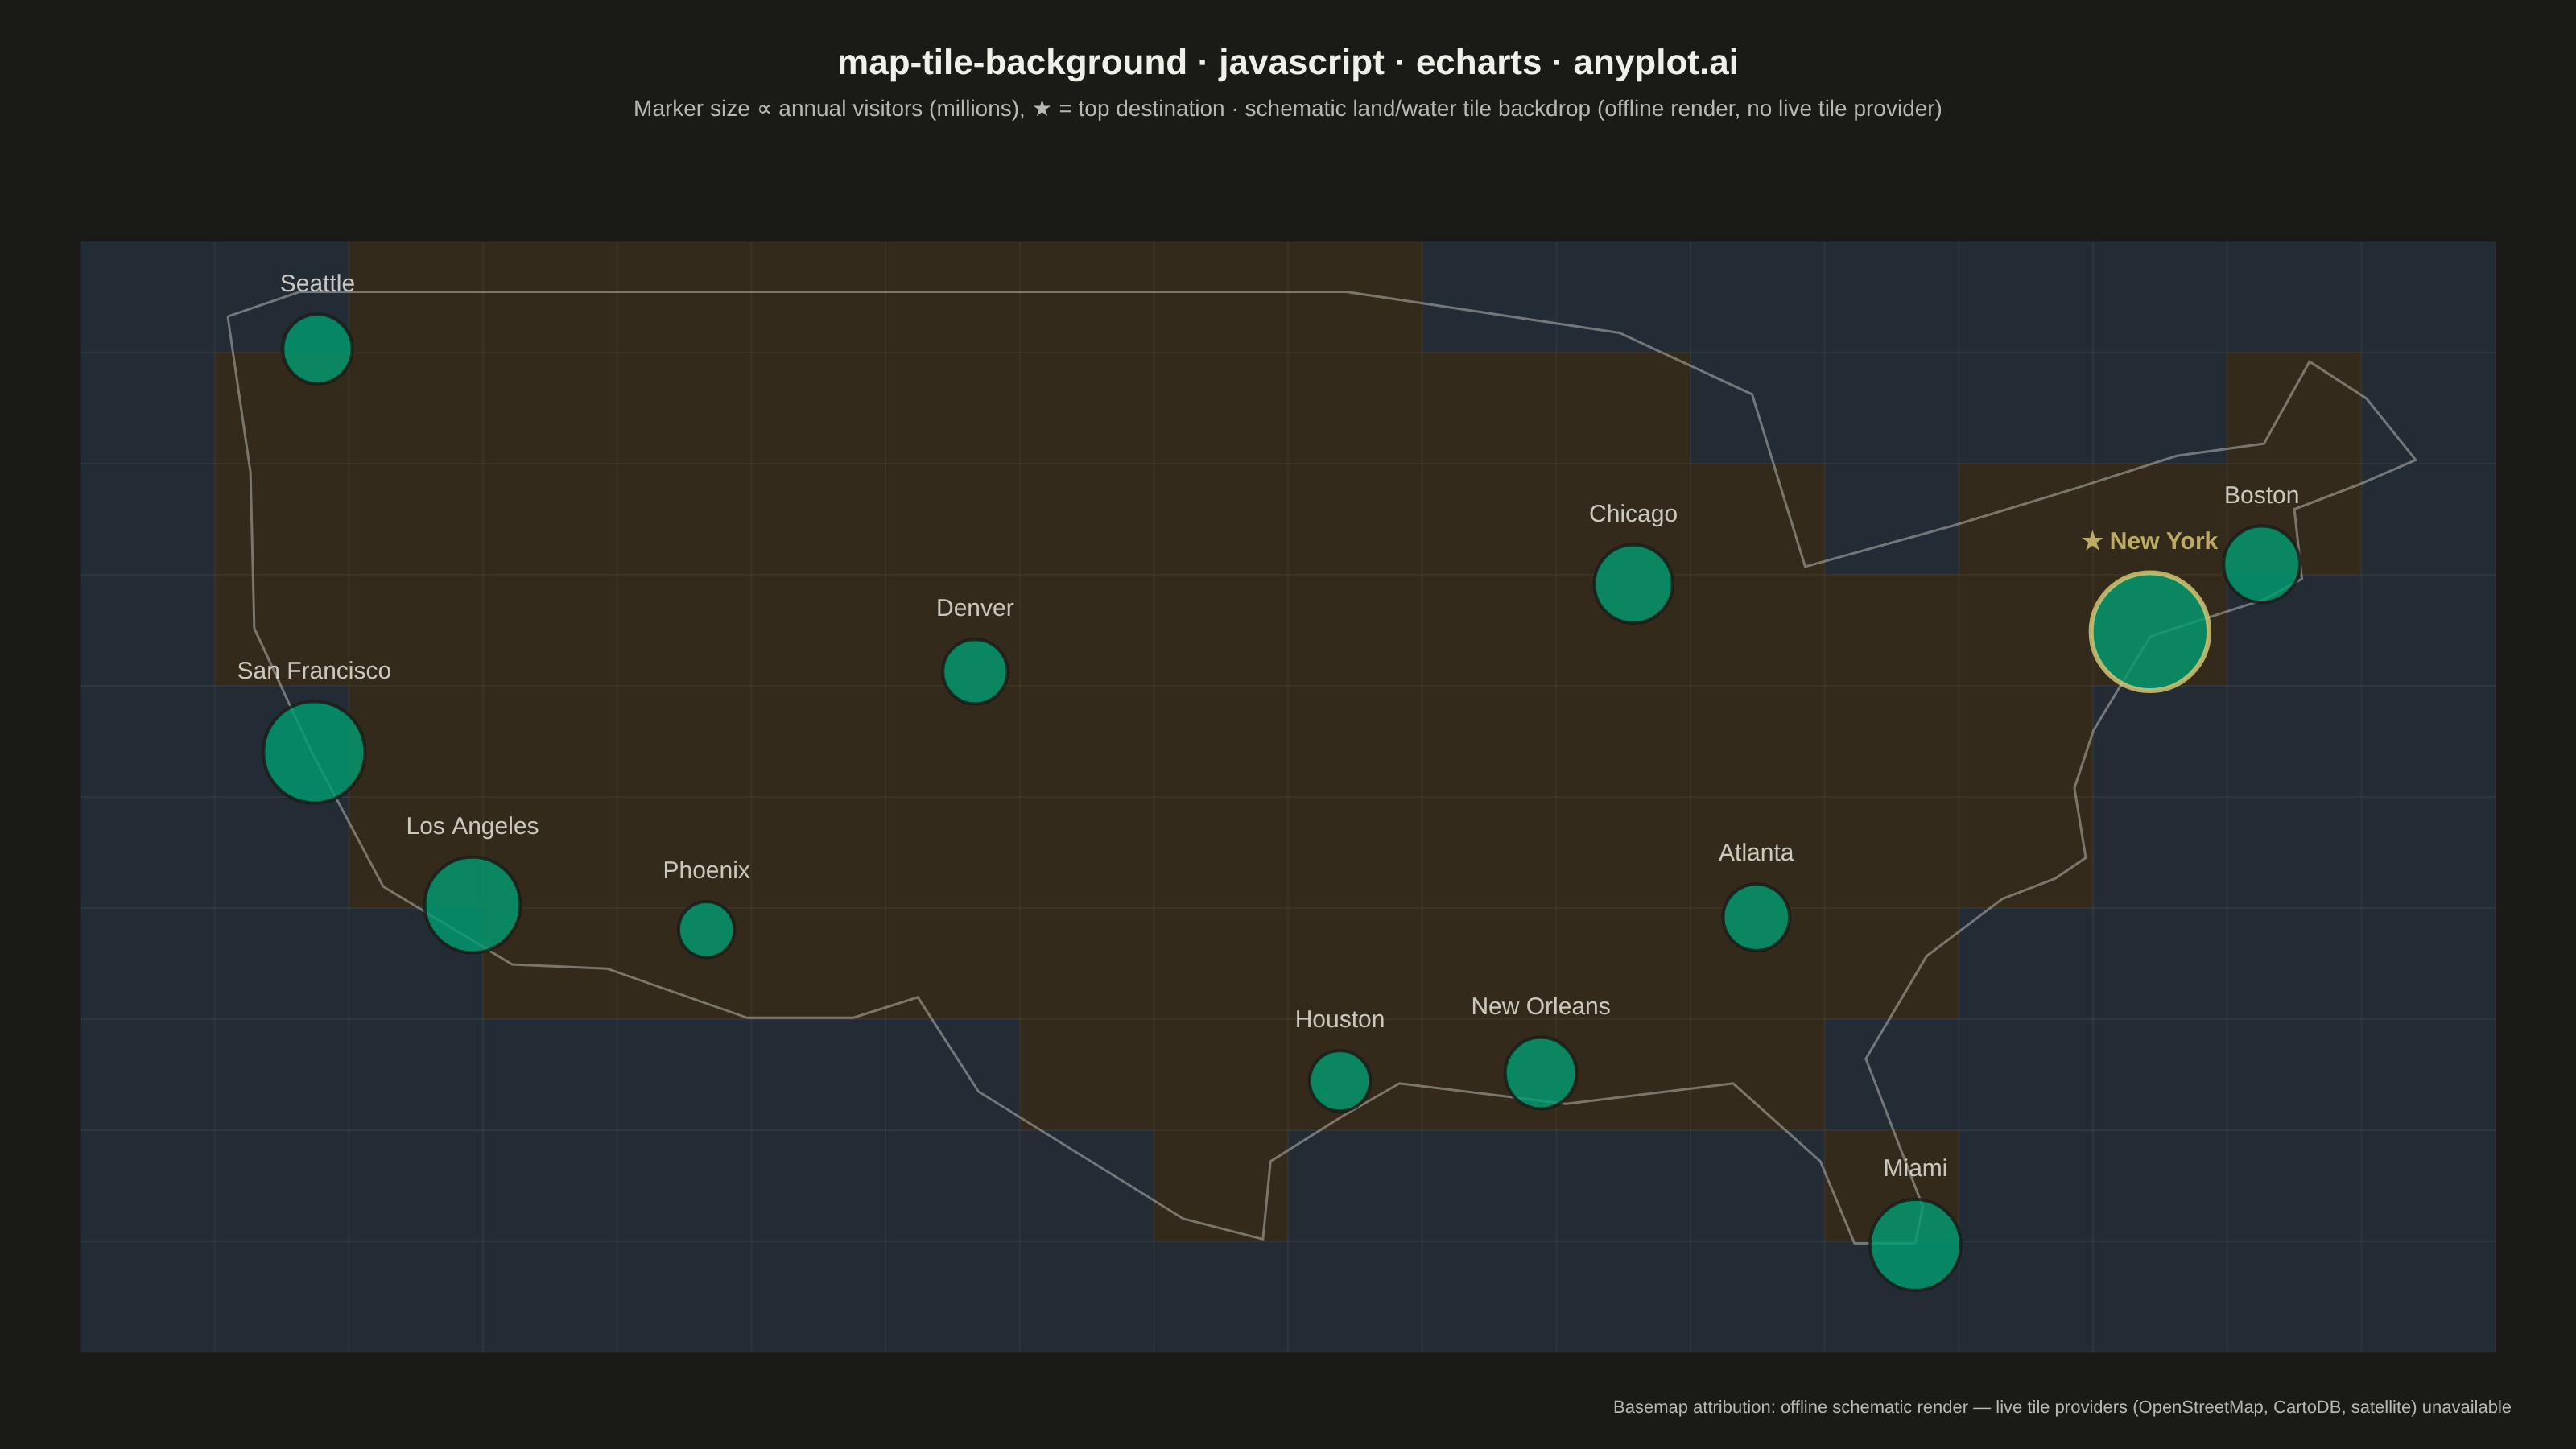
A map visualization that displays data points on top of tile-based backgrounds such as OpenStreetMap, Stamen, or satellite imagery. Unlike vector-based basemaps, tile backgrounds provide rich geographic context including street-level detail, terrain, or satellite imagery that loads dynamically as the user navigates. This visualization is essential for location-based analysis where real-world geographic context enhances data interpretation.
// anyplot.ai
// map-tile-background: Map with Tile Background
// Library: echarts 6.1.0 | JavaScript 22.23.2
// Quality: 89/100 | Created: 2026-08-26
//# anyplot-orientation: landscape

const t = window.ANYPLOT_TOKENS;

// --- Data (in-memory, deterministic) ----------------------------------------
// Major U.S. landmark cities with annual visitor counts (millions).
const cities = [
  { name: 'New York', lat: 40.7128, lon: -74.006, visitors: 8.2 },
  { name: 'Los Angeles', lat: 34.0522, lon: -118.2437, visitors: 5.9 },
  { name: 'Chicago', lat: 41.8781, lon: -87.6298, visitors: 4.1 },
  { name: 'Houston', lat: 29.7604, lon: -95.3698, visitors: 2.3 },
  { name: 'Phoenix', lat: 33.4484, lon: -112.074, visitors: 1.8 },
  { name: 'San Francisco', lat: 37.7749, lon: -122.4194, visitors: 6.5 },
  { name: 'Seattle', lat: 47.6062, lon: -122.3321, visitors: 3.2 },
  { name: 'Denver', lat: 39.7392, lon: -104.9903, visitors: 2.7 },
  { name: 'Miami', lat: 25.7617, lon: -80.1918, visitors: 5.4 },
  { name: 'Boston', lat: 42.3601, lon: -71.0589, visitors: 3.9 },
  { name: 'Atlanta', lat: 33.749, lon: -84.388, visitors: 2.9 },
  { name: 'New Orleans', lat: 29.9511, lon: -90.0715, visitors: 3.4 },
];

// Equirectangular projection with a latitude-corrected longitude scale — the
// simplest stand-in for the Web Mercator projection real slippy-map tiles use.
const meanLatRad = (cities.reduce((sum, c) => sum + c.lat, 0) / cities.length) * (Math.PI / 180);
const lonScale = Math.cos(meanLatRad);
const project = (lon, lat) => [lon * lonScale, lat];

const maxVisitors = Math.max(...cities.map(c => c.visitors));
const points = cities.map(c => {
  const isTop = c.visitors === maxVisitors;
  return {
    name: c.name,
    value: [...project(c.lon, c.lat), c.visitors],
    isTop,
    itemStyle: {
      color: t.palette[0],
      borderColor: isTop ? t.amber : t.pageBg,
      borderWidth: isTop ? 3 : 2,
    },
    label: isTop ? { fontWeight: 'bold', color: t.amber } : {},
  };
});

// Padded bounding box around the data, in projected units.
const xs = points.map(p => p.value[0]);
const ys = points.map(p => p.value[1]);
const padX = (Math.max(...xs) - Math.min(...xs)) * 0.12;
const padY = (Math.max(...ys) - Math.min(...ys)) * 0.12;
const xMin = Math.min(...xs) - padX;
const xMax = Math.max(...xs) + padX;
const yMin = Math.min(...ys) - padY;
const yMax = Math.max(...ys) + padY;

// Simplified continental-U.S. coastline / border outline (hardcoded, low-fidelity
// but geographically real — traces the Pacific coast, the Mexican border, the
// Gulf and Atlantic coasts, and the Canadian border). Used both to draw a visible
// outline over the tile backdrop and to classify each tile cell as land or water,
// so the "tile background" carries genuine geographic context even offline.
const US_OUTLINE_LONLAT = [
  [-124.7, 48.4], [-124.1, 44.6], [-124.0, 40.8], [-122.5, 37.8], [-120.6, 34.5],
  [-117.2, 32.6], [-114.7, 32.5], [-111.0, 31.3], [-108.2, 31.3], [-106.5, 31.8],
  [-104.9, 29.5], [-99.5, 26.4], [-97.4, 25.9], [-97.2, 27.8], [-95.3, 28.9],
  [-93.8, 29.7], [-89.4, 29.2], [-85.0, 29.7], [-82.7, 27.8], [-81.8, 25.8],
  [-80.2, 25.8], [-80.0, 26.7], [-81.5, 30.3], [-79.9, 32.8], [-77.9, 34.2],
  [-76.5, 34.7], [-75.7, 35.2], [-76.0, 36.9], [-75.5, 38.3], [-74.0, 40.6],
  [-71.0, 41.5], [-70.0, 42.0], [-70.2, 43.7], [-68.5, 44.3], [-67.0, 44.9],
  [-68.3, 46.4], [-69.8, 47.3], [-71.0, 45.3], [-73.3, 45.0], [-76.0, 44.2],
  [-79.2, 43.3], [-83.1, 42.3], [-84.5, 46.5], [-88.0, 48.0],
  [-95.2, 49.0], [-104.0, 49.0], [-110.0, 49.0], [-116.0, 49.0], [-122.8, 49.0],
  [-124.7, 48.4],
];
const usOutline = US_OUTLINE_LONLAT.map(([lon, lat]) => project(lon, lat));

function pointInPolygon(x, y, poly) {
  let inside = false;
  for (let i = 0, j = poly.length - 1; i < poly.length; j = i++) {
    const [xi, yi] = poly[i];
    const [xj, yj] = poly[j];
    const intersect = yi > y !== yj > y && x < ((xj - xi) * (y - yi)) / (yj - yi) + xi;
    if (intersect) inside = !inside;
  }
  return inside;
}

// Tile grid: the render harness is offline (no fetch/CDN), so a real tile
// provider (OpenStreetMap, CartoDB, satellite, …) cannot be loaded. Each cell
// is classified land/water against the coastline outline above and shaded
// accordingly, so the backdrop reads as a schematic basemap rather than a
// content-free checkerboard.
const COLS = 18;
const ROWS = 10;
const cellW = (xMax - xMin) / COLS;
const cellH = (yMax - yMin) / ROWS;
const tiles = [];
for (let row = 0; row < ROWS; row++) {
  for (let col = 0; col < COLS; col++) {
    const x0 = xMin + col * cellW;
    const y0 = yMin + row * cellH;
    const isLand = pointInPolygon(x0 + cellW / 2, y0 + cellH / 2, usOutline);
    tiles.push([x0, y0, x0 + cellW, y0 + cellH, isLand ? 1 : 0]);
  }
}

// --- Init ---------------------------------------------------------------
const chart = echarts.init(document.getElementById('container'));

// --- Option ---------------------------------------------------------------
chart.setOption({
  animation: false,
  color: t.palette,
  backgroundColor: 'transparent',
  title: {
    text: 'map-tile-background · javascript · echarts · anyplot.ai',
    subtext: 'Marker size ∝ annual visitors (millions), ★ = top destination · schematic land/water tile backdrop (offline render, no live tile provider)',
    left: 'center',
    top: 24,
    textStyle: { color: t.ink, fontSize: 22, fontWeight: 'bold' },
    subtextStyle: { color: t.inkSoft, fontSize: 14 },
  },
  grid: { left: 50, right: 50, top: 150, bottom: 60 },
  xAxis: { type: 'value', min: xMin, max: xMax, show: false },
  yAxis: { type: 'value', min: yMin, max: yMax, show: false },
  // Interactive zoom/pan (scroll to zoom, drag to pan) — invisible in the static
  // PNG but wired up for the exported HTML detail view, per the spec's request
  // for interactive libraries to support exploring the map at different scales.
  dataZoom: [{ type: 'inside', xAxisIndex: 0, yAxisIndex: 0, filterMode: 'none' }],
  graphic: {
    elements: [
      {
        type: 'text',
        right: 40,
        bottom: 20,
        style: {
          text: 'Basemap attribution: offline schematic render — live tile providers (OpenStreetMap, CartoDB, satellite) unavailable',
          fill: t.inkSoft,
          fontSize: 11,
        },
      },
    ],
  },
  series: [
    {
      // Land/water tile backdrop — see comment above.
      type: 'custom',
      coordinateSystem: 'cartesian2d',
      renderItem(params, api) {
        const p0 = api.coord([api.value(0), api.value(1)]);
        const p1 = api.coord([api.value(2), api.value(3)]);
        const isLand = api.value(4) === 1;
        return {
          type: 'rect',
          shape: {
            x: Math.min(p0[0], p1[0]),
            y: Math.min(p0[1], p1[1]),
            width: Math.abs(p1[0] - p0[0]),
            height: Math.abs(p1[1] - p0[1]),
          },
          style: {
            // Semantic land/water tint (ochre for land, blue for water) instead of a
            // near-invisible elevatedBg-vs-transparent pairing, so the schematic
            // basemap reads as terrain rather than an empty grid.
            fill: isLand ? t.palette[3] : t.palette[2],
            stroke: t.grid,
            lineWidth: 1,
            opacity: isLand ? 0.16 : 0.22,
          },
        };
      },
      data: tiles,
      encode: { x: 0, y: 1 },
      silent: true,
      z: 1,
    },
    {
      // Coastline/border outline traced on top of the tile grid.
      type: 'custom',
      coordinateSystem: 'cartesian2d',
      renderItem(params, api) {
        const pathPoints = usOutline.map(([x, y]) => api.coord([x, y]));
        return {
          type: 'polyline',
          shape: { points: pathPoints },
          style: { stroke: t.inkSoft, lineWidth: 1.5, fill: 'none', opacity: 0.55 },
        };
      },
      data: [0],
      silent: true,
      z: 2,
    },
    {
      type: 'scatter',
      coordinateSystem: 'cartesian2d',
      data: points,
      encode: { x: 0, y: 1 },
      symbolSize: val => 24 + val[2] * 6,
      itemStyle: { color: t.palette[0], borderColor: t.pageBg, borderWidth: 2 },
      label: {
        show: true,
        formatter: p => (p.data.isTop ? '★ ' : '') + p.name,
        position: 'top',
        distance: 10,
        color: t.ink,
        fontSize: 15,
      },
      labelLayout: { hideOverlap: true, moveOverlap: 'shiftY' },
      z: 3,
    },
  ],
});
Runnable source as JSON, for any HTTP client: https://api.anyplot.ai/specs/map-tile-background/echarts/code. Any spec id and library id listed in llms-full.txt fit the same URL shape; every URL below is complete and callable.
{
  "spec_id": "map-tile-background",
  "language": "javascript",
  "library": "echarts",
  "page": "https://anyplot.ai/map-tile-background/javascript/echarts",
  "hub": "https://anyplot.ai/map-tile-background",
  "code_json": "https://api.anyplot.ai/specs/map-tile-background/echarts/code",
  "spec_json": "https://api.anyplot.ai/specs/map-tile-background",
  "render_light_png": "https://storage.googleapis.com/anyplot-images/plots/map-tile-background/javascript/echarts/plot-light.png",
  "render_dark_png": "https://storage.googleapis.com/anyplot-images/plots/map-tile-background/javascript/echarts/plot-dark.png",
  "interactive_light_html": "https://storage.googleapis.com/anyplot-images/plots/map-tile-background/javascript/echarts/plot-light.html",
  "interactive_dark_html": "https://storage.googleapis.com/anyplot-images/plots/map-tile-background/javascript/echarts/plot-dark.html",
  "quality_score": 89.0,
  "license": "MIT",
  "guide": "https://anyplot.ai/llms.txt"
}
Part of Map with Tile Background on anyplot.ai.