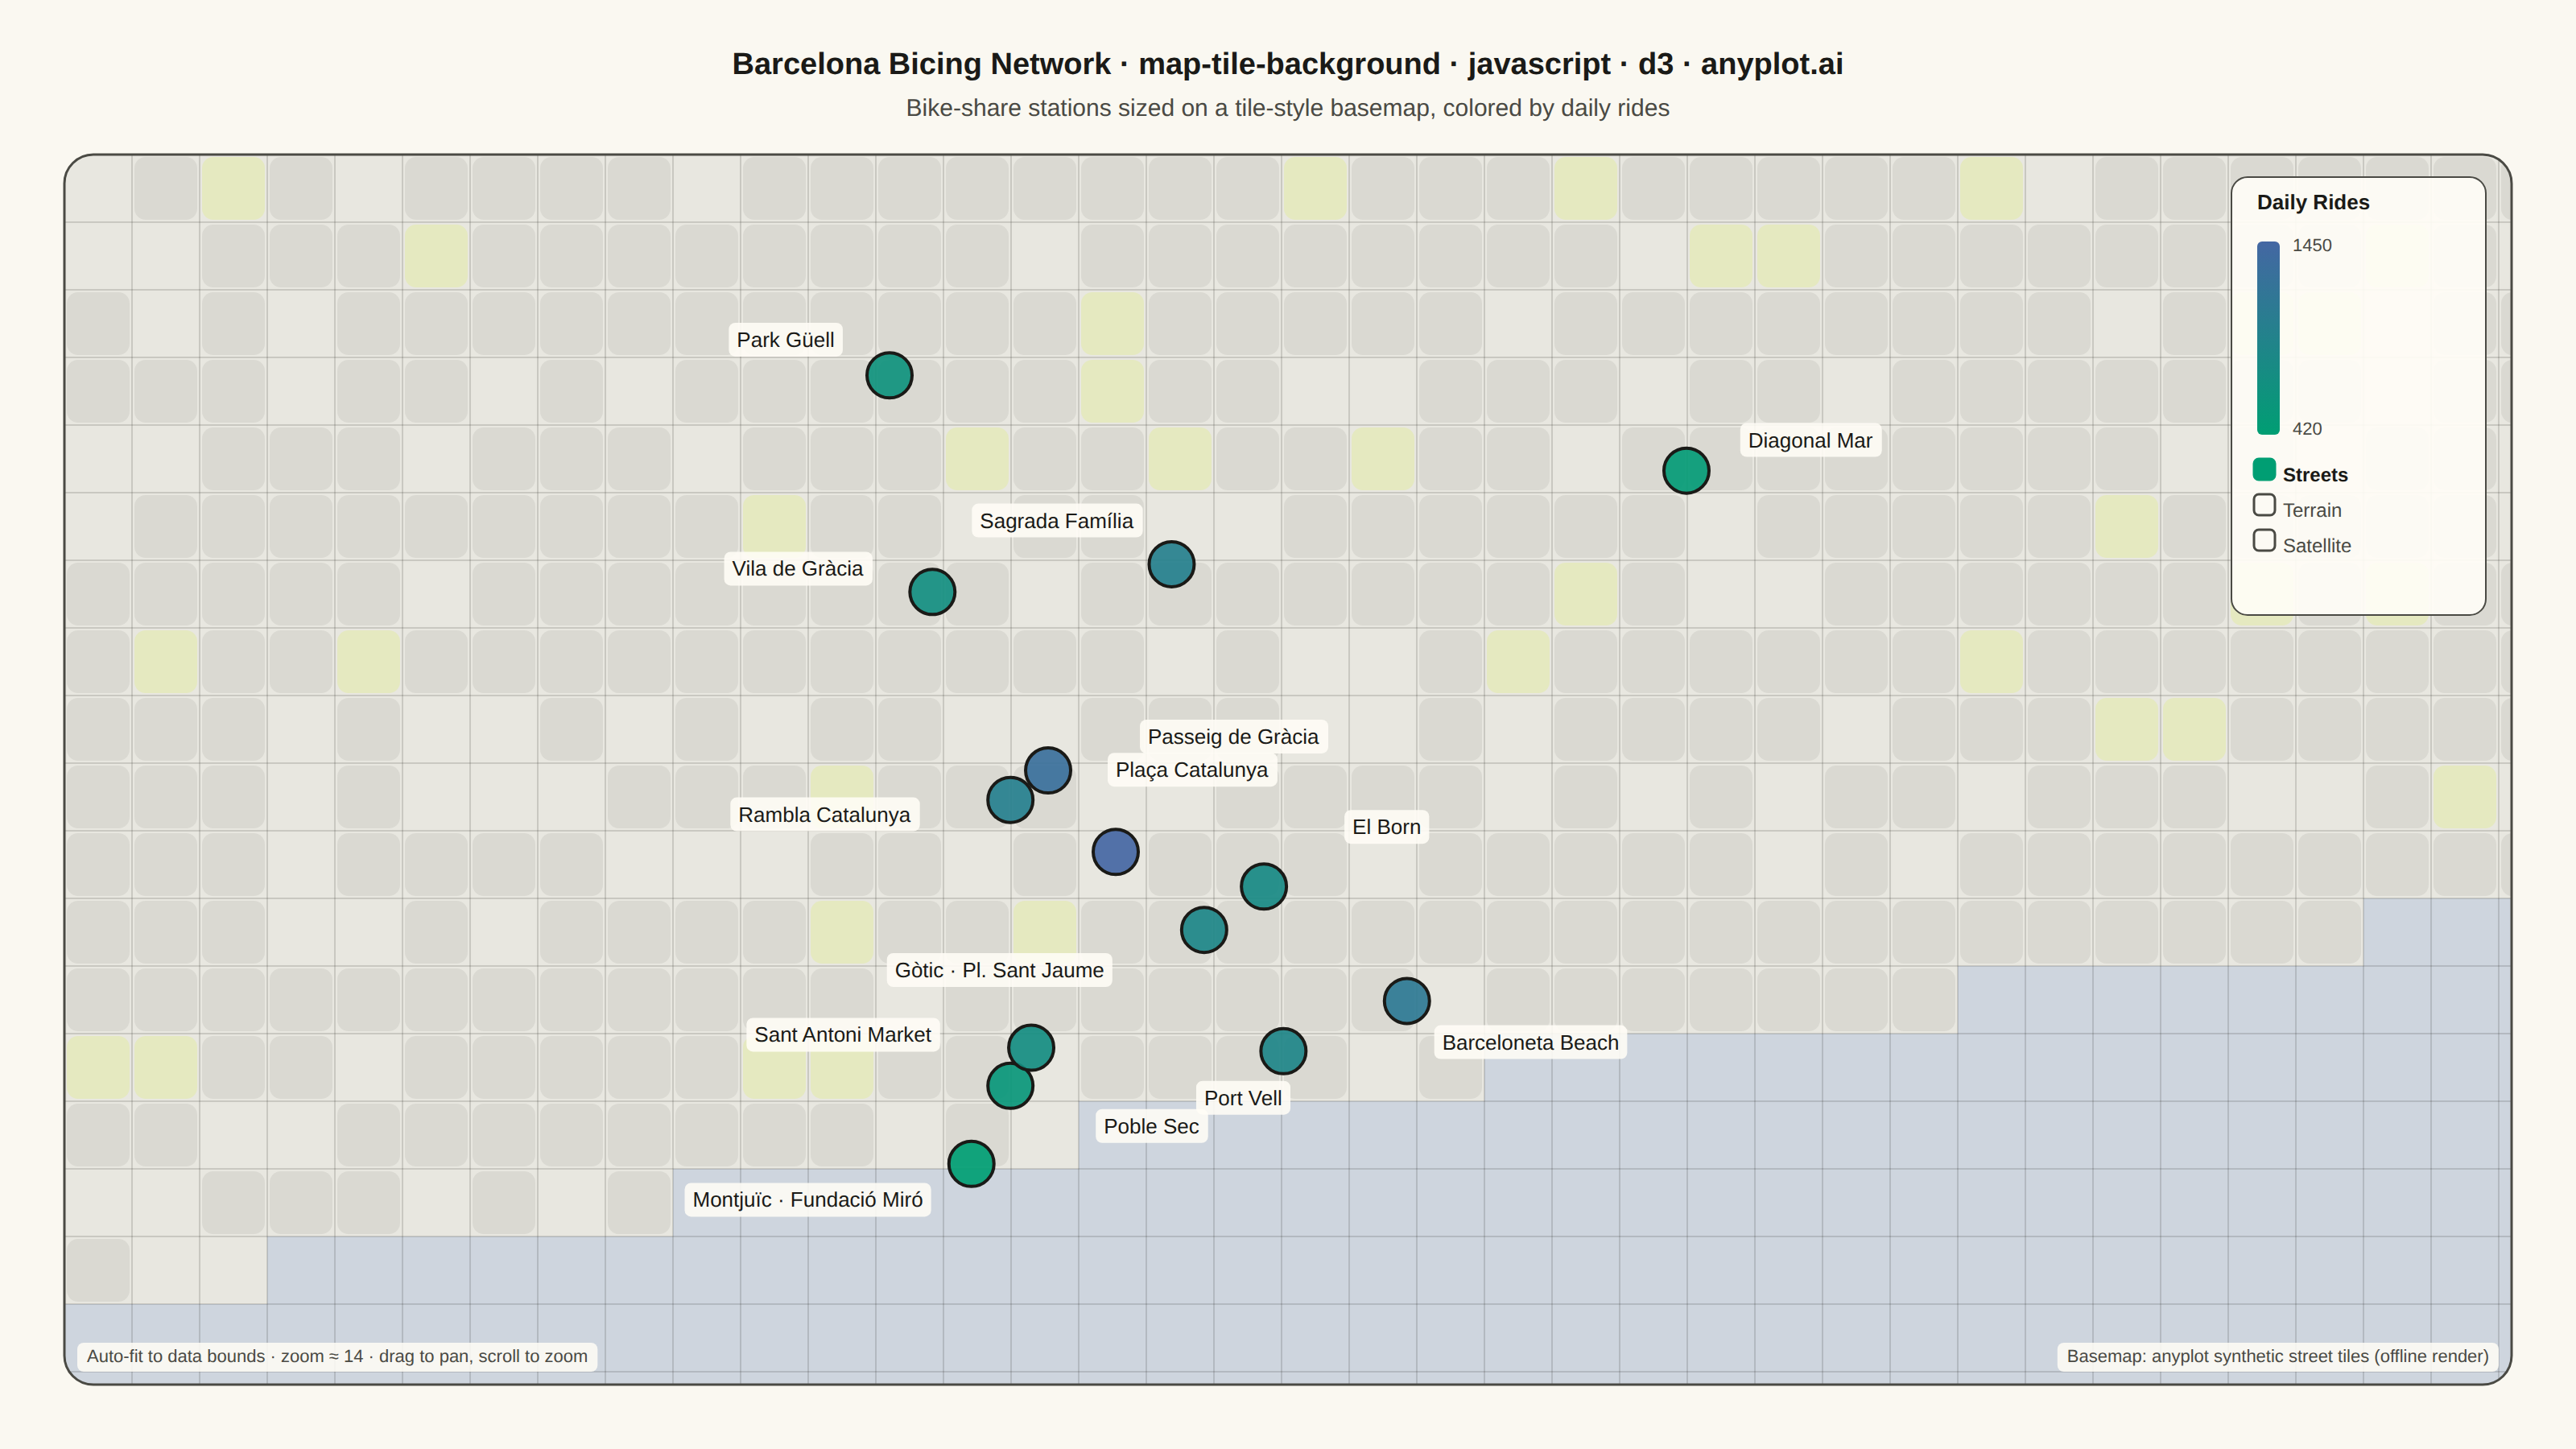
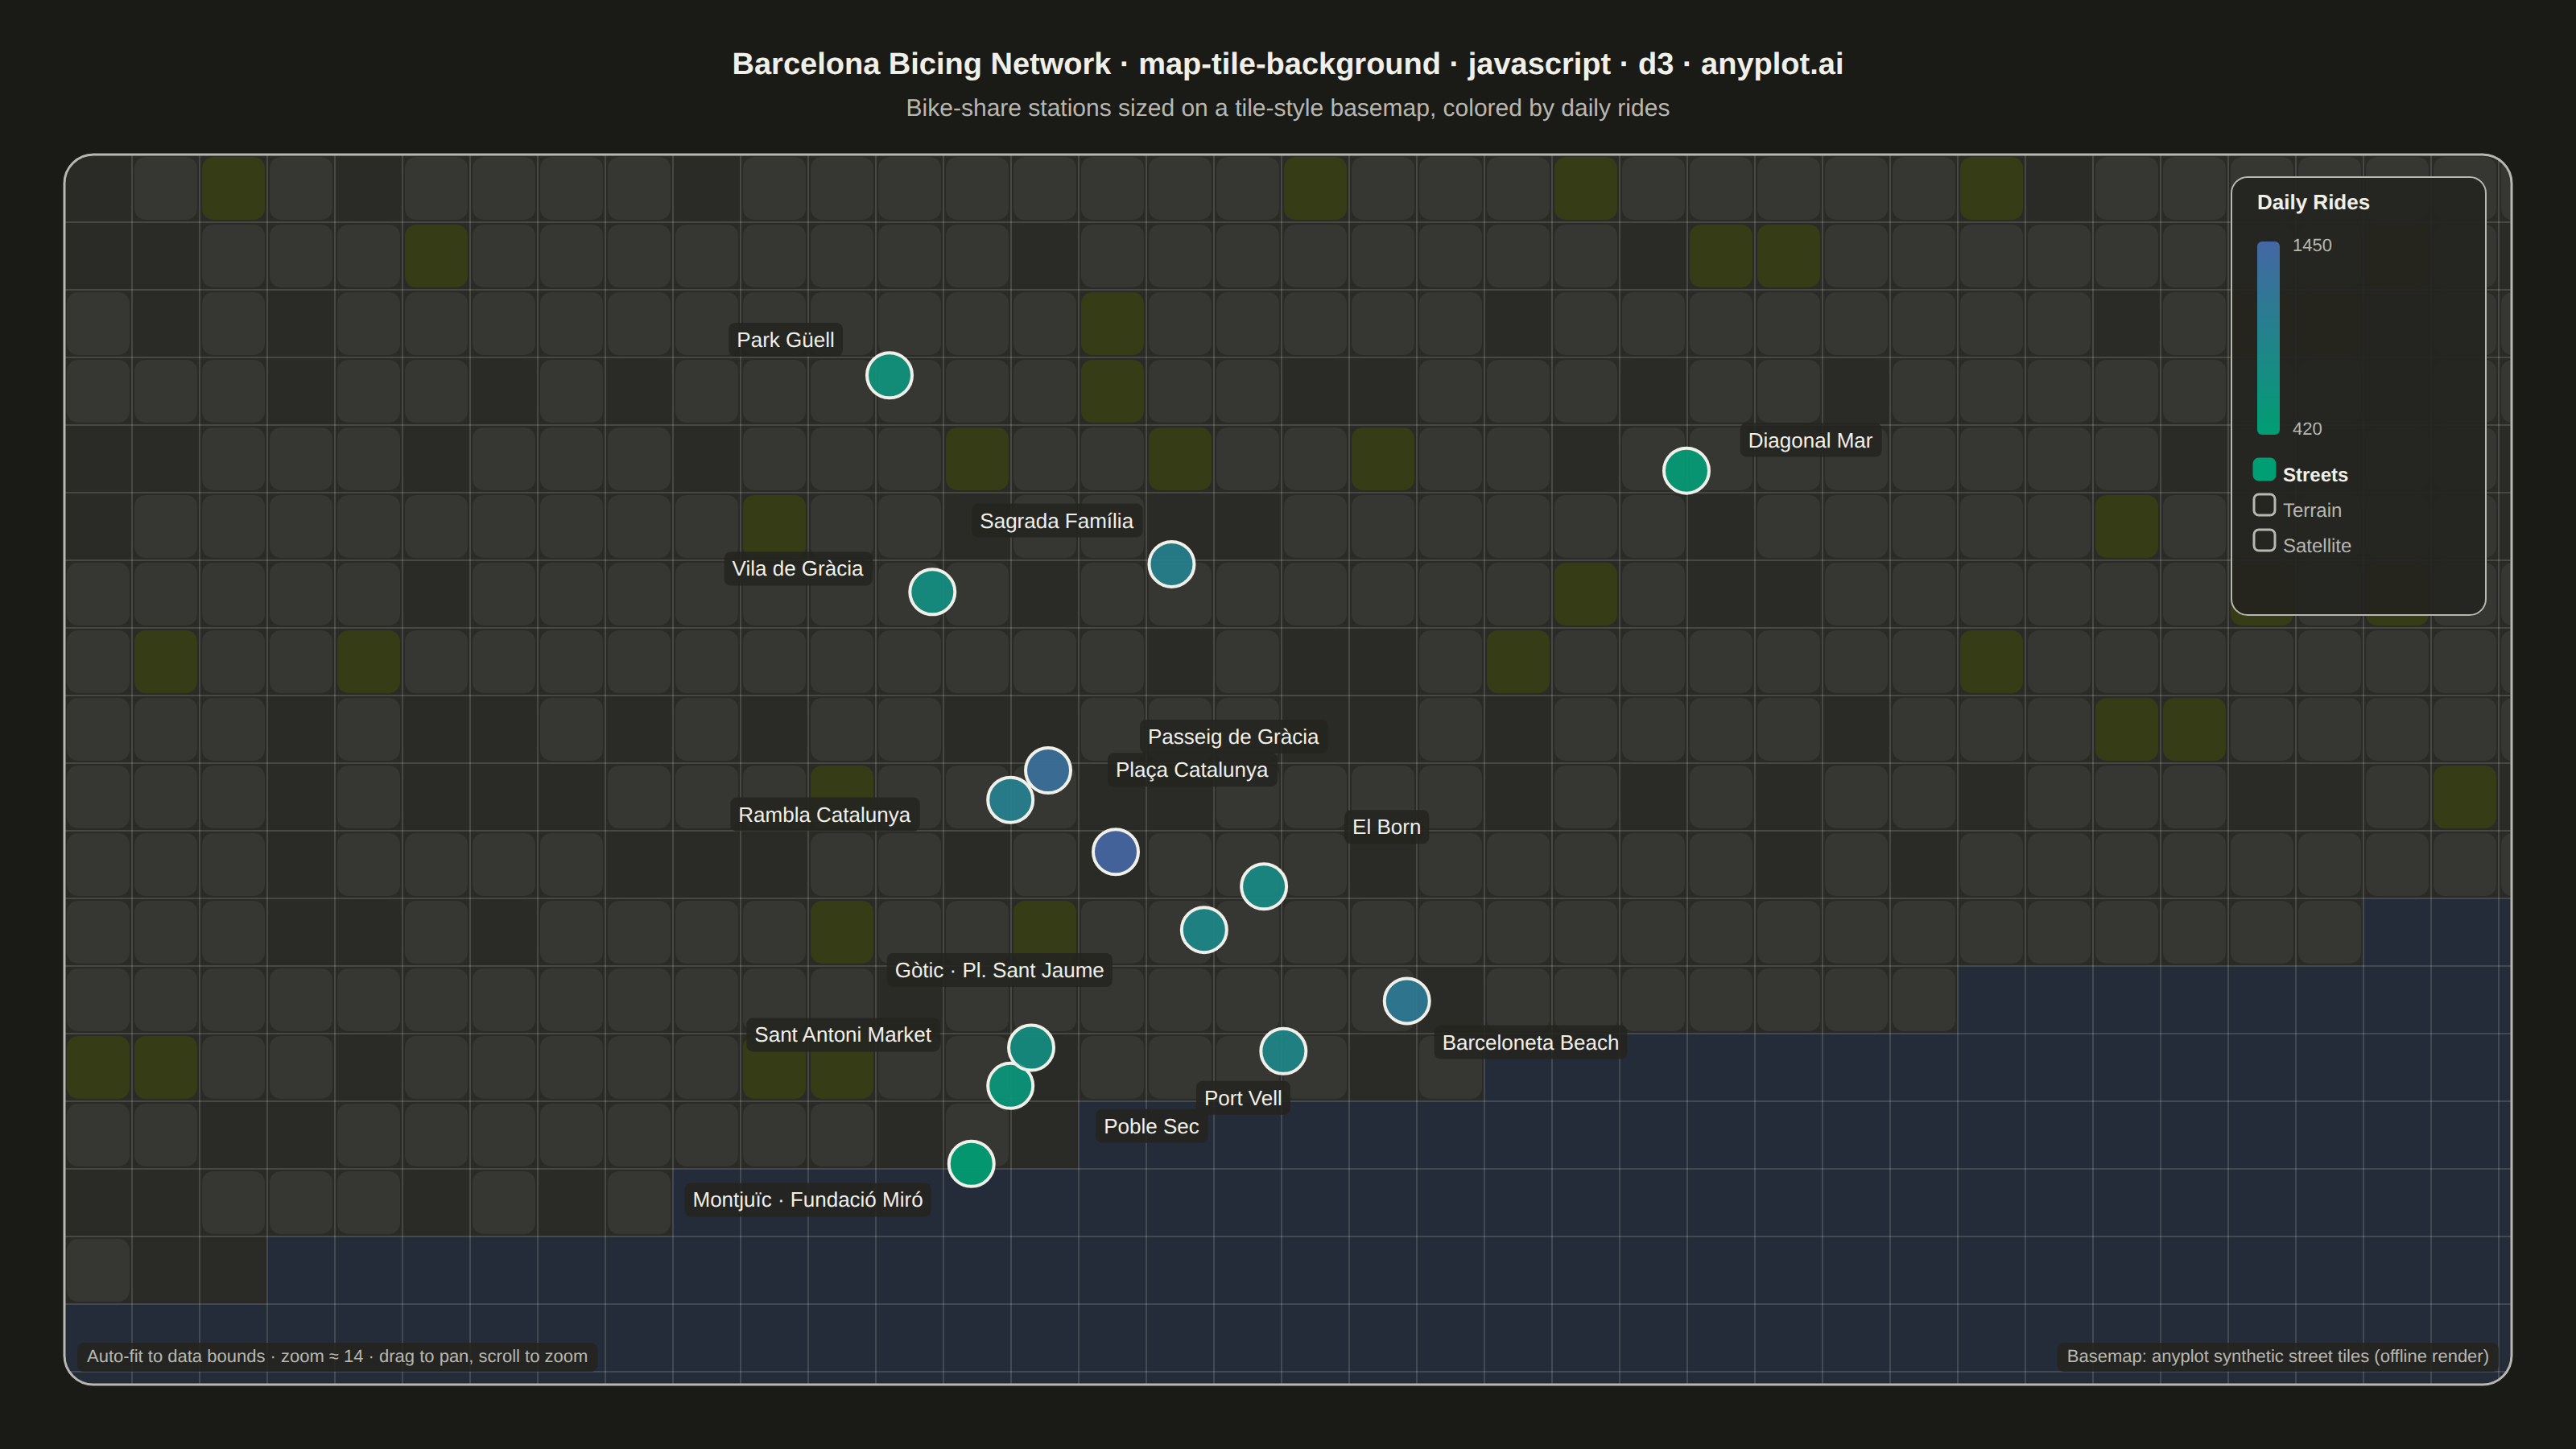
The same plot in 12 other libraries — JavaScript: Chart.js, Apache ECharts; Python: Altair, Bokeh, lets-plot, Matplotlib, Plotly, plotnine, Pygal, Seaborn; R: ggplot2; Julia: Makie.jl. Compare all 13 side by side: Map with Tile Background in Python, R, Julia and JavaScript.
A map visualization that displays data points on top of tile-based backgrounds such as OpenStreetMap, Stamen, or satellite imagery. Unlike vector-based basemaps, tile backgrounds provide rich geographic context including street-level detail, terrain, or satellite imagery that loads dynamically as the user navigates. This visualization is essential for location-based analysis where real-world geographic context enhances data interpretation.
// anyplot.ai
// map-tile-background: Map with Tile Background
// Library: d3 7.9.0 | JavaScript 22.23.2
// Quality: 91/100 | Created: 2026-08-26

const t = window.ANYPLOT_TOKENS;
const { width, height } = window.ANYPLOT_SIZE;

// --- Data: Barcelona Bicing bike-share stations, daily rides ---------------
// The runtime is offline (no fetch/CDN), so the "tile background" below is a
// deterministic, procedurally generated street-grid basemap rather than a
// fetched OSM/CartoDB raster — see the block-hash generator further down.
// Pan/zoom (d3.zoom on the map group) and the provider switcher below are
// genuine interactions in the exported HTML, not decorative placeholders.
const stations = [
  { label: "Plaça Catalunya", lat: 41.387, lon: 2.1701, rides: 1450 },
  { label: "Passeig de Gràcia", lat: 41.3917, lon: 2.1649, rides: 1280 },
  { label: "Rambla Catalunya", lat: 41.39, lon: 2.162, rides: 990 },
  { label: "Sagrada Família", lat: 41.4036, lon: 2.1744, rides: 980 },
  { label: "Barceloneta Beach", lat: 41.3784, lon: 2.1925, rides: 1120 },
  { label: "Gòtic · Pl. Sant Jaume", lat: 41.3825, lon: 2.1769, rides: 860 },
  { label: "Park Güell", lat: 41.4145, lon: 2.1527, rides: 640 },
  { label: "El Born", lat: 41.385, lon: 2.1815, rides: 790 },
  { label: "Montjuïc · Fundació Miró", lat: 41.369, lon: 2.159, rides: 420 },
  { label: "Poble Sec", lat: 41.3735, lon: 2.162, rides: 560 },
  { label: "Vila de Gràcia", lat: 41.402, lon: 2.156, rides: 710 },
  { label: "Diagonal Mar", lat: 41.409, lon: 2.214, rides: 480 },
  { label: "Port Vell", lat: 41.3755, lon: 2.183, rides: 870 },
  { label: "Sant Antoni Market", lat: 41.3757, lon: 2.1636, rides: 730 },
];

// --- Layout ------------------------------------------------------------
const margin = { top: 96, right: 40, bottom: 40, left: 40 };
const mapX0 = margin.left;
const mapY0 = margin.top;
const mapX1 = width - margin.right;
const mapY1 = height - margin.bottom;
const mapW = mapX1 - mapX0;
const mapH = mapY1 - mapY0;

// --- Fit-bounds projection (equirectangular, latitude-corrected) -----------
// Auto-fits the initial view to the padded data extent, the way a real tile
// map's fitBounds() call would before picking a zoom level.
const lats = stations.map((d) => d.lat);
const lons = stations.map((d) => d.lon);
let latMin = d3.min(lats);
let latMax = d3.max(lats);
let lonMin = d3.min(lons);
let lonMax = d3.max(lons);
const latPad = Math.max((latMax - latMin) * 0.28, 0.008);
const lonPad = Math.max((lonMax - lonMin) * 0.28, 0.008);
latMin -= latPad;
latMax += latPad;
lonMin -= lonPad;
lonMax += lonPad;

const cosLat = Math.cos(((latMin + latMax) / 2) * (Math.PI / 180));
const geoW = (lonMax - lonMin) * cosLat;
const geoH = latMax - latMin;
const fitScale = Math.min(mapW / geoW, mapH / geoH);
const projW = geoW * fitScale;
const projH = geoH * fitScale;
const offX = mapX0 + (mapW - projW) / 2;
const offY = mapY0 + (mapH - projH) / 2;

const projX = (lon) => offX + (lon - lonMin) * cosLat * fitScale;
const projY = (lat) => offY + (latMax - lat) * fitScale;

const zoomLevel = Math.max(10, Math.min(18, Math.round(Math.log2((360 * mapW) / (256 * (lonMax - lonMin))))));

// --- Basemap tones (theme-adaptive, decorative — not data colors) ----------
// Derived from the Imprint chrome/categorical tokens by blending toward the
// page background, instead of introducing custom hex values.
const blend = (hex, amt) => d3.interpolateRgb(t.pageBg, hex)(amt);
const providers = ["Streets", "Terrain", "Satellite"];
const tones = {
  Streets: {
    land: blend(t.inkSoft, 0.1),
    block: blend(t.inkSoft, 0.18),
    park: blend(t.palette[7], 0.22), // lime
    water: blend(t.palette[2], 0.24), // blue
  },
  Terrain: {
    land: blend(t.palette[7], 0.16), // lime
    block: blend(t.palette[7], 0.28),
    park: blend(t.palette[7], 0.42),
    water: blend(t.palette[2], 0.26),
  },
  Satellite: {
    land: blend(t.palette[2], 0.28), // blue
    block: blend(t.palette[5], 0.3), // cyan
    park: blend(t.palette[7], 0.26),
    water: blend(t.palette[2], 0.48),
  },
};
let activeProvider = "Streets";
const streetStroke = t.grid;

// --- SVG mount ---------------------------------------------------------
const svg = d3.select("#container").append("svg").attr("width", width).attr("height", height);

svg
  .append("clipPath")
  .attr("id", "map-viewport")
  .append("rect")
  .attr("x", mapX0)
  .attr("y", mapY0)
  .attr("width", mapW)
  .attr("height", mapH)
  .attr("rx", 18);

const mapG = svg.append("g").attr("clip-path", "url(#map-viewport)");

// Static land base — always fills the viewport regardless of pan/zoom, the
// way a real tile layer falls back to a base color while tiles load.
const bgRect = mapG
  .append("rect")
  .attr("x", mapX0)
  .attr("y", mapY0)
  .attr("width", mapW)
  .attr("height", mapH)
  .attr("fill", tones[activeProvider].land);

// Everything that should pan/zoom together lives inside this group.
const zoomLayer = mapG.append("g").attr("class", "zoom-layer");

// --- Synthetic tile texture: deterministic street-grid basemap -------------
// Fixed-hash pseudo-noise (no Math.random) so the "tiles" are reproducible.
// Evokes Barcelona's Eixample grid blocks, with a coastline band toward the
// bottom-right standing in for the Mediterranean. The grid extends a buffer
// of cells beyond the viewport so panning/zooming still reveals basemap
// texture instead of bare background.
function blockHash(i, j) {
  const s = Math.sin(i * 12.9898 + j * 78.233) * 43758.5453;
  return s - Math.floor(s);
}

const cell = 42;
const gap = 3;
const bufferCells = 4;
const cols = Math.ceil(mapW / cell) + 1 + bufferCells * 2;
const rows = Math.ceil(mapH / cell) + 1 + bufferCells * 2;

const blocks = [];
for (let j = 0; j < rows; j += 1) {
  for (let i = 0; i < cols; i += 1) {
    const gx = mapX0 + (i - bufferCells) * cell;
    const gy = mapY0 + (j - bufferCells) * cell;
    const u = (gx - mapX0) / mapW;
    const v = (gy - mapY0) / mapH;
    const isWater = u * 0.32 + v > 0.9;
    const h = blockHash(i, j);
    let kind = null;
    if (isWater) kind = "water";
    else if (h > 0.94) kind = "park";
    else if (h > 0.2) kind = "block";
    if (kind) blocks.push({ x: gx, y: gy, kind, isWater });
  }
}

const blockSel = zoomLayer
  .selectAll("rect.block")
  .data(blocks)
  .join("rect")
  .attr("class", "block")
  .attr("x", (d) => d.x + (d.isWater ? 0 : gap / 2))
  .attr("y", (d) => d.y + (d.isWater ? 0 : gap / 2))
  .attr("width", (d) => cell - (d.isWater ? 0 : gap))
  .attr("height", (d) => cell - (d.isWater ? 0 : gap))
  .attr("rx", (d) => (d.isWater ? 0 : 7))
  .attr("fill", (d) => tones[activeProvider][d.kind]);

const streetLines = [];
for (let i = 0; i <= cols; i += 1) {
  const gx = mapX0 + (i - bufferCells) * cell;
  streetLines.push({ x1: gx, y1: mapY0 - bufferCells * cell, x2: gx, y2: mapY1 + bufferCells * cell });
}
for (let j = 0; j <= rows; j += 1) {
  const gy = mapY0 + (j - bufferCells) * cell;
  streetLines.push({ x1: mapX0 - bufferCells * cell, y1: gy, x2: mapX1 + bufferCells * cell, y2: gy });
}

zoomLayer
  .selectAll("line.street")
  .data(streetLines)
  .join("line")
  .attr("class", "street")
  .attr("x1", (d) => d.x1)
  .attr("y1", (d) => d.y1)
  .attr("x2", (d) => d.x2)
  .attr("y2", (d) => d.y2)
  .attr("stroke", streetStroke)
  .attr("stroke-width", 1);

// --- Station markers: color-encode daily rides via imprint_seq -------------
const rideExtent = d3.extent(stations, (d) => d.rides);
const colorScale = d3.scaleSequential(d3.interpolateRgbBasis(t.seq)).domain(rideExtent);
const markerR = 14;

zoomLayer
  .selectAll("circle.station")
  .data(stations)
  .join("circle")
  .attr("class", "station")
  .attr("cx", (d) => projX(d.lon))
  .attr("cy", (d) => projY(d.lat))
  .attr("r", markerR)
  .attr("fill", (d) => colorScale(d.rides))
  .attr("stroke", t.ink)
  .attr("stroke-width", 2)
  .attr("fill-opacity", 0.92);

// --- Station labels: radial placement + measured halo for legibility -------
// The five stations in the dense central cluster (Plaça Catalunya, Passeig de
// Gràcia, Rambla Catalunya, El Born, Gòtic) sit under 300m apart (real
// Barcelona geography) and get explicit directional offsets, chosen to spread
// them apart rather than relying on the generic radial push; two more crowded
// stations (Sant Antoni Market, Poble Sec) get the same treatment.
const manualOffsets = {
  "Plaça Catalunya": [0, -50],
  "Passeig de Gràcia": [62, -20],
  "Rambla Catalunya": [-62, 10],
  "El Born": [55, -36],
  "Gòtic · Pl. Sant Jaume": [-62, 26],
  "Sant Antoni Market": [-62, -7],
  "Poble Sec": [58, 26],
};

const centerX = mapX0 + mapW / 2;
const centerY = mapY0 + mapH / 2;
const labelG = zoomLayer.append("g");

for (const d of stations) {
  const px = projX(d.lon);
  const py = projY(d.lat);
  let lx;
  let ly;
  let anchor;
  if (manualOffsets[d.label]) {
    const [ox, oy] = manualOffsets[d.label];
    lx = px + ox;
    ly = py + oy;
    anchor = ox >= 0 ? "start" : "end";
  } else {
    const dx = px - centerX;
    const dy = py - centerY;
    const norm = Math.hypot(dx, dy) || 1;
    lx = px + (dx / norm) * 48;
    ly = py + (dy / norm) * 30;
    anchor = dx >= 0 ? "start" : "end";
  }

  const grp = labelG.append("g");
  const text = grp
    .append("text")
    .attr("x", lx)
    .attr("y", ly)
    .attr("text-anchor", anchor)
    .attr("dominant-baseline", "middle")
    .style("font-size", "13px")
    .style("font-weight", "500")
    .attr("fill", t.ink)
    .text(d.label);

  const bbox = text.node().getBBox();
  grp
    .insert("rect", "text")
    .attr("x", bbox.x - 5)
    .attr("y", bbox.y - 3)
    .attr("width", bbox.width + 10)
    .attr("height", bbox.height + 6)
    .attr("rx", 4)
    .attr("fill", t.elevatedBg)
    .attr("fill-opacity", 0.88);
}

// Map viewport frame (drawn above the zoom layer, stays fixed while panning)
svg
  .append("rect")
  .attr("x", mapX0)
  .attr("y", mapY0)
  .attr("width", mapW)
  .attr("height", mapH)
  .attr("rx", 18)
  .attr("fill", "none")
  .attr("stroke", t.inkSoft)
  .attr("stroke-width", 1.5);

// --- Pan & zoom: d3.zoom() on a capture rect drives the map group ----------
const zoomBehavior = d3
  .zoom()
  .scaleExtent([1, 4])
  .extent([
    [mapX0, mapY0],
    [mapX1, mapY1],
  ])
  .translateExtent([
    [mapX0 - bufferCells * cell, mapY0 - bufferCells * cell],
    [mapX1 + bufferCells * cell, mapY1 + bufferCells * cell],
  ])
  .on("zoom", (event) => {
    zoomLayer.attr("transform", event.transform);
  });

mapG
  .append("rect")
  .attr("class", "zoom-capture")
  .attr("x", mapX0)
  .attr("y", mapY0)
  .attr("width", mapW)
  .attr("height", mapH)
  .attr("fill", "transparent")
  .style("pointer-events", "all")
  .style("cursor", "grab")
  .call(zoomBehavior);

// --- Legend: rides color scale + functional tile-provider switcher ---------
const legendX = mapX1 - 158;
const legendBarY = mapY0 + 54;
const legendBarH = 120;
const legendBoxH = 54 + legendBarH + 20 + providers.length * 22 + 12;

svg
  .append("rect")
  .attr("x", legendX - 16)
  .attr("y", mapY0 + 14)
  .attr("width", 158)
  .attr("height", legendBoxH)
  .attr("rx", 10)
  .attr("fill", t.elevatedBg)
  .attr("fill-opacity", 0.92)
  .attr("stroke", t.inkSoft)
  .attr("stroke-width", 1);

svg
  .append("text")
  .attr("x", legendX)
  .attr("y", mapY0 + 34)
  .style("font-size", "13px")
  .style("font-weight", "600")
  .attr("fill", t.ink)
  .text("Daily Rides");

svg
  .append("defs")
  .append("linearGradient")
  .attr("id", "rides-gradient")
  .attr("x1", "0%")
  .attr("y1", "100%")
  .attr("x2", "0%")
  .attr("y2", "0%")
  .selectAll("stop")
  .data([0, 1])
  .join("stop")
  .attr("offset", (d) => `${d * 100}%`)
  .attr("stop-color", (d) => t.seq[d]);

svg
  .append("rect")
  .attr("x", legendX)
  .attr("y", legendBarY)
  .attr("width", 14)
  .attr("height", legendBarH)
  .attr("rx", 3)
  .attr("fill", "url(#rides-gradient)");

svg
  .append("text")
  .attr("x", legendX + 22)
  .attr("y", legendBarY + 6)
  .style("font-size", "11px")
  .attr("fill", t.inkSoft)
  .text(rideExtent[1]);

svg
  .append("text")
  .attr("x", legendX + 22)
  .attr("y", legendBarY + legendBarH)
  .style("font-size", "11px")
  .attr("fill", t.inkSoft)
  .text(rideExtent[0]);

// Tile-provider switcher — clicking a provider re-tints the basemap group
// (bgRect + block fills) via the `tones` lookup; fully offline/deterministic,
// no live tile fetch.
const providerY0 = legendBarY + legendBarH + 26;
const providerRows = providers.map((name, idx) => {
  const py = providerY0 + idx * 22;
  const row = svg.append("g").style("cursor", "pointer").on("click", () => setProvider(name));
  const swatch = row
    .append("rect")
    .attr("x", legendX - 2)
    .attr("y", py - 11)
    .attr("width", 13)
    .attr("height", 13)
    .attr("rx", 3);
  const label = row
    .append("text")
    .attr("x", legendX + 16)
    .attr("y", py)
    .attr("dominant-baseline", "middle")
    .style("font-size", "12px");
  return { name, swatch, label };
});

function setProvider(name) {
  activeProvider = name;
  bgRect.attr("fill", tones[name].land);
  blockSel.attr("fill", (d) => tones[name][d.kind]);
  for (const row of providerRows) {
    const isActive = row.name === name;
    row.swatch
      .attr("fill", isActive ? t.palette[0] : "none")
      .attr("stroke", isActive ? t.palette[0] : t.inkSoft)
      .attr("stroke-width", 1.5);
    row.label
      .style("font-weight", isActive ? "600" : "400")
      .attr("fill", isActive ? t.ink : t.inkSoft)
      .text(row.name);
  }
}
setProvider(activeProvider);

// --- Auto-fit / attribution footnotes (bottom corners, inside viewport) ----
function footnote(x, anchor, str) {
  const grp = svg.append("g");
  const text = grp
    .append("text")
    .attr("x", x)
    .attr("y", mapY1 - 14)
    .attr("text-anchor", anchor)
    .style("font-size", "11px")
    .attr("fill", t.inkSoft)
    .text(str);
  const bbox = text.node().getBBox();
  grp
    .insert("rect", "text")
    .attr("x", bbox.x - 6)
    .attr("y", bbox.y - 3)
    .attr("width", bbox.width + 12)
    .attr("height", bbox.height + 6)
    .attr("rx", 4)
    .attr("fill", t.elevatedBg)
    .attr("fill-opacity", 0.85);
}
footnote(mapX0 + 14, "start", `Auto-fit to data bounds · zoom ≈ ${zoomLevel} · drag to pan, scroll to zoom`);
footnote(mapX1 - 14, "end", "Basemap: anyplot synthetic street tiles (offline render)");

// --- Title -------------------------------------------------------------
const title = "Barcelona Bicing Network · map-tile-background · javascript · d3 · anyplot.ai";
const titleFontSize = Math.min(22, Math.round((22 * 67) / title.length));
svg
  .append("text")
  .attr("x", width / 2)
  .attr("y", 46)
  .attr("text-anchor", "middle")
  .attr("fill", t.ink)
  .style("font-size", `${titleFontSize}px`)
  .style("font-weight", "600")
  .text(title);

svg
  .append("text")
  .attr("x", width / 2)
  .attr("y", 72)
  .attr("text-anchor", "middle")
  .attr("fill", t.inkSoft)
  .style("font-size", "15px")
  .text("Bike-share stations sized on a tile-style basemap, colored by daily rides");
Runnable source as JSON, for any HTTP client: https://api.anyplot.ai/specs/map-tile-background/d3/code. Any spec id and library id listed in llms-full.txt fit the same URL shape; every URL below is complete and callable.
{
  "spec_id": "map-tile-background",
  "language": "javascript",
  "library": "d3",
  "page": "https://anyplot.ai/map-tile-background/javascript/d3",
  "hub": "https://anyplot.ai/map-tile-background",
  "code_json": "https://api.anyplot.ai/specs/map-tile-background/d3/code",
  "spec_json": "https://api.anyplot.ai/specs/map-tile-background",
  "render_light_png": "https://storage.googleapis.com/anyplot-images/plots/map-tile-background/javascript/d3/plot-light.png",
  "render_dark_png": "https://storage.googleapis.com/anyplot-images/plots/map-tile-background/javascript/d3/plot-dark.png",
  "interactive_light_html": "https://storage.googleapis.com/anyplot-images/plots/map-tile-background/javascript/d3/plot-light.html",
  "interactive_dark_html": "https://storage.googleapis.com/anyplot-images/plots/map-tile-background/javascript/d3/plot-dark.html",
  "quality_score": 91.0,
  "license": "MIT",
  "guide": "https://anyplot.ai/llms.txt"
}
Part of Map with Tile Background on anyplot.ai.