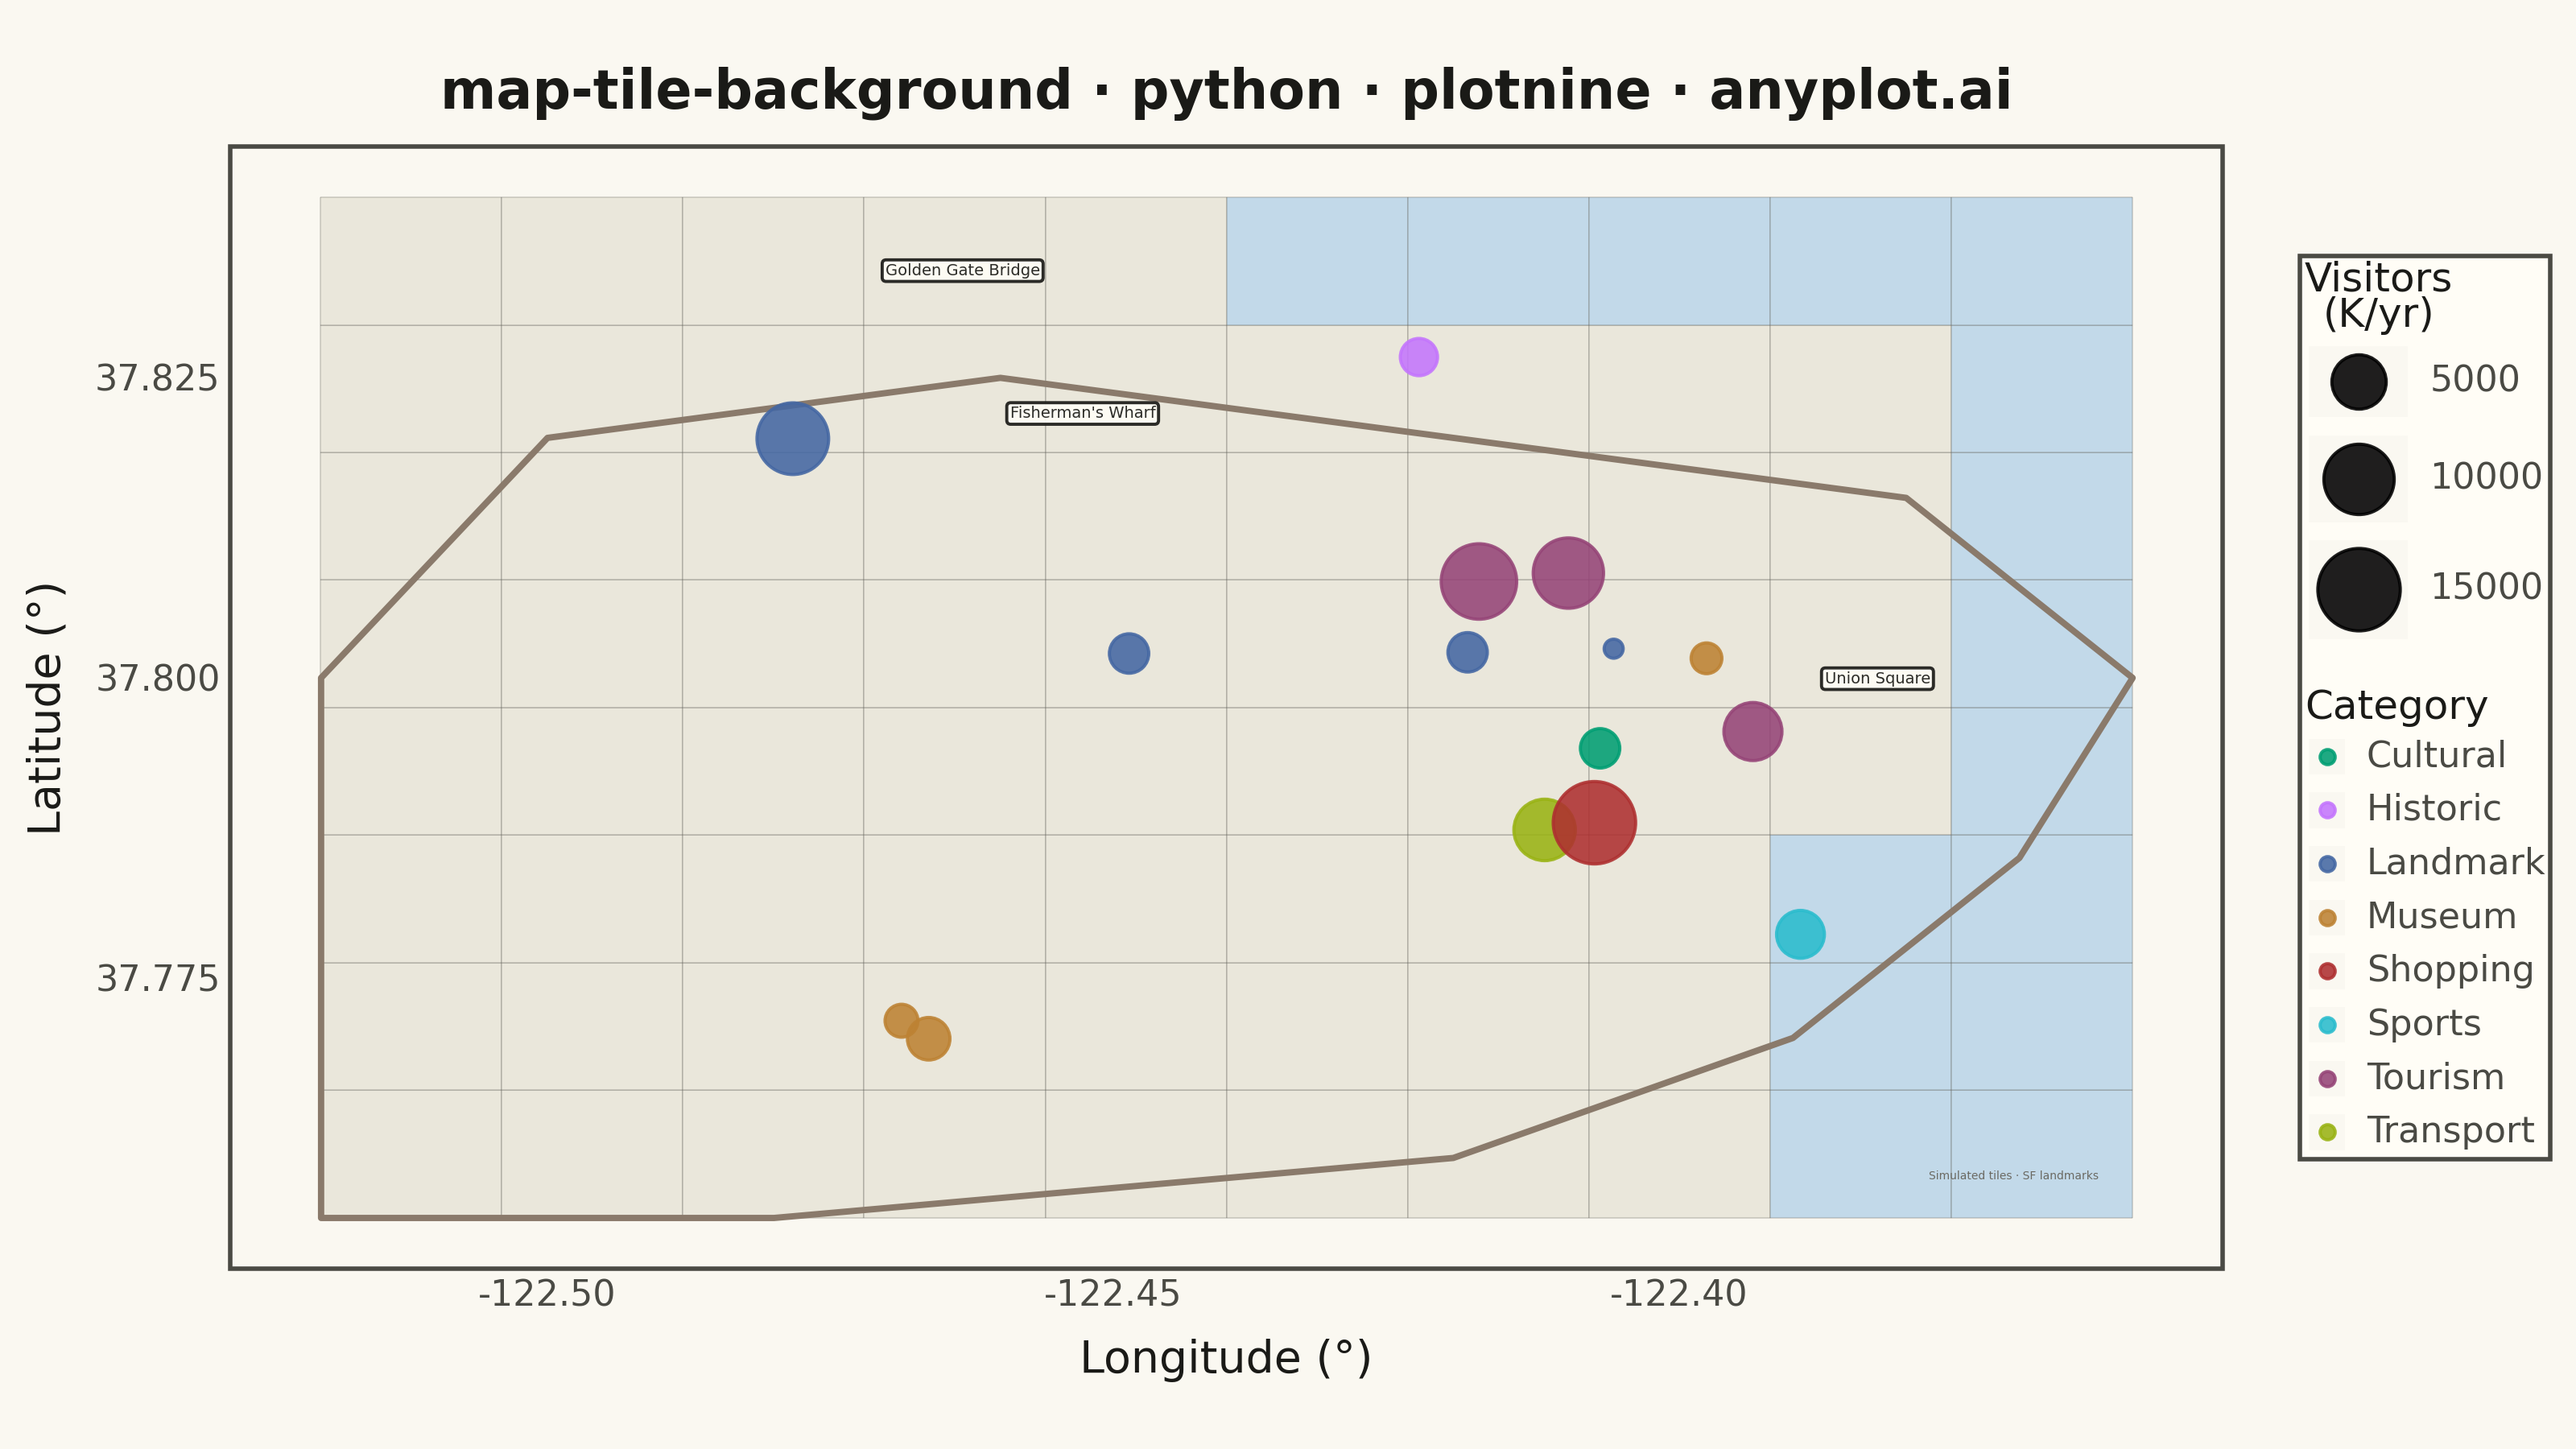
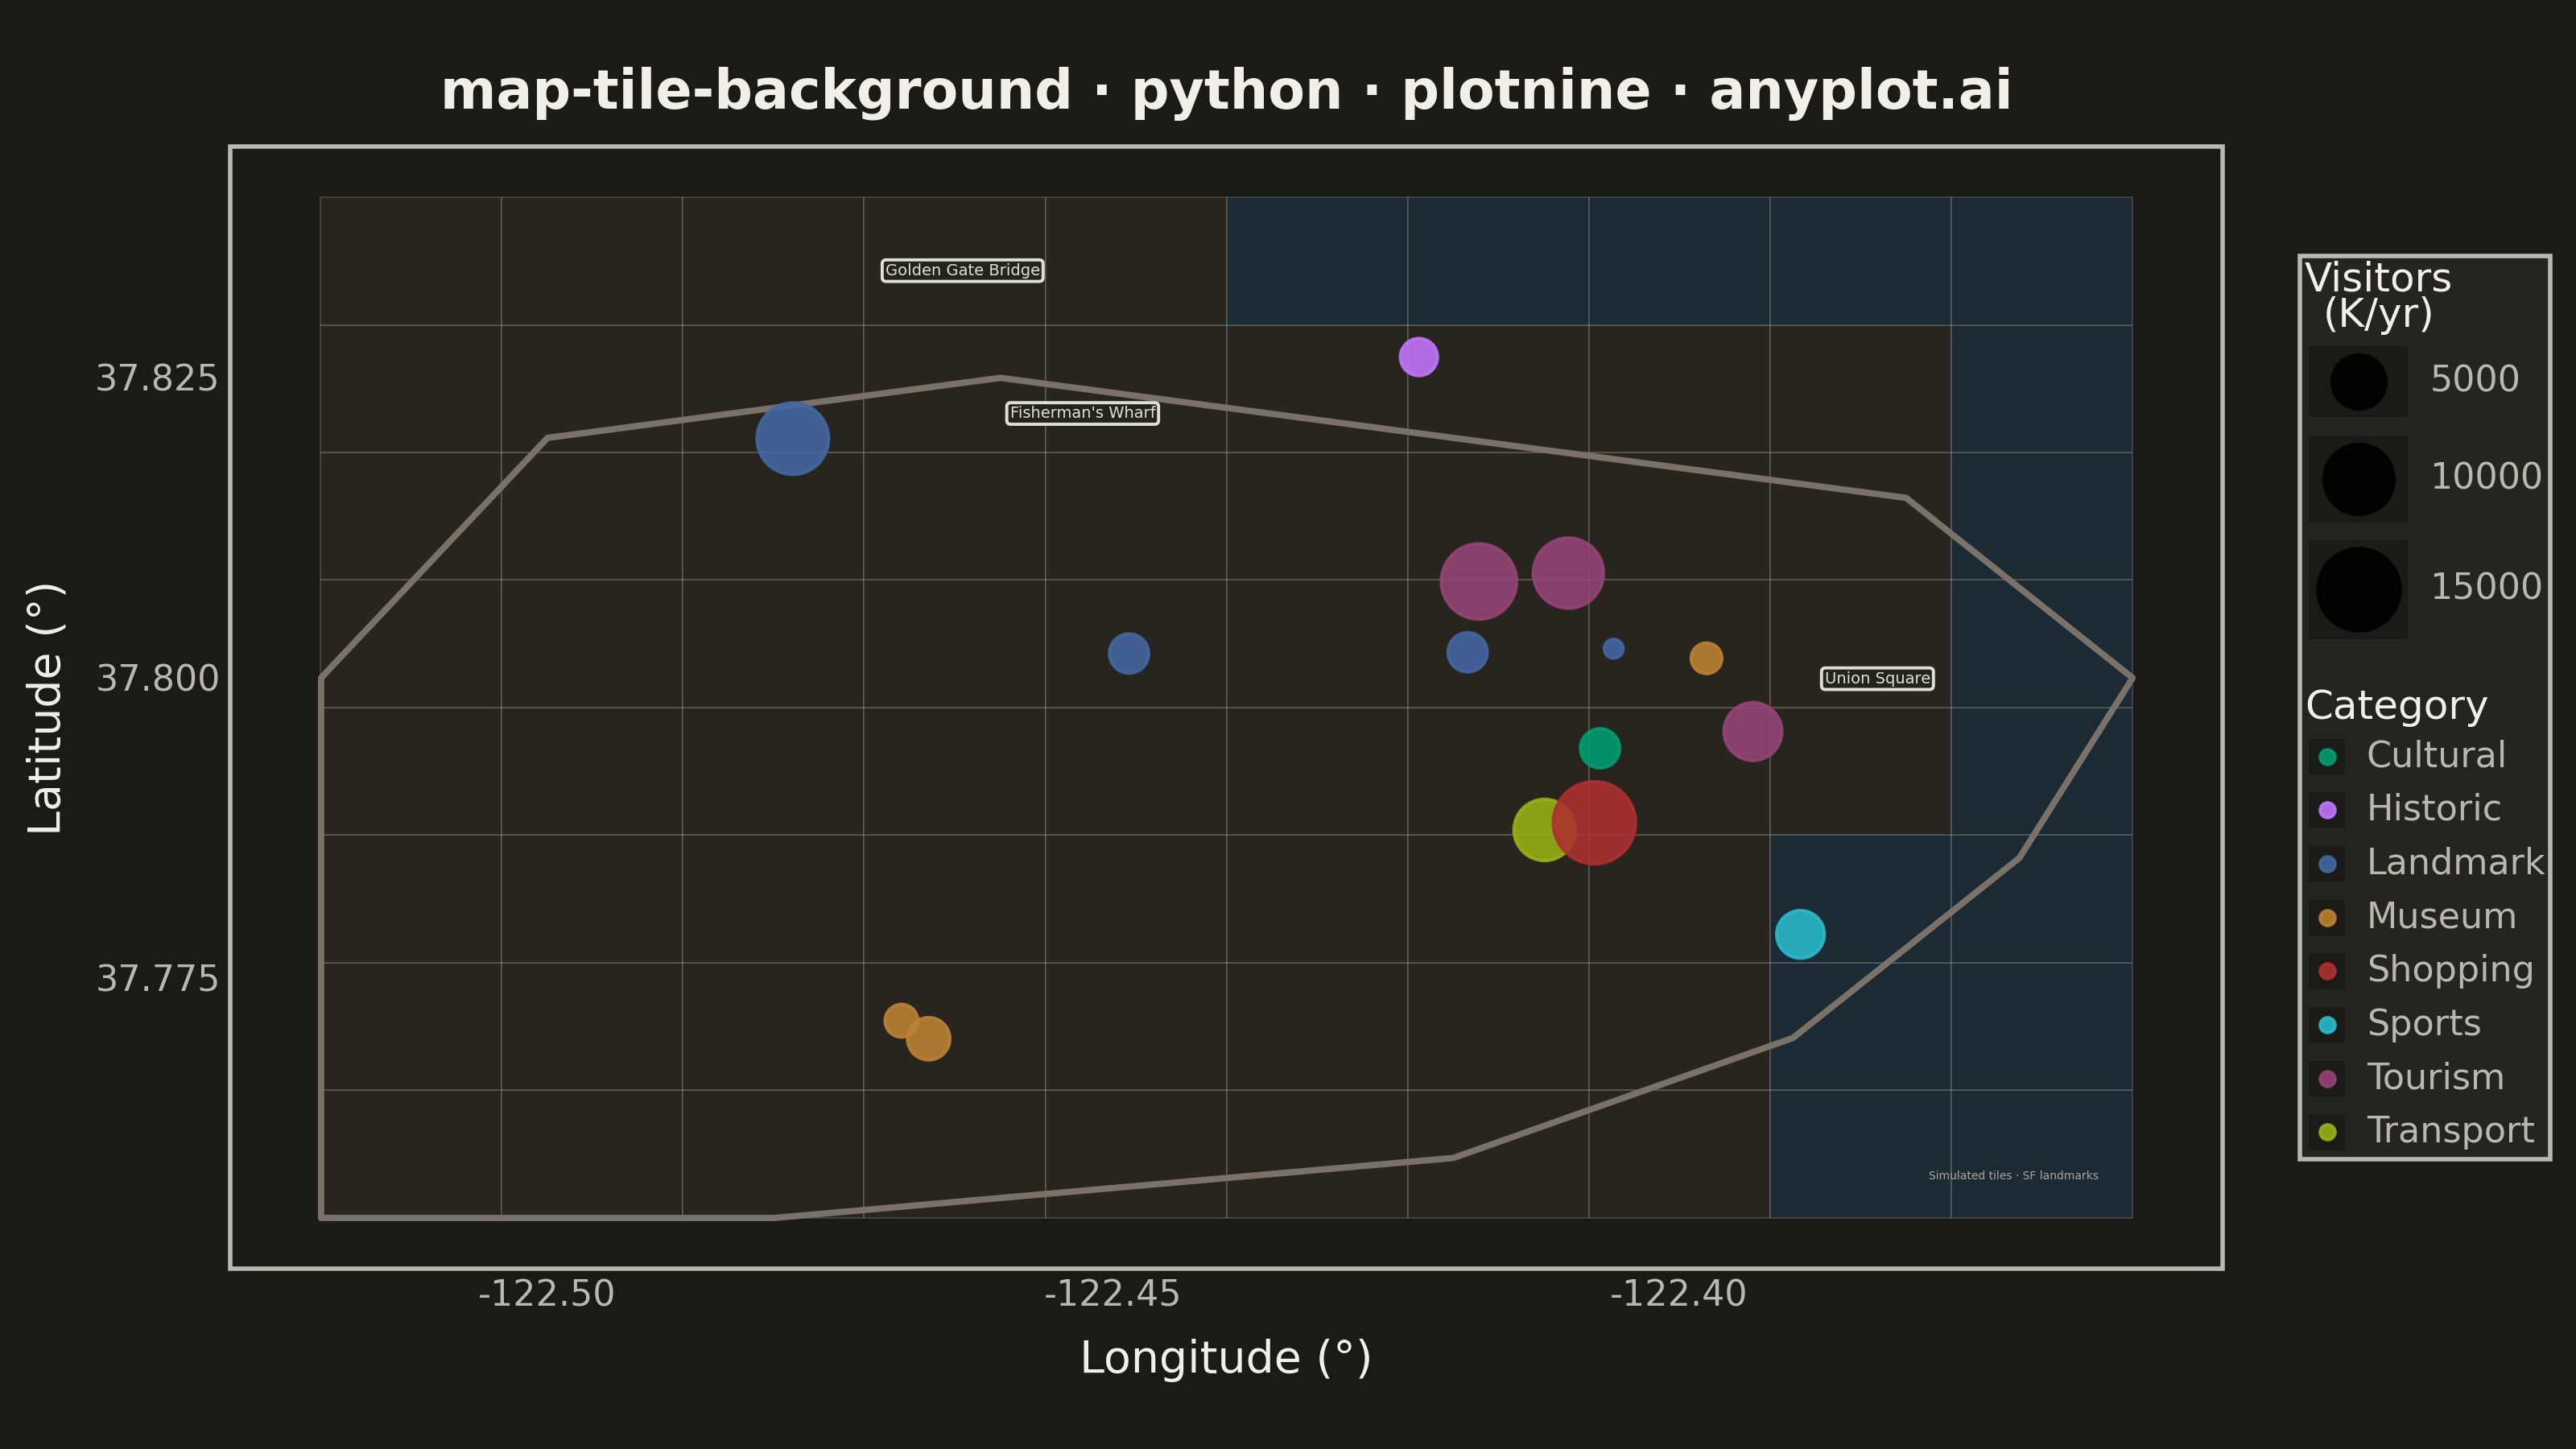
A map visualization that displays data points on top of tile-based backgrounds such as OpenStreetMap, Stamen, or satellite imagery. Unlike vector-based basemaps, tile backgrounds provide rich geographic context including street-level detail, terrain, or satellite imagery that loads dynamically as the user navigates. This visualization is essential for location-based analysis where real-world geographic context enhances data interpretation.
""" anyplot.ai
map-tile-background: Map with Tile Background
Library: plotnine 0.15.4 | Python 3.13.13
Quality: 82/100 | Updated: 2026-05-27
"""

import os
import sys

import numpy as np
import pandas as pd


# Work around naming conflict with plotnine.py script and plotnine package
script_dir = os.path.dirname(os.path.abspath(__file__))
if script_dir in sys.path:
    sys.path.remove(script_dir)
if "" in sys.path:
    sys.path.remove("")
if "." in sys.path:
    sys.path.remove(".")

from plotnine import (
    aes,
    annotate,
    coord_fixed,
    element_blank,
    element_rect,
    element_text,
    geom_label,
    geom_point,
    geom_polygon,
    geom_rect,
    ggplot,
    labs,
    scale_color_manual,
    scale_fill_manual,
    scale_size_continuous,
    theme,
    theme_minimal,
)


THEME = os.getenv("ANYPLOT_THEME", "light")
PAGE_BG = "#FAF8F1" if THEME == "light" else "#1A1A17"
ELEVATED_BG = "#FFFDF6" if THEME == "light" else "#242420"
INK = "#1A1A17" if THEME == "light" else "#F0EFE8"
INK_SOFT = "#4A4A44" if THEME == "light" else "#B8B7B0"
INK_MUTED = "#6B6A63" if THEME == "light" else "#A8A79F"

IMPRINT_PALETTE = ["#009E73", "#C475FD", "#4467A3", "#BD8233", "#AE3030", "#2ABCCD", "#954477", "#99B314"]

np.random.seed(42)

# San Francisco Bay Area landmarks with visitor counts (thousands per year)
landmarks_data = {
    "name": [
        "Golden Gate Bridge",
        "Alcatraz Island",
        "Fisherman's Wharf",
        "Pier 39",
        "Cable Cars",
        "Chinatown",
        "Union Square",
        "Ferry Building",
        "Palace of Fine Arts",
        "Coit Tower",
        "AT&T Park",
        "Exploratorium",
        "de Young Museum",
        "California Academy",
        "Lombard Street",
    ],
    "lat": [
        37.8199,
        37.8267,
        37.8080,
        37.8087,
        37.7873,
        37.7941,
        37.7879,
        37.7955,
        37.8020,
        37.8024,
        37.7786,
        37.8016,
        37.7714,
        37.7699,
        37.8021,
    ],
    "lon": [
        -122.4783,
        -122.4230,
        -122.4177,
        -122.4098,
        -122.4119,
        -122.4070,
        -122.4075,
        -122.3935,
        -122.4486,
        -122.4058,
        -122.3893,
        -122.3976,
        -122.4687,
        -122.4663,
        -122.4187,
    ],
    "visitors": [10500, 1700, 12000, 10000, 7000, 2000, 15000, 6000, 2000, 500, 3500, 1000, 1200, 2500, 2000],
    "category": [
        "Landmark",
        "Historic",
        "Tourism",
        "Tourism",
        "Transport",
        "Cultural",
        "Shopping",
        "Tourism",
        "Landmark",
        "Landmark",
        "Sports",
        "Museum",
        "Museum",
        "Museum",
        "Landmark",
    ],
}

df = pd.DataFrame(landmarks_data)

# Simulated tile-style background using grid rectangles
lon_min, lon_max = -122.52, -122.36
lat_min, lat_max = 37.755, 37.84

n_tiles_x = 10
n_tiles_y = 8
tile_width = (lon_max - lon_min) / n_tiles_x
tile_height = (lat_max - lat_min) / n_tiles_y

# Theme-adaptive terrain colors
water_color = "#B8D4E8" if THEME == "light" else "#1D2E3A"
land_color = "#E8E4D8" if THEME == "light" else "#2B2820"
coast_color = "#8A7A6B" if THEME == "light" else "#7A7268"

tiles = []
for i in range(n_tiles_x):
    for j in range(n_tiles_y):
        x_center = lon_min + tile_width * (i + 0.5)
        y_center = lat_min + tile_height * (j + 0.5)

        is_water = (
            (x_center > -122.39 and y_center < 37.79)
            or (x_center > -122.44 and y_center > 37.825)
            or (x_center > -122.37)
        )

        tiles.append(
            {
                "xmin": lon_min + tile_width * i,
                "xmax": lon_min + tile_width * (i + 1),
                "ymin": lat_min + tile_height * j,
                "ymax": lat_min + tile_height * (j + 1),
                "terrain": "water" if is_water else "land",
            }
        )

df_tiles = pd.DataFrame(tiles)

# Coastline polygon (San Francisco peninsula outline)
coast_coords = [
    (-122.52, 37.755),
    (-122.48, 37.755),
    (-122.42, 37.76),
    (-122.39, 37.77),
    (-122.37, 37.785),
    (-122.36, 37.80),
    (-122.38, 37.815),
    (-122.42, 37.82),
    (-122.46, 37.825),
    (-122.50, 37.82),
    (-122.52, 37.80),
    (-122.52, 37.755),
]

coastline = [{"region": "sf", "order": i, "lon": c[0], "lat": c[1]} for i, c in enumerate(coast_coords)]
df_coast = pd.DataFrame(coastline)

# Imprint palette assigned alphabetically by category
categories_sorted = sorted(df["category"].unique())
category_colors = {cat: IMPRINT_PALETTE[i] for i, cat in enumerate(categories_sorted)}

# Labels for top 3 most-visited landmarks (well-separated geographically)
top3 = df.nlargest(3, "visitors")  # Union Square, Fisherman's Wharf, Golden Gate Bridge
label_positions = {
    "Union Square": {"nudge_x": 0.025, "nudge_y": 0.012},
    "Fisherman's Wharf": {"nudge_x": -0.035, "nudge_y": 0.014},
    "Golden Gate Bridge": {"nudge_x": 0.015, "nudge_y": 0.014},
}

label_records = []
for _, row in top3.iterrows():
    pos = label_positions.get(row["name"], {"nudge_x": 0, "nudge_y": 0.012})
    label_records.append({"name": row["name"], "lon": row["lon"] + pos["nudge_x"], "lat": row["lat"] + pos["nudge_y"]})
label_df = pd.DataFrame(label_records)

title = "map-tile-background · python · plotnine · anyplot.ai"

plot = (
    ggplot()
    + geom_rect(
        aes(xmin="xmin", xmax="xmax", ymin="ymin", ymax="ymax", fill="terrain"),
        data=df_tiles,
        color=INK_MUTED,
        size=0.05,
        alpha=0.85,
    )
    + scale_fill_manual(values={"water": water_color, "land": land_color}, guide=None)
    + geom_polygon(aes(x="lon", y="lat", group="region"), data=df_coast, fill="none", color=coast_color, size=0.8)
    + geom_point(aes(x="lon", y="lat", color="category", size="visitors"), data=df, alpha=0.88, stroke=0.4)
    + scale_size_continuous(range=(2, 10), name="Visitors\n(K/yr)")
    + scale_color_manual(values=category_colors, name="Category")
    + geom_label(
        aes(x="lon", y="lat", label="name"),
        data=label_df,
        size=3.5,
        alpha=0.92,
        fill=ELEVATED_BG,
        color=INK,
        label_padding=0.2,
    )
    + annotate(
        "text",
        x=lon_max - 0.003,
        y=lat_min + 0.003,
        label="Simulated tiles · SF landmarks",
        size=2.5,
        ha="right",
        va="bottom",
        color=INK_MUTED,
    )
    + coord_fixed(ratio=1.06, xlim=(lon_min, lon_max), ylim=(lat_min, lat_max))
    + labs(title=title, x="Longitude (°)", y="Latitude (°)")
    + theme_minimal()
    + theme(
        figure_size=(8, 4.5),
        plot_background=element_rect(fill=PAGE_BG, color=PAGE_BG),
        panel_background=element_rect(fill=PAGE_BG),
        panel_grid_major=element_blank(),
        panel_grid_minor=element_blank(),
        panel_border=element_rect(color=INK_SOFT, fill=None),
        plot_title=element_text(size=12, weight="bold", ha="center", color=INK),
        axis_title=element_text(size=10, color=INK),
        axis_text=element_text(size=8, color=INK_SOFT),
        legend_title=element_text(size=9, color=INK),
        legend_text=element_text(size=8, color=INK_SOFT),
        legend_background=element_rect(fill=ELEVATED_BG, color=INK_SOFT),
        legend_position="right",
        legend_key_size=10,
        plot_margin=0.01,
    )
)

plot.save(f"plot-{THEME}.png", dpi=400, width=8, height=4.5, units="in", verbose=False)
Runnable source as JSON, for any HTTP client: https://api.anyplot.ai/specs/map-tile-background/plotnine/code. Any spec id and library id listed in llms-full.txt fit the same URL shape; every URL below is complete and callable.
{
  "spec_id": "map-tile-background",
  "language": "python",
  "library": "plotnine",
  "page": "https://anyplot.ai/map-tile-background/python/plotnine",
  "hub": "https://anyplot.ai/map-tile-background",
  "code_json": "https://api.anyplot.ai/specs/map-tile-background/plotnine/code",
  "spec_json": "https://api.anyplot.ai/specs/map-tile-background",
  "render_light_png": "https://storage.googleapis.com/anyplot-images/plots/map-tile-background/python/plotnine/plot-light.png",
  "render_dark_png": "https://storage.googleapis.com/anyplot-images/plots/map-tile-background/python/plotnine/plot-dark.png",
  "quality_score": 82.0,
  "license": "MIT",
  "guide": "https://anyplot.ai/llms.txt"
}
Part of Map with Tile Background on anyplot.ai.