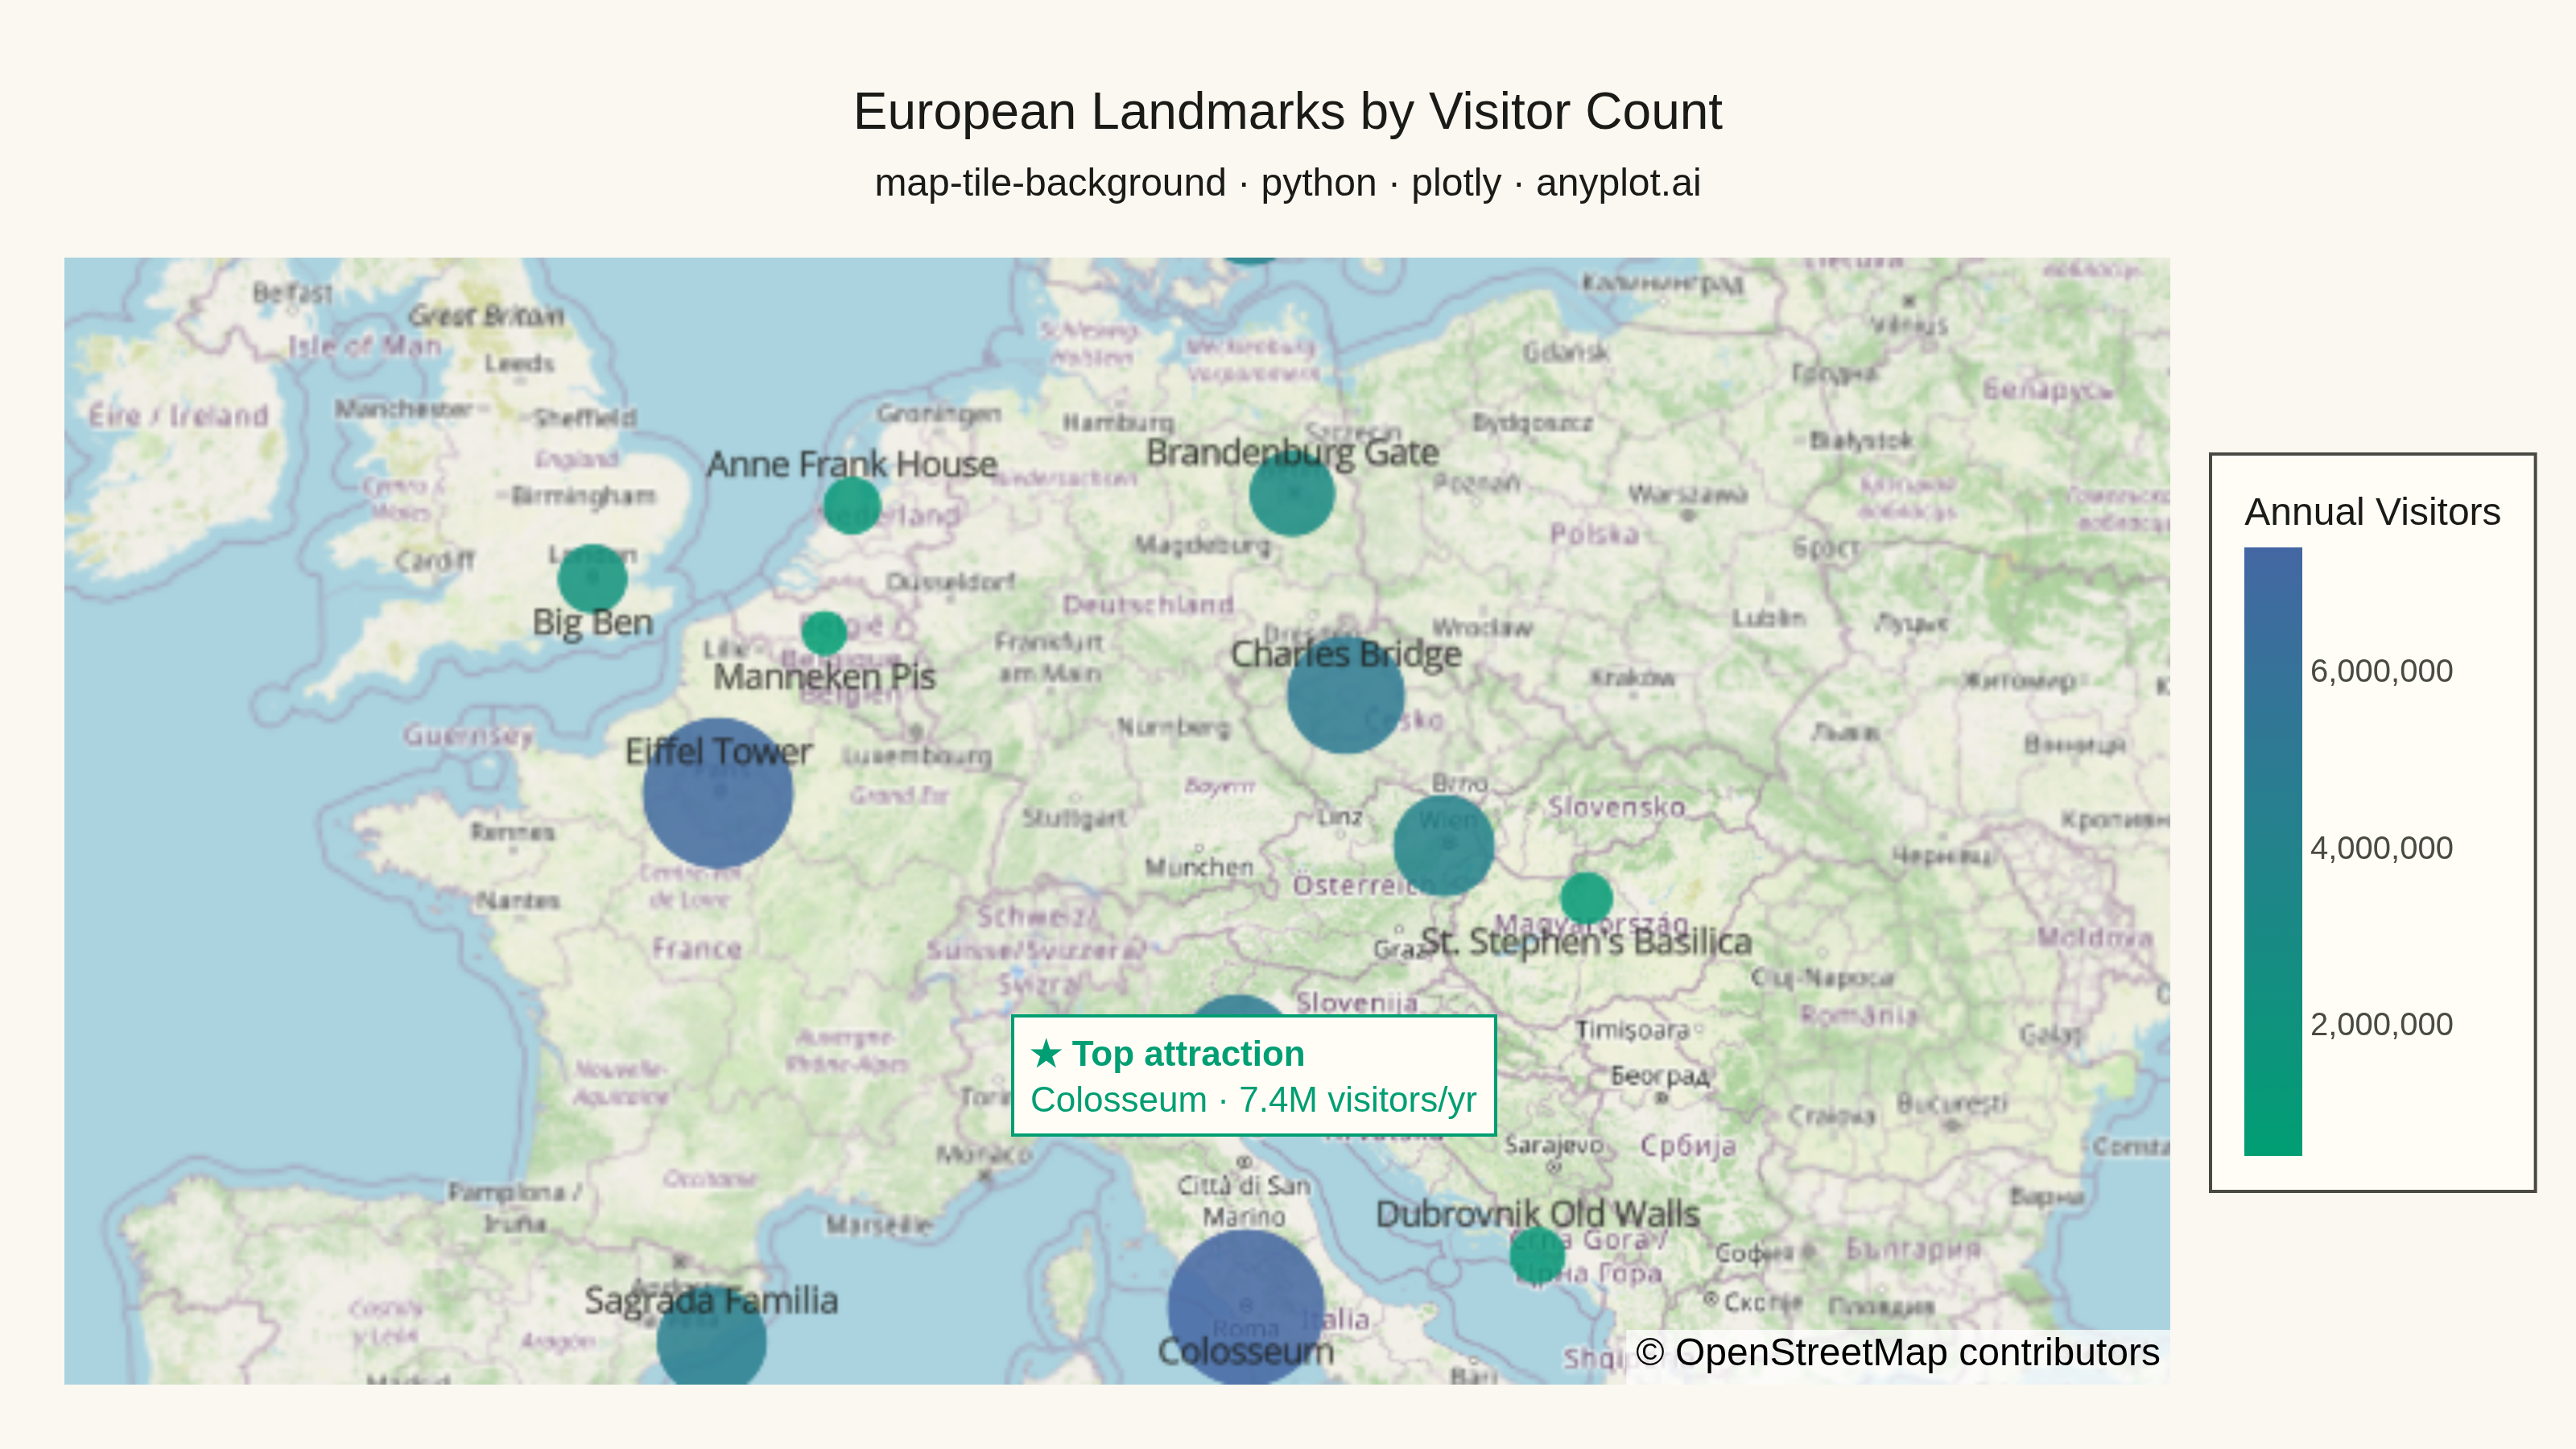
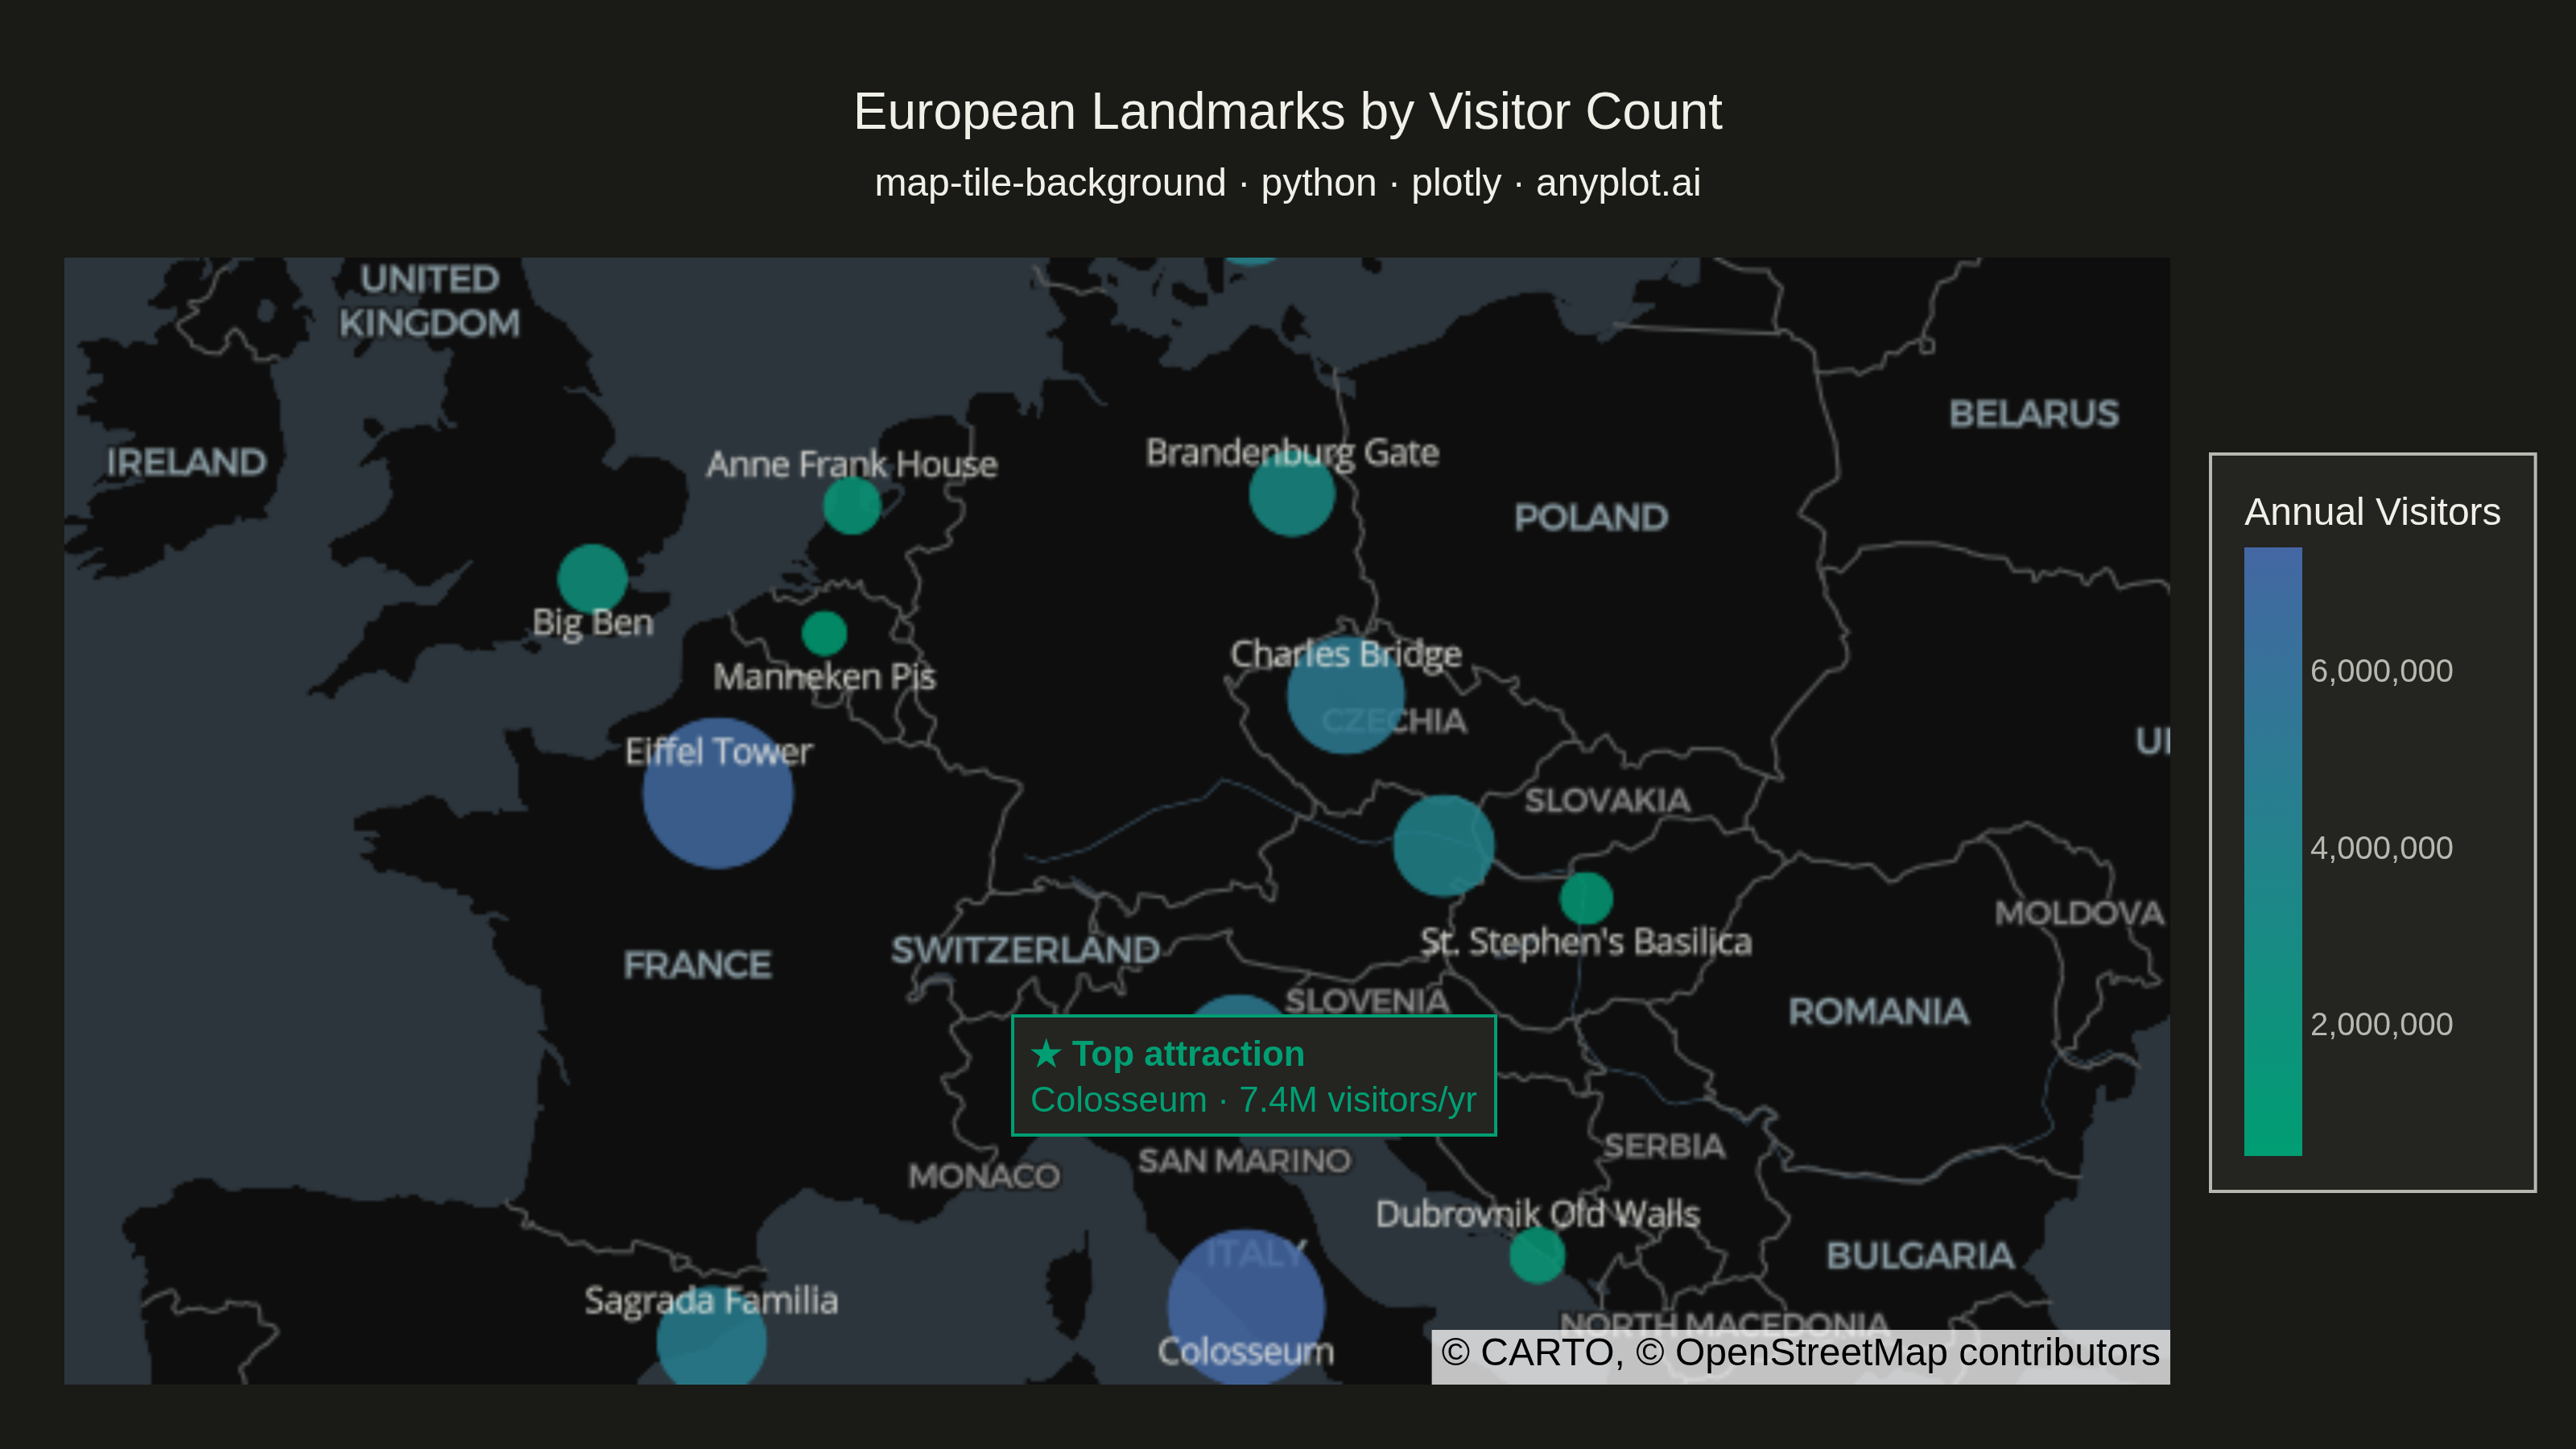
A map visualization that displays data points on top of tile-based backgrounds such as OpenStreetMap, Stamen, or satellite imagery. Unlike vector-based basemaps, tile backgrounds provide rich geographic context including street-level detail, terrain, or satellite imagery that loads dynamically as the user navigates. This visualization is essential for location-based analysis where real-world geographic context enhances data interpretation.
""" anyplot.ai
map-tile-background: Map with Tile Background
Library: plotly 6.7.0 | Python 3.13.13
Quality: 87/100 | Updated: 2026-05-27
"""

import os
import sys


# Remove this script's directory from sys.path so "plotly.py" doesn't shadow
# the installed plotly package when Python prepends the script dir.
_script_dir = os.path.dirname(os.path.abspath(__file__))
sys.path = [p for p in sys.path if os.path.abspath(p) != _script_dir]

import numpy as np
import plotly.graph_objects as go


THEME = os.getenv("ANYPLOT_THEME", "light")

# Theme-adaptive chrome
PAGE_BG = "#FAF8F1" if THEME == "light" else "#1A1A17"
ELEVATED_BG = "#FFFDF6" if THEME == "light" else "#242420"
INK = "#1A1A17" if THEME == "light" else "#F0EFE8"
INK_SOFT = "#4A4A44" if THEME == "light" else "#B8B7B0"

# Anyplot sequential colorscale: brand green → blue (single-polarity continuous)
imprint_seq = [[0.0, "#009E73"], [1.0, "#4467A3"]]

# Theme-adaptive map tile style
map_style = "open-street-map" if THEME == "light" else "carto-darkmatter"

# Data — European City Landmarks with annual visitor counts
np.random.seed(42)

names = [
    "Eiffel Tower",
    "Colosseum",
    "Sagrada Familia",
    "Big Ben",
    "Brandenburg Gate",
    "Anne Frank House",
    "Acropolis",
    "Charles Bridge",
    "St. Stephen's Basilica",
    "Royal Palace",
    "Manneken Pis",
    "Tivoli Gardens",
    "Schönbrunn Palace",
    "Dubrovnik Old Walls",
    "Rialto Bridge",
]
lats = [
    48.8584,  # Eiffel Tower
    41.8902,  # Colosseum
    41.4036,  # Sagrada Familia
    51.5007,  # Big Ben
    52.5163,  # Brandenburg Gate
    52.3752,  # Anne Frank House
    37.9715,  # Acropolis
    50.0865,  # Charles Bridge
    47.5008,  # St. Stephen's Basilica
    59.3268,  # Royal Palace
    50.8450,  # Manneken Pis
    55.6736,  # Tivoli Gardens
    48.1845,  # Schönbrunn Palace
    42.6411,  # Dubrovnik Old Walls
    45.4380,  # Rialto Bridge
]
lons = [
    2.2945,  # Eiffel Tower
    12.4922,  # Colosseum
    2.1744,  # Sagrada Familia
    -0.1246,  # Big Ben
    13.3777,  # Brandenburg Gate
    4.8840,  # Anne Frank House
    23.7267,  # Acropolis
    14.4114,  # Charles Bridge
    19.0538,  # St. Stephen's Basilica
    18.0717,  # Royal Palace
    4.3499,  # Manneken Pis
    12.5681,  # Tivoli Gardens
    16.3119,  # Schönbrunn Palace
    18.1085,  # Dubrovnik Old Walls
    12.3358,  # Rialto Bridge
]
visitors = np.array(
    [
        7_000_000,  # Eiffel Tower
        7_400_000,  # Colosseum
        4_500_000,  # Sagrada Familia
        2_000_000,  # Big Ben
        3_000_000,  # Brandenburg Gate
        1_300_000,  # Anne Frank House
        3_000_000,  # Acropolis
        5_000_000,  # Charles Bridge
        1_000_000,  # St. Stephen's Basilica
        1_500_000,  # Royal Palace
        500_000,  # Manneken Pis
        4_000_000,  # Tivoli Gardens
        4_000_000,  # Schönbrunn Palace
        1_200_000,  # Dubrovnik Old Walls
        5_000_000,  # Rialto Bridge
    ]
)

# Scale visitor counts to marker diameters (15–50 px range)
sizes = 15 + (visitors - visitors.min()) / (visitors.max() - visitors.min()) * 35
vmin, vmax = int(visitors.min()), int(visitors.max())

# Split into two groups to alternate textposition for the crowded NW Europe cluster:
# "bottom center" for Big Ben, St. Stephen's, Schönbrunn, Manneken Pis, Colosseum, Rialto
bottom_idx = {3, 8, 12, 10, 1, 14}
top_idx = set(range(len(names))) - bottom_idx


def _select(seq, indices):
    return [seq[i] for i in sorted(indices)]


fig = go.Figure()

# Main trace (top center labels) — carries colorbar
fig.add_trace(
    go.Scattermap(
        lat=_select(lats, top_idx),
        lon=_select(lons, top_idx),
        mode="markers+text",
        marker={
            "size": _select(list(sizes), top_idx),
            "color": _select(list(visitors), top_idx),
            "colorscale": imprint_seq,
            "cmin": vmin,
            "cmax": vmax,
            "colorbar": {
                "title": {"text": "Annual Visitors", "font": {"size": 12, "color": INK}},
                "tickfont": {"size": 10, "color": INK_SOFT},
                "bgcolor": ELEVATED_BG,
                "bordercolor": INK_SOFT,
                "borderwidth": 1,
                "thickness": 18,
                "len": 0.65,
                "tickformat": ",.0f",
            },
            "opacity": 0.85,
        },
        text=_select(names, top_idx),
        textposition="top center",
        textfont={"size": 11, "color": INK},
        hovertemplate=("<b>%{text}</b><br>Visitors: %{marker.color:,.0f}<extra></extra>"),
    )
)

# Secondary trace (bottom center labels) — no colorbar, same scale
fig.add_trace(
    go.Scattermap(
        lat=_select(lats, bottom_idx),
        lon=_select(lons, bottom_idx),
        mode="markers+text",
        marker={
            "size": _select(list(sizes), bottom_idx),
            "color": _select(list(visitors), bottom_idx),
            "colorscale": imprint_seq,
            "cmin": vmin,
            "cmax": vmax,
            "showscale": False,
            "opacity": 0.85,
        },
        text=_select(names, bottom_idx),
        textposition="bottom center",
        textfont={"size": 11, "color": INK},
        hovertemplate=("<b>%{text}</b><br>Visitors: %{marker.color:,.0f}<extra></extra>"),
    )
)

fig.update_layout(
    autosize=False,
    paper_bgcolor=PAGE_BG,
    font={"color": INK},
    title={
        "text": (
            "European Landmarks by Visitor Count<br>"
            "<span style='font-size:12px'>"
            "map-tile-background · python · plotly · anyplot.ai"
            "</span>"
        ),
        "font": {"size": 16, "color": INK},
        "x": 0.5,
        "xanchor": "center",
    },
    map={"style": map_style, "center": {"lat": 48.5, "lon": 10.0}, "zoom": 3.5},
    margin={"l": 20, "r": 20, "t": 80, "b": 20},
    showlegend=False,
    annotations=[
        {
            "text": "<b>★ Top attraction</b><br>Colosseum · 7.4M visitors/yr",
            "xref": "paper",
            "yref": "paper",
            "x": 0.68,
            "y": 0.22,
            "showarrow": False,
            "font": {"size": 11, "color": "#009E73"},
            "bgcolor": ELEVATED_BG,
            "bordercolor": "#009E73",
            "borderwidth": 1,
            "borderpad": 5,
            "align": "left",
        }
    ],
)

fig.write_image(f"plot-{THEME}.png", width=800, height=450, scale=4)
fig.write_html(f"plot-{THEME}.html", include_plotlyjs="cdn")
Runnable source as JSON, for any HTTP client: https://api.anyplot.ai/specs/map-tile-background/plotly/code. Any spec id and library id listed in llms-full.txt fit the same URL shape; every URL below is complete and callable.
{
  "spec_id": "map-tile-background",
  "language": "python",
  "library": "plotly",
  "page": "https://anyplot.ai/map-tile-background/python/plotly",
  "hub": "https://anyplot.ai/map-tile-background",
  "code_json": "https://api.anyplot.ai/specs/map-tile-background/plotly/code",
  "spec_json": "https://api.anyplot.ai/specs/map-tile-background",
  "render_light_png": "https://storage.googleapis.com/anyplot-images/plots/map-tile-background/python/plotly/plot-light.png",
  "render_dark_png": "https://storage.googleapis.com/anyplot-images/plots/map-tile-background/python/plotly/plot-dark.png",
  "interactive_light_html": "https://storage.googleapis.com/anyplot-images/plots/map-tile-background/python/plotly/plot-light.html",
  "interactive_dark_html": "https://storage.googleapis.com/anyplot-images/plots/map-tile-background/python/plotly/plot-dark.html",
  "quality_score": 87.0,
  "license": "MIT",
  "guide": "https://anyplot.ai/llms.txt"
}
Part of Map with Tile Background on anyplot.ai.